Triple Bottom Pattern: When a Selloff Fails Three Times in a Row
The Triple Bottom pattern is a robust bullish reversal signal in technical analysis, often appearing after a persistent downtrend. Think of it as the market hammering a floor three times - forming three troughs at roughly the same level - before surging upward. When this pattern emerges, it’s a loud signal that bearish momentum is crumbling, giving traders a prime opportunity to buy or go long as an uptrend kicks in.
How to Identify the Triple Bottom Pattern in Trading
The Triple Bottom is a powerful bullish reversal pattern. It signals that selling pressure has been absorbed and buyers are ready to take control. Formed after a prolonged downtrend, it features three distinct lows at roughly the same level before price breaks higher. Here’s how to recognize it:
Start with the Market Context
Look for this setup after a clear downtrend. The Triple Bottom suggests bear exhaustion — each new attempt to push lower fails, indicating strong demand near the same price zone.
Identify the Three Lows
The pattern’s structure is its defining feature. Watch how price action unfolds:
- First Bottom: Marks the initial support level after an extended decline.
- Second Bottom: Price rebounds, then revisits the same support zone, showing buyers defending the area.
- Third Bottom: Another failed attempt to break lower — this confirms the base and signals weakening sellers.
Between each low, price rallies to form swing highs, which collectively create the resistance line.
Draw the Resistance Line
Connect the swing highs between the bottoms — this forms the neckline or resistance level. The pattern completes when price breaks above this barrier, confirming a bullish reversal.
Watch the Breakout
The confirmation trigger comes when price closes above the neckline with strength.
- A decisive breakout candle or
- A high-volume surge
Both signal that buyers have regained control, providing an ideal entry point.
Confirm with Volume Behavior
Volume often tells the story behind the pattern.
- Declines during the lows, showing waning selling pressure.
- Increases on each rebound, hinting at accumulation.
- Surges on the breakout, confirming the shift in momentum.
Reach Up: Measure the height from the bottoms to the neckline and project it upward from the break for a solid price target.
How to Trade the Triple Bottom Pattern (Trading Example)
To illustrate how the Triple Bottom pattern can be used to enter a trade, we will choose the ETH/USDT pair. This large-cap altcoin formed a multi-month base on the daily chart, setting up a potential long trade with a clearly defined structure.
Analysis
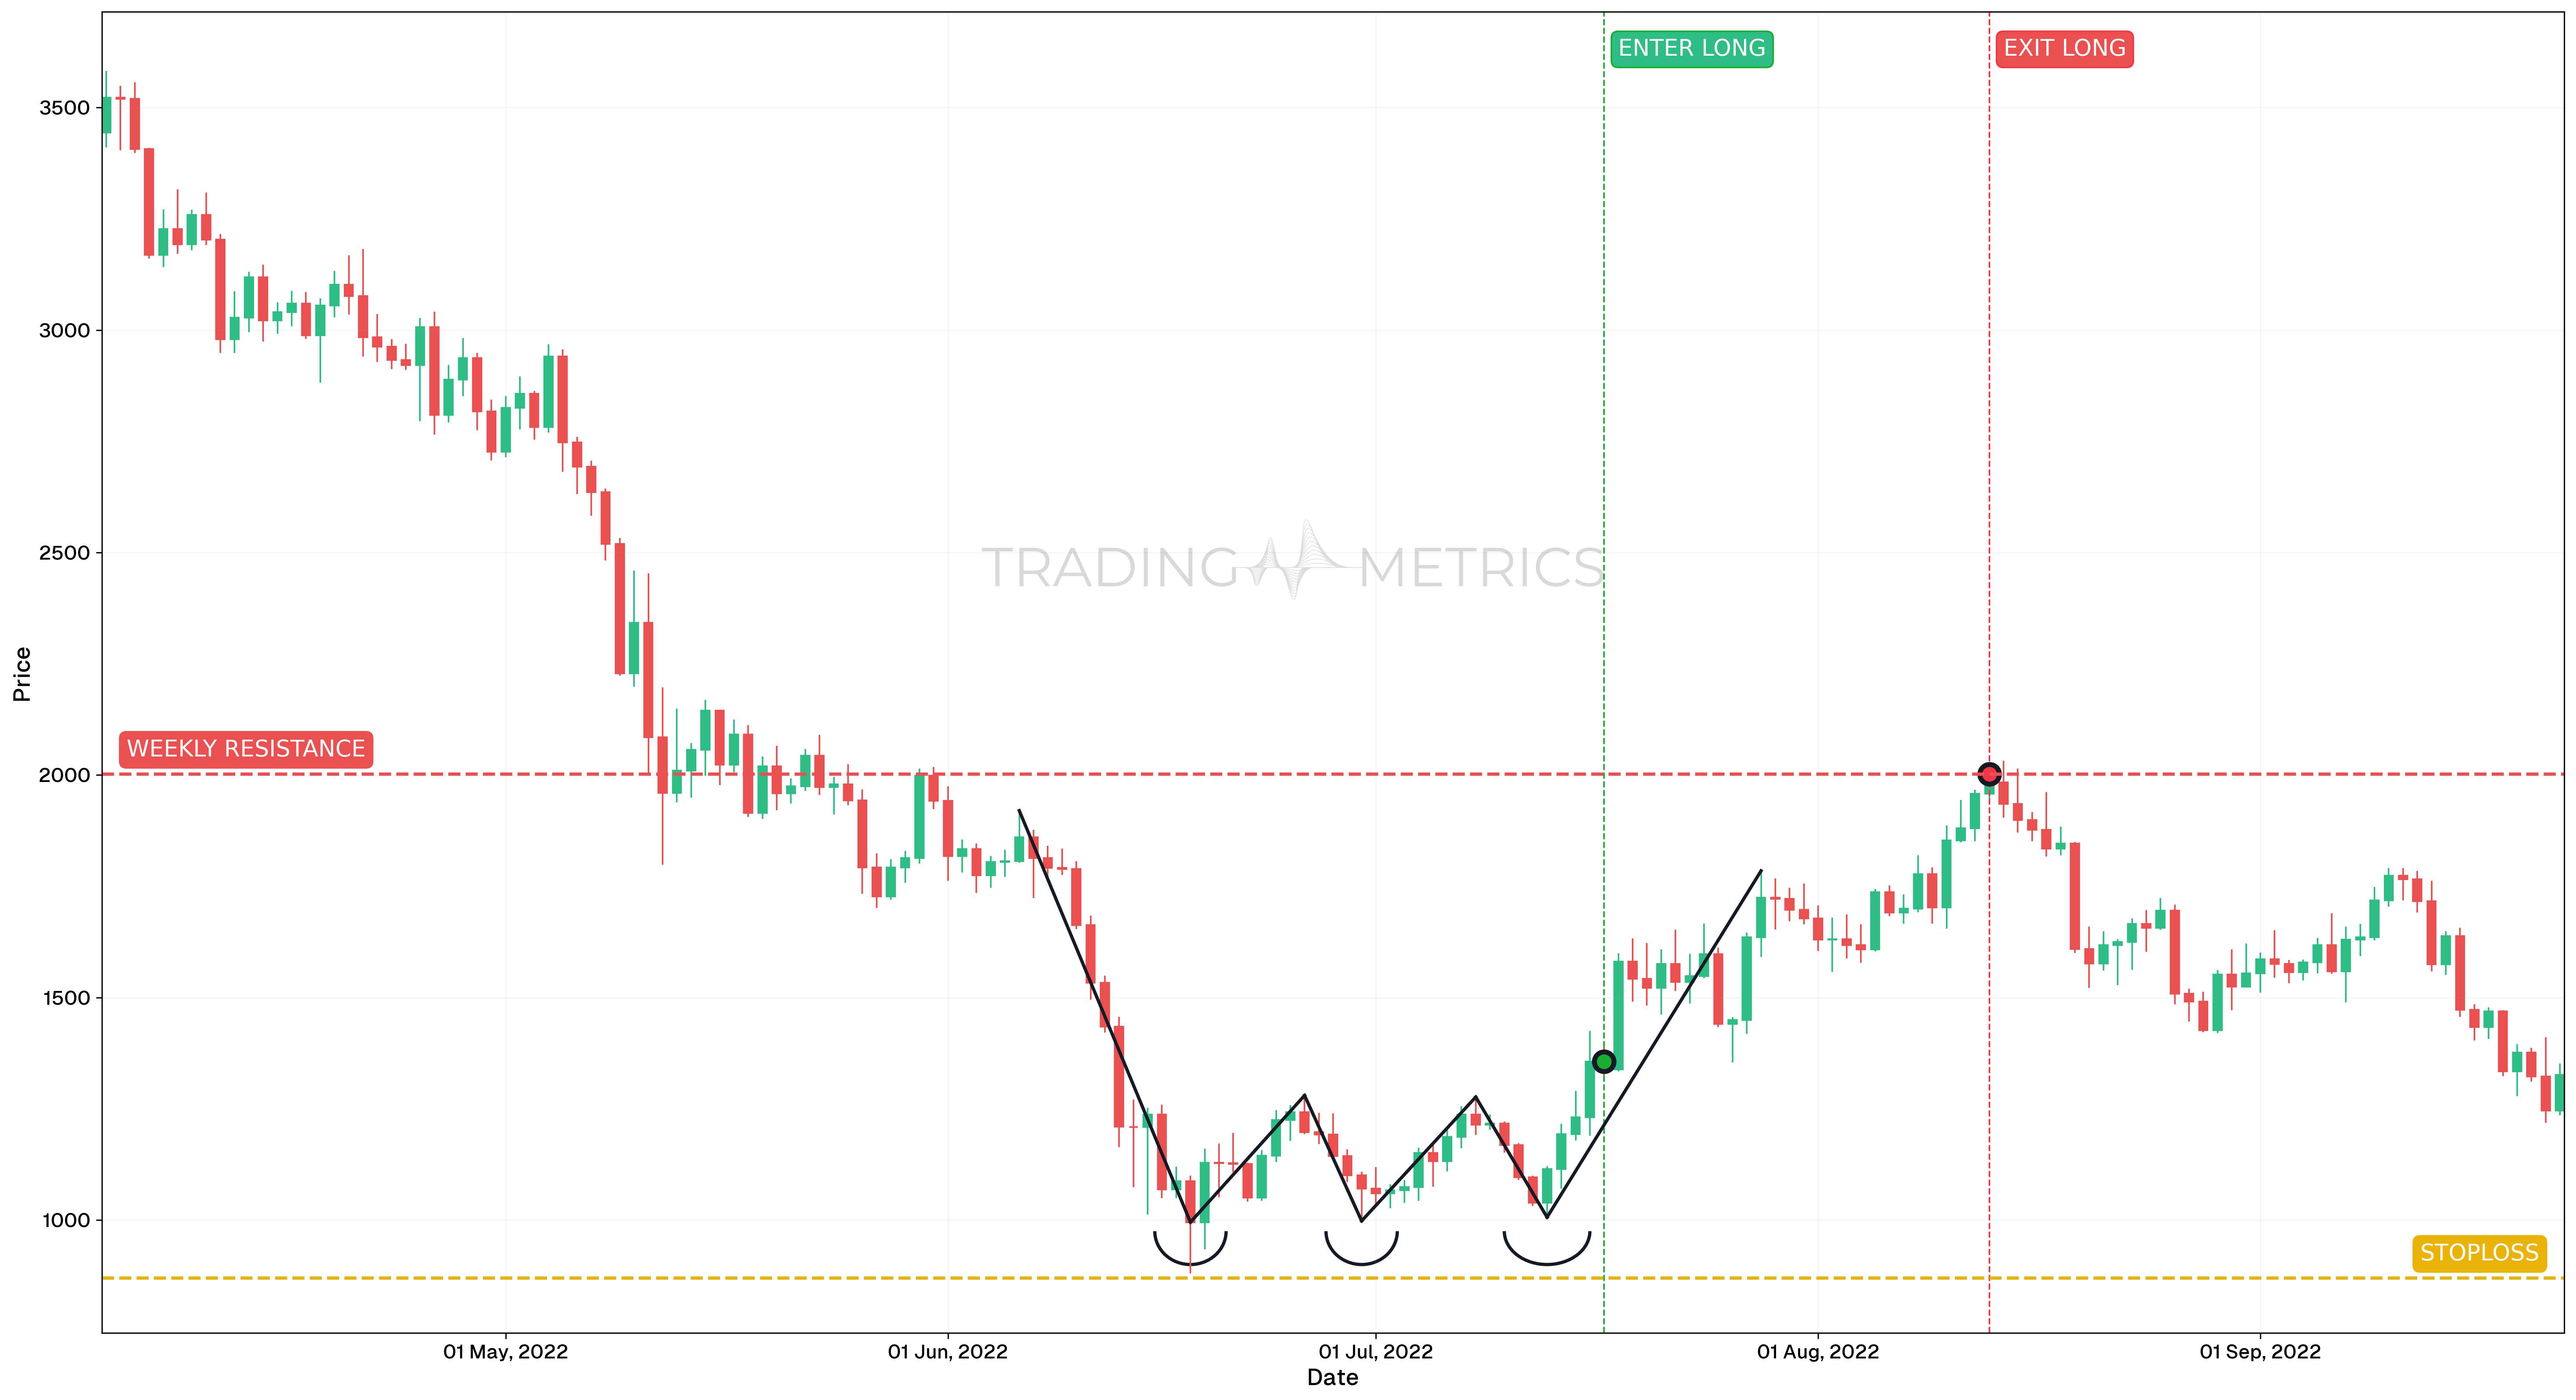
Between April and July 2022, ETH/USDT formed a classic Triple Bottom pattern. The price tested the same support zone three times, each with rejection from lower levels. This repetitive bottoming behavior showed sustained buying pressure at the base. In mid-July, a breakout above the neckline confirmed bullish momentum.
Trade Setup
- Entry: The trade was entered on July 17, 2022, at $1,355.57, following a breakout above the neckline of the Triple Bottom pattern. Entry was supported by momentum confirmation: RSI crossed above its own moving average, indicating strength behind the move.
- Exit: The position was closed on August 13, 2022, at $2,002.17, just below a prior support-turned-resistance zone. This target respected market structure and preserved profits after a strong rally.
- Outcome: The Triple Bottom resulted in a 47.7% gain from entry to exit. The pattern completed successfully, and the breakout was supported by both structural and momentum-based evidence.
Risk Management
- Stop-Loss placement: The stop-loss was placed at $869.35, below the lowest bottom of the pattern. This ensured protection if the bullish setup failed and price made a new low.
- Position sizing: The trade used a 2% capital risk model, calculated based on the distance between the entry and stop-loss levels.
- Risk-Reward Ratio: The trade produced a Risk-Reward Ratio of 1:1.33 - a modest but acceptable return for a high-confidence reversal pattern.
- Volatility Consideration: During the bottoming process, Volatility remained relatively low, helping to form clean support tests. Breakout volatility increased but was contained through disciplined entry and exit planning.
- Adaptive Exit Strategy: For more aggressive traders, additional upside toward $2,150 could have been targeted. However, the conservative exit near structural resistance ensured profit protection before potential trend exhaustion.
Volume Boost: A volume surge on the neckline break lifts the pattern into a bullish charge.
Pre-Trade Checklist
Triple Check: Match the pattern with volume jumps and indicators like RSI to dodge fakes and boost your shot.
Key Points
- Bottom Alignment: Closer bottoms enhance reliability - big mismatches dilute it.
- Time Frame: Packs more punch on daily or weekly charts.
- Combine with Indicators: Pair with moving averages or RSI for precision.
- Breakout Confirmation: The neckline break turns the tide - don’t jump the gun.
- Price Target: Measure from bottoms to neckline, project up from the break for your goal.
- Risk Management: Set a stop-loss below the third bottom to limit losses if it fails.
Stay Patient: Acting before the neckline break risks a triple bust - wait for the rise.
Conclusion
The Triple Bottom pattern is a powerhouse for nabbing bullish reversals. Its three-trough foundation, paired with volume, RSI, and moving averages, can fuel big gains. Whether in crypto, stocks, or forex, this pattern sharpens your play. Hold steady, manage your risk, and let the trio form - those three lows could launch a winning climb.
Frequently Asked Questions
Quick answers based on this page's topic.
The Triple Bottom shows that sellers attempted to break a support level three separate times and failed every time. This extra touch provides more proof of an absolute 'demand floor,' making the eventual breakout structurally more significant and high-conviction.
Confirmation requires a decisive close above the neckline—the resistance level formed by the intermittent peaks between the three lows. A volume spike during the break confirms that sellers have finally surrendered their defense of the range.
In a Triple Bottom, all three troughs are at approximately the same price level, showing a flat support zone. In an Inverse Head and Shoulders, the middle trough is lower than the two sides, reflecting a more complex failure of bearish structure.