Rectangle Pattern: Trading the Range Until It Breaks
The Rectangle pattern is a versatile continuation signal in technical analysis, often forming during a trend as price consolidates. Picture it as a boxed-in pause - price bouncing between parallel horizontal support and resistance lines - before breaking out to resume the trend. When this pattern appears, it’s a steady sign that momentum is gathering steam, offering traders a chance to ride the breakout, whether bullish or bearish, depending on the prior trend’s direction.
How to Identify the Rectangle Pattern in Trading
The Rectangle is a continuation formation. It develops when price consolidates within flat, parallel boundaries before breaking out to resume the trend. The setup confirms when price breaks above resistance or below support. Here’s how to spot it:
Start with the Big Picture
This pattern appears during an existing trend. Price pauses to consolidate in a sideways range, but the eventual breakout typically continues the prevailing direction.
Trace the Rectangle Shape
The Rectangle is defined by two parallel lines. Recognizing this range confirms the structure.
- Resistance Line: A flat horizontal ceiling where rallies stall.
- Support Line: A flat horizontal floor where declines hold.
- Rectangle Formation: Price oscillates tightly between the two boundaries.
Zero in on the Key Levels
The resistance line forms the upper boundary, while the support line forms the lower boundary. A breakout beyond either level determines the continuation’s direction.
Watch the Breakout
The trigger depends on which side breaks.
- Bullish Breakout: Price closes above resistance, confirming continuation of the uptrend.
- Bearish Breakout: Price closes below support, confirming continuation of the downtrend.
Both provide clear entry points aligned with the breakout direction.
Check Volume for Additional Confirmation
Volume behavior strengthens the breakout.
- Declines during consolidation as the range develops.
- Spikes on the breakout, confirming momentum and conviction.
Set the Move: Measure the height of the rectangle (from support to resistance) and project it from the breakout point - upward for bullish, downward for bearish - for a realistic price target.
How to Trade the Rectangle Pattern (Trading Example)
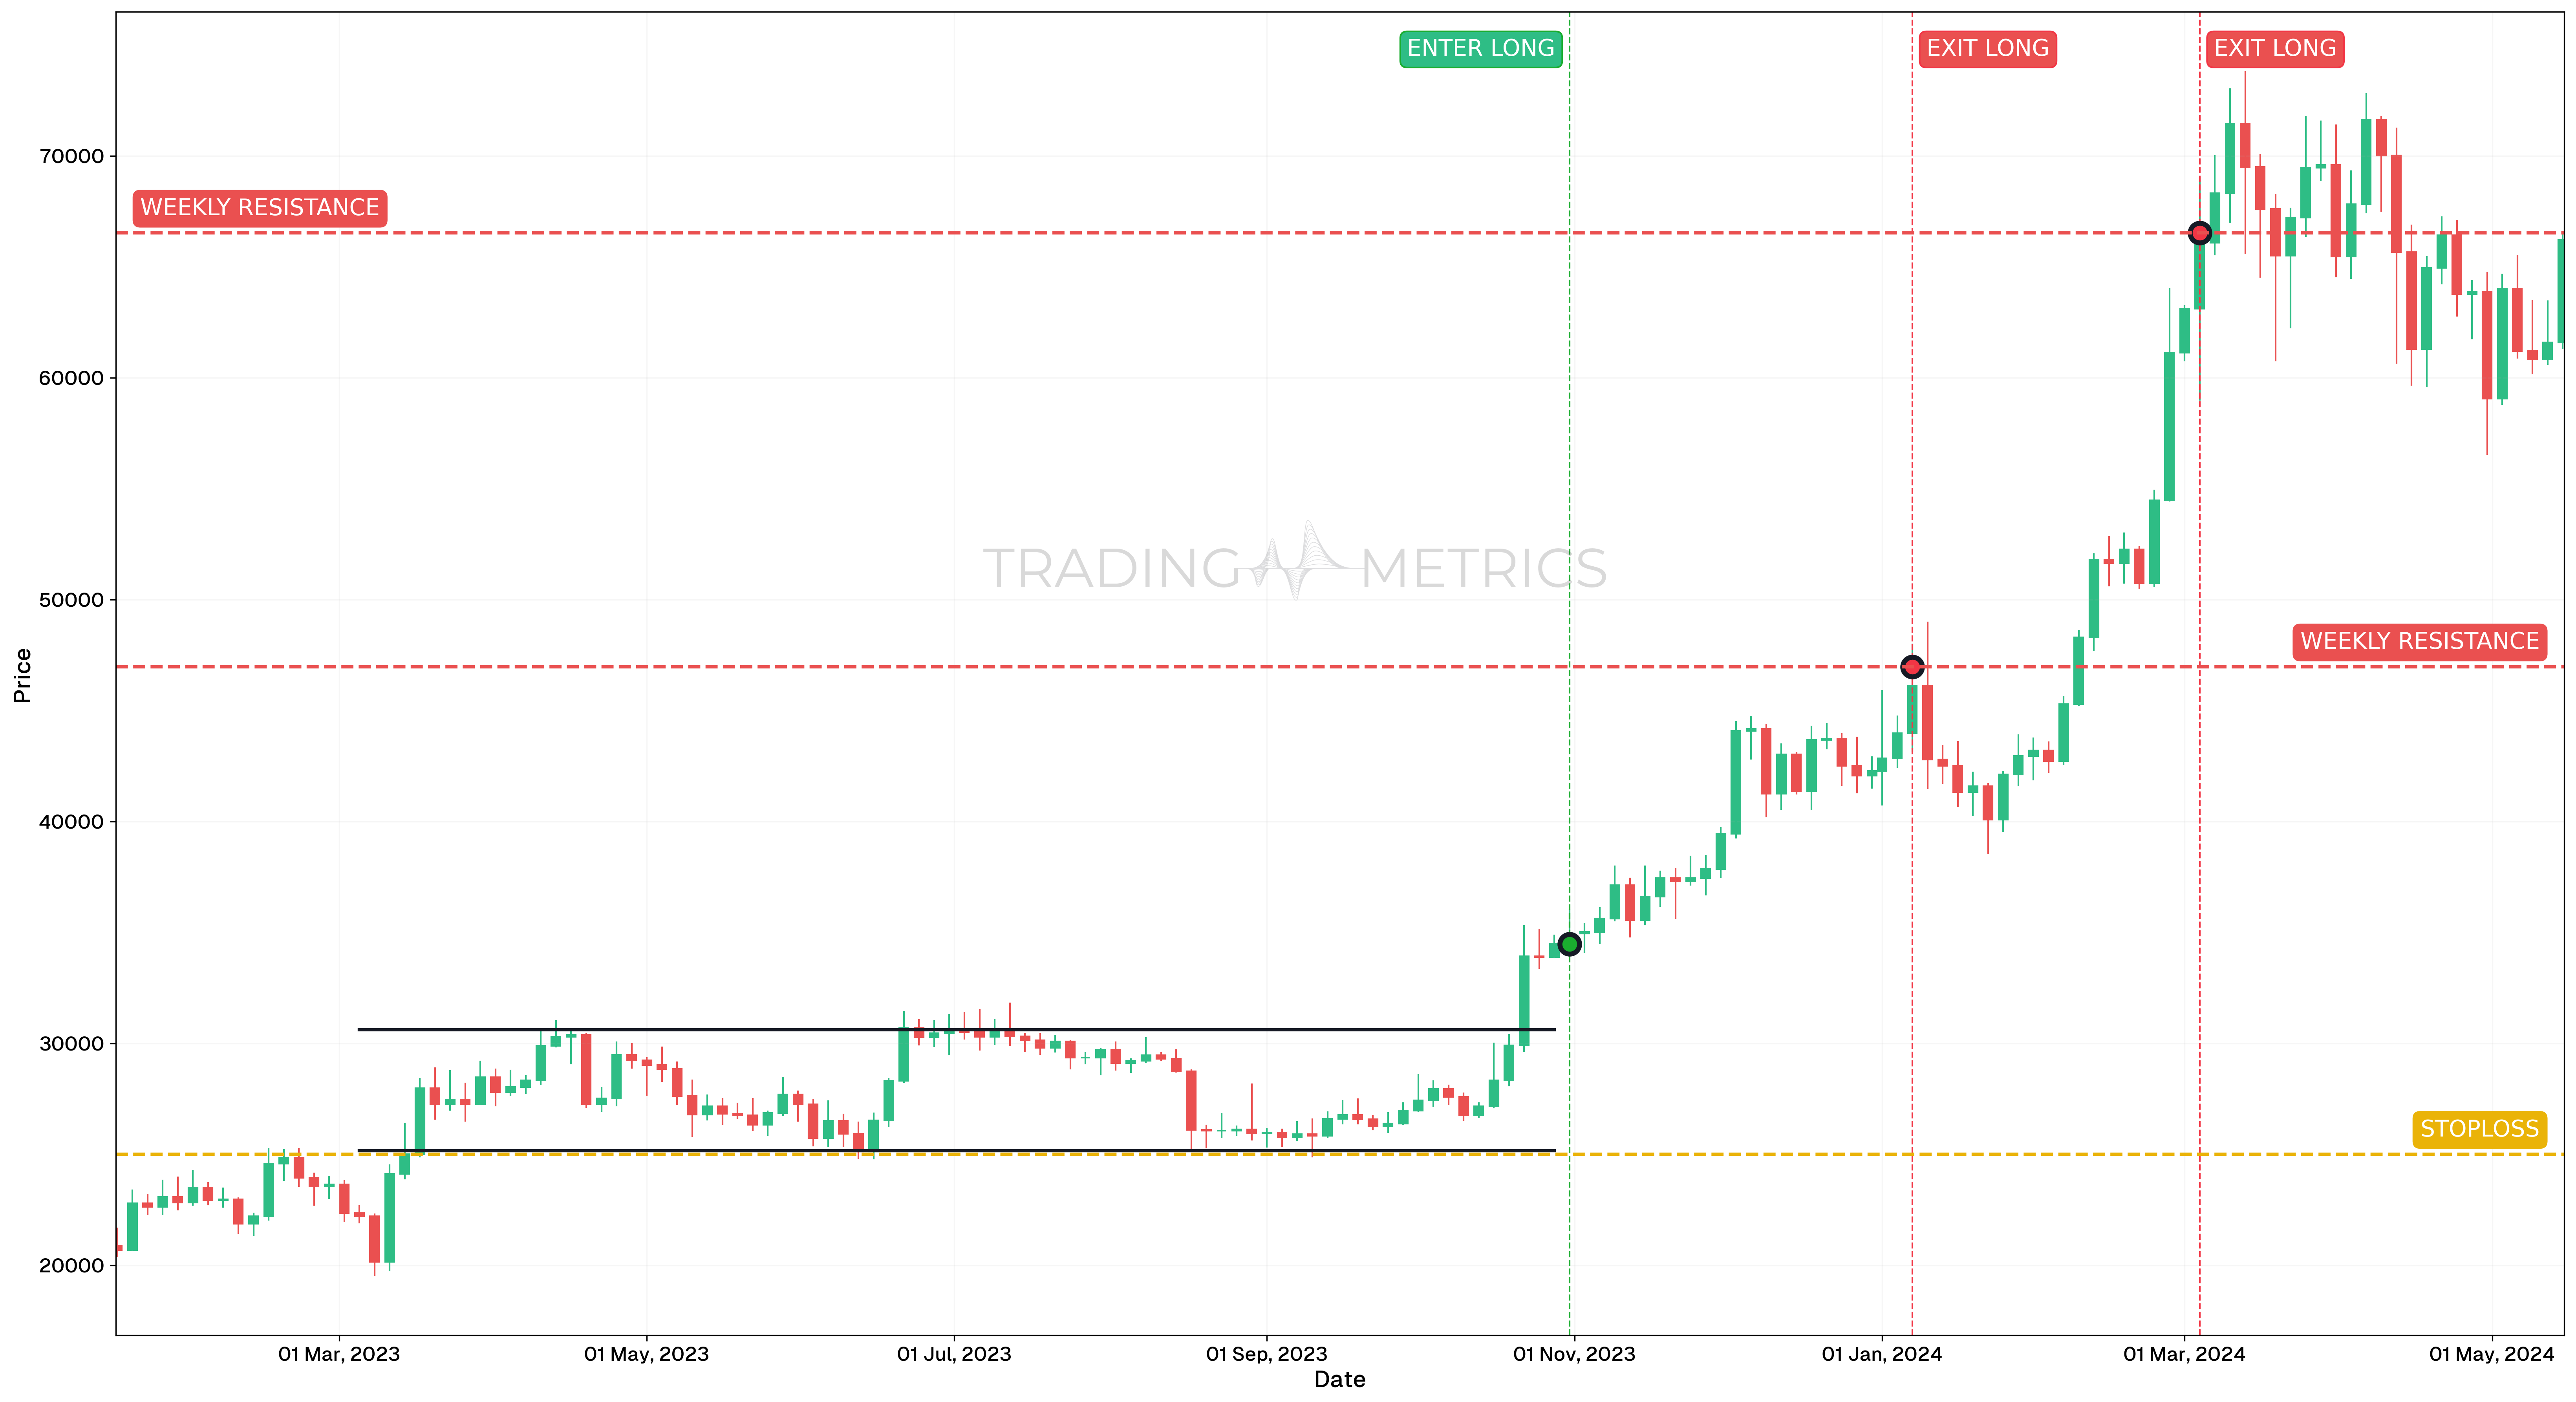
This trade showcases a Rectangle continuation pattern formed on the BTCUSDT pair using the 3-day chart. After months of consolidation between horizontal support and resistance, the breakout provided a clean trend-following opportunity.
Analysis
Between January 16, 2023, and May 15, 2024, BTCUSDT ranged between support and resistance, forming a well-defined Rectangle pattern. Volume contracted inside the range, while both RSI and StochRSI indicated hidden strength building.
Trade Setup
-
Entry: The position was entered on October 31, 2023, at $25,000.60, after the price broke above the upper boundary of the Rectangle.
-
Exit: The trade was exited in multiple stages, both near key weekly resistance zones:
- January 7, 2024 (TP1) – exit at $46,968.60
- March 4, 2024 (TP2) – exit at $66,519.10
-
Outcome: The pattern completed successfully with a powerful breakout and consistent follow-through. The layered take-profit strategy helped secure gains at major resistance zones.
Risk Management
- Stop-Loss placement: Placed just below the Rectangle support at $23,000 to invalidate the setup if broken.
- Position sizing: Based on a 2% capital risk model, factoring in the difference between entry and stop-loss.
- Volatility Consideration: During the consolidation, Volatility was extremely compressed, and its expansion post-breakout supported the momentum move.
- Breakout Confirmation: Volume increased sharply on the breakout candle, confirming real buyer interest.
Volume Surge: A volume spike on the breakout - up or down - drives the rectangle into a trend continuation.
Pre-Trade Checklist
Box the Proof: Pair the pattern with volume spikes and indicators like RSI to dodge fakes and boost your odds.
Key Points
- Line Parallelism: Flat, parallel support and resistance boost reliability - slanted lines dilute it.
- Time Frame: Works best on daily or weekly charts in defined trends.
- Combine with Indicators: Use moving averages or RSI to confirm direction.
- Breakout Confirmation: The breakout direction - above resistance or below support - sets the trend; wait for it.
- Price Target: Measure the rectangle height, project from the break (up for bullish, down for bearish) for your goal.
- Risk Management: For bullish, set a stop-loss below support; for bearish, above resistance to limit losses if it fails.
Wait for the Break: Acting before the breakout risks a boxed-in trap - let the direction confirm.
Conclusion
The Rectangle pattern is a trader’s flexible tool for riding trend continuations, whether bullish or bearish. Its boxed range, paired with volume, RSI, and moving averages, can spark big moves. Whether in crypto, stocks, or forex, this pattern hones your play. Stay patient, manage your risk, and let the rectangle form - that tight range could break into a winning trade.
Frequently Asked Questions
Quick answers based on this page's topic.
A rectangle indicates a 'Trading Range' or a temporary stalemate between buyers and sellers. The market is in a 'wait-and-see' mode, often ahead of a major economic announcement. It signals that both sides are equally strong, and the trend will only resume once one side is exhausted.
Traders wait for a decisive close above the resistance (bullish) or below the support (bearish). Because rectangles can be large, many traders 'trade the range' by buying at support and selling at resistance until the final breakout is confirmed by volume and a structural close.
The target is found by measuring the height of the rectangle (the distance between support and resistance) and projecting that same distance in the direction of the breakout. This provides a mathematical expectation of the trend's next leg.