Trading the Bearish AB=CD: Symmetrical Reversals at Resistance
The Bearish AB=CD Pattern is a streamlined bearish reversal signal in technical analysis, often appearing at the peak of an uptrend. Picture it as a symmetrical echo – price tracing an AB leg mirrored by a CD leg with near-equal length and time – flipping from bullish advance to bearish decline. When this pattern forms, it’s a calculated sign that bullish momentum is fading and bearish pressure is building, giving traders an opportunity to sell or go short as a downtrend begins to extend downward.
How to Identify the Bearish AB=CD Pattern in Trading
The Bearish AB=CD Pattern is a classic harmonic setup signaling exhaustion at the top of an uptrend. Think of it as the market making two strong upward pushes (AB and CD) with the second push stalling into Fibonacci symmetry. That symmetry signals that buyers are losing steam and sellers are ready to step in. Here’s how to spot it:
Start with the Big Picture
This pattern emerges after a strong uptrend. Price has been climbing steadily, but momentum is fading. The Bearish AB=CD structure highlights where exhaustion is likely to occur, setting up the reversal.
Trace the ABCD Legs
The pattern is built from four key swings, each balanced in length and rhythm. Recognizing these swings locks in the structure:
- AB: A strong rally upward, clean and decisive.
- BC: A retracement downward, typically 38.2%–88.6% of AB.
- CD: A second upward push, usually equal in length to AB, and often extending into the 113%–261.8% projection of BC.
- D Point: The completion of the pattern — where symmetry ends and the reversal zone begins.
Zero in on D (the Reversal Zone)
The D point is the critical completion zone. It forms where AB = CD in length and aligns with Fibonacci projections of BC. If price stalls here, it confirms bullish exhaustion and signals that sellers are preparing to take control.
Watch the Breakdown
Confirmation comes when price fails at D and reverses lower. Look for:
- A strong bearish reversal candle, or
- A close below C
Either signal confirms that buyers are trapped and the bearish reversal is underway — that’s your entry trigger.
Check Volume for Additional Confirmation
Volume flow strengthens conviction in the setup:
-
Strong volume on AB (buyers in control).
-
Weak volume on BC (retracement).
-
Another surge upward on CD (buyers overextending).
-
A volume spike at D, as sellers step back in with force. That decisive volume surge at D validates the Bearish AB=CD reversal.
Fall Echo: Measure the AB leg height and project downward from point D, or use the 38.2% or 61.8% retracement of AD as a realistic price target.
How to Trade the Bearish AB=CD Pattern (Trading Example)
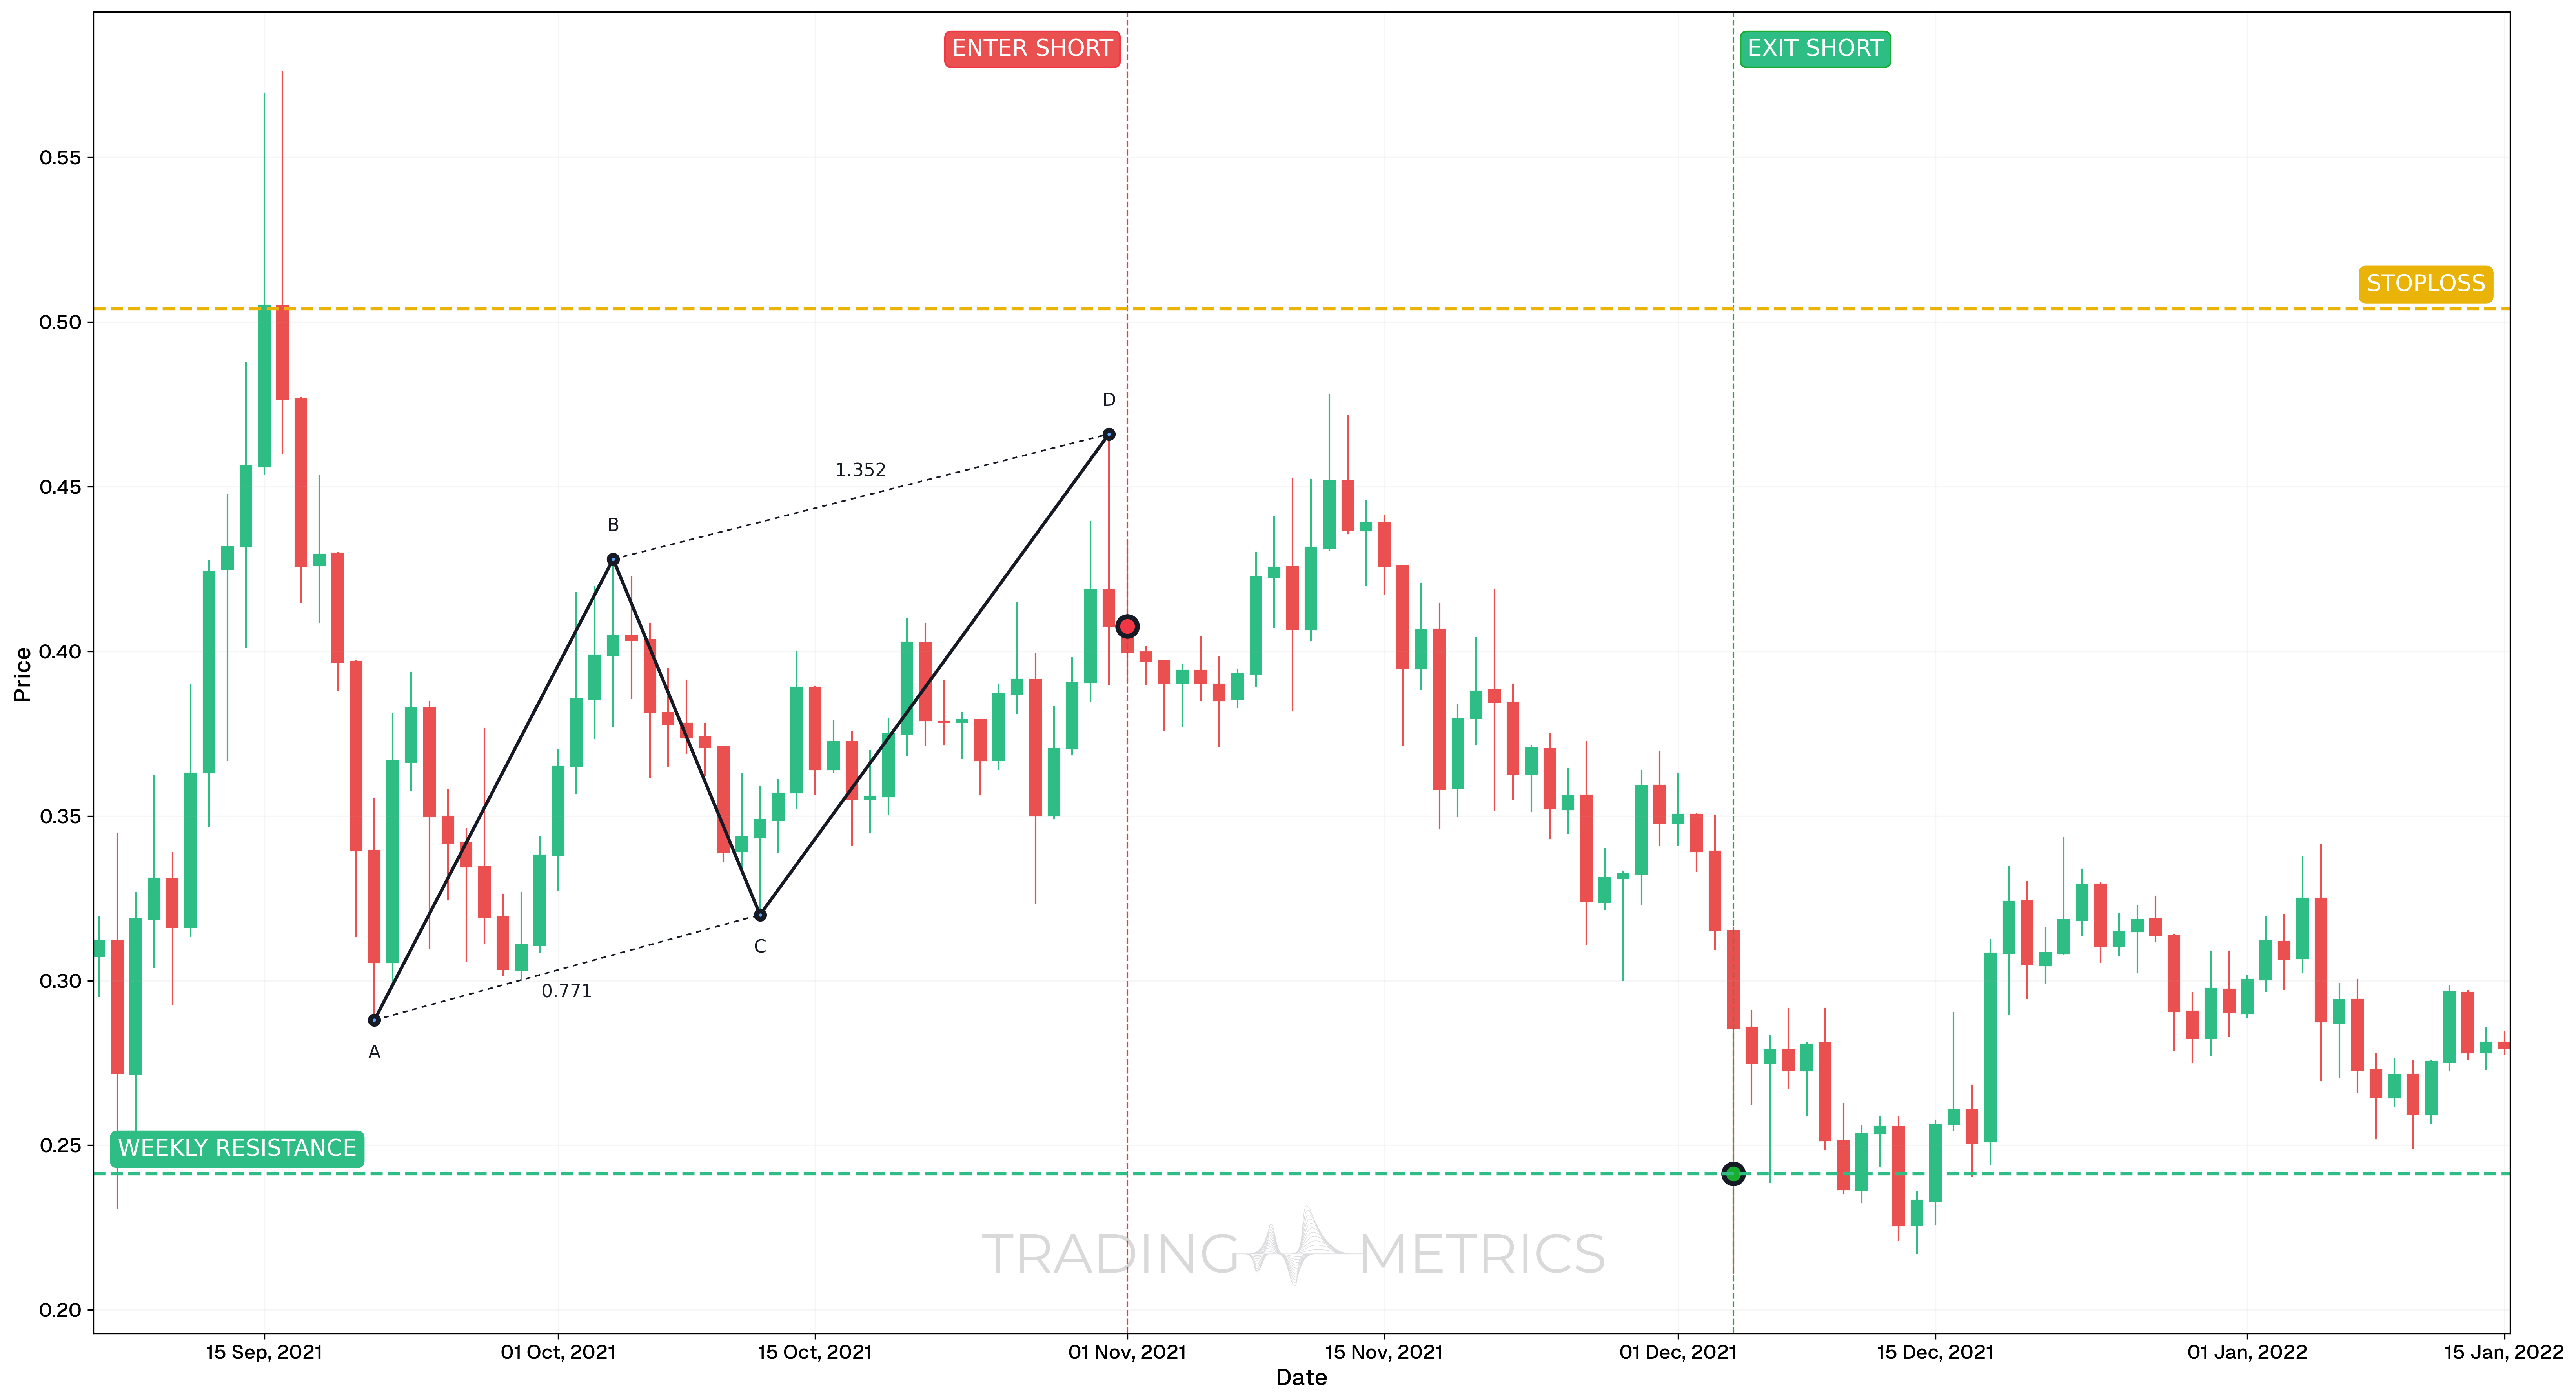
This trade demonstrates the application of the AB = CD Pattern (Bearish) on the HBARUSDT pair, using the daily chart. The harmonic projection aligned with technical resistance and offered a structured short setup.
Analysis
Between September 6, 2021, and January 15, 2022, HBARUSDT completed a symmetric AB = CD pattern, topping out in a region near weekly resistance. The CD leg equaled AB in length and time, forming a textbook harmonic structure.
Trade Setup
-
Entry: The short position was entered on November 1, 2021, at $0.4076, immediately after price reached the projected CD completion zone and showed signs of stalling.
-
Exit: Exited on December 4, 2021, at $0.24139, near a prior horizontal structure and confluence of support.
-
Outcome: The pattern completion signaled a bearish reversal that was captured early in the downtrend, resulting in a strong follow-through toward the next significant support.
Risk Management
- Stop-Loss placement: Placed just above point D at $0.50403, which invalidates the harmonic structure if broken.
- Risk-Reward Ratio: 1:1.72, offering a solid balance between risk and potential gain.
- Position sizing: Calculated based on a 2% capital risk model, using the difference between entry and stop-loss.
- Volatility Consideration: Volatility had expanded slightly into the D-point but began to compress as price reversed, creating a favorable setup.
- Confirmation Note: While the pattern projection alone signaled opportunity, weekly resistance and signs of momentum slowing added conviction for entry.
Volume Echo: A volume spike at D with confirmation lifts the pattern into a bearish surge.
Pre-Trade Checklist
Echo the Proof: Pair the pattern with volume spikes and indicators like RSI to dodge fakes and boost your odds.
Key Points
- Symmetry Precision: Equal AB and CD legs in length and time boost reliability – uneven legs weaken the signal.
- Time Frame: Echoes show strongest on daily or weekly charts after uptrends.
- Combine with Indicators: Use moving averages or RSI to confirm the reversal.
- Breakdown Confirmation: A confirmed close below C signals the turn – avoid acting at D alone.
- Price Target: Measure the AB leg or apply Fibonacci Retracements of AD to define downside targets after confirmation.
- Risk Management: Place a stop-loss just beyond D to protect against invalidation.
Wait for the Echo: Acting before confirmation risks an Bearish AB=CD trap - let the reversal resonate.
Conclusion
The Bearish AB=CD Pattern is a trader’s streamlined tool for catching bearish reversals. Its symmetrical echo, supported by volume, RSI, and moving averages, strengthens conviction for downside setups. Whether in crypto, stocks, or forex, this pattern helps sharpen your edge. Stay precise, manage your risk, and let the Bearish AB=CD align – that balanced shift could turn into a winning trade.
Frequently Asked Questions
Quick answers based on this page's topic.
The primary method is 'Leg Symmetry.' Measure the vertical price distance of the AB leg and project that same distance upward from point C. To increase accuracy, point D should also align with a 127.2% or 161.8% Fibonacci extension of the corrective BC leg.
The BC leg is the 'rest' phase that defines the pattern's symmetry. For a high-probability setup, the BC leg should ideally retrace 61.8% or 78.6% of the AB leg. If the retracement is too shallow or too deep, the subsequent CD leg may lose its geometric reliability.
Confirmation is essential because point D is a 'Potential Reversal Zone' (PRZ). Traders wait for a bearish price action signal—like a Shooting Star or Bearish Engulfing candle—at the D coordinate to prove that sellers have officially entered the market.