Double Bottom Pattern: When a Selloff Fails Twice at the Same Low
The Double Bottom pattern is a reliable bullish reversal signal in technical analysis, often popping up after a downtrend. Imagine it as the market testing a floor twice - forming two distinct troughs at roughly the same level - before bouncing upward. When this pattern takes shape, it’s a clear sign that bearish momentum is waning, offering traders a chance to buy or go long as an uptrend emerges.
How to Identify the Double Bottom Pattern in Trading
The Double Bottom is a bullish reversal formation. It forms when price tests the same support level twice, creating a “W”-shaped structure. The setup confirms when price breaks above the neckline. Here’s how to spot it:
Start with the Big Picture
This pattern develops after a downtrend. Sellers drive price lower twice, but fail to push past the same support, signaling exhaustion and a potential shift toward buyers.
Trace the Two Troughs
The Double Bottom unfolds in three stages. Identifying each step confirms the setup.
- First Bottom: Price drops to a low, then rebounds, creating the first trough.
- Peak: A rally forms resistance between the two bottoms.
- Second Bottom: Price retests the same support, holding firm before rising again.
Zero in on the Neckline
The neckline is the resistance level drawn across the peak between the two troughs. It is usually horizontal, though slight slopes can occur.
Watch the Breakout
The bullish trigger comes when price closes above the neckline.
- A decisive break over resistance or
- A strong bullish candle
Both confirm the reversal and set up the entry.
Check Volume for Additional Confirmation
Volume action helps validate the breakout.
- High on the first bottom as sellers drive aggressively.
- Lighter at the peak as momentum pauses.
- Spikes on the breakout, confirming buyers are in control.
When that surge appears, the Double Bottom’s reversal is validated.
Aim High: Measure the height from the bottoms to the neckline and project it upward from the break for a realistic price target.
How to Trade the Double Bottom Pattern (Trading Example)
To illustrate how the Double Bottom pattern can be used to enter a trade, we will choose the BTCUSDT pair. This is a high-volume trading pair on the 4-hour chart, often used by short- to mid-term swing traders applying pattern-based strategies.
Analysis
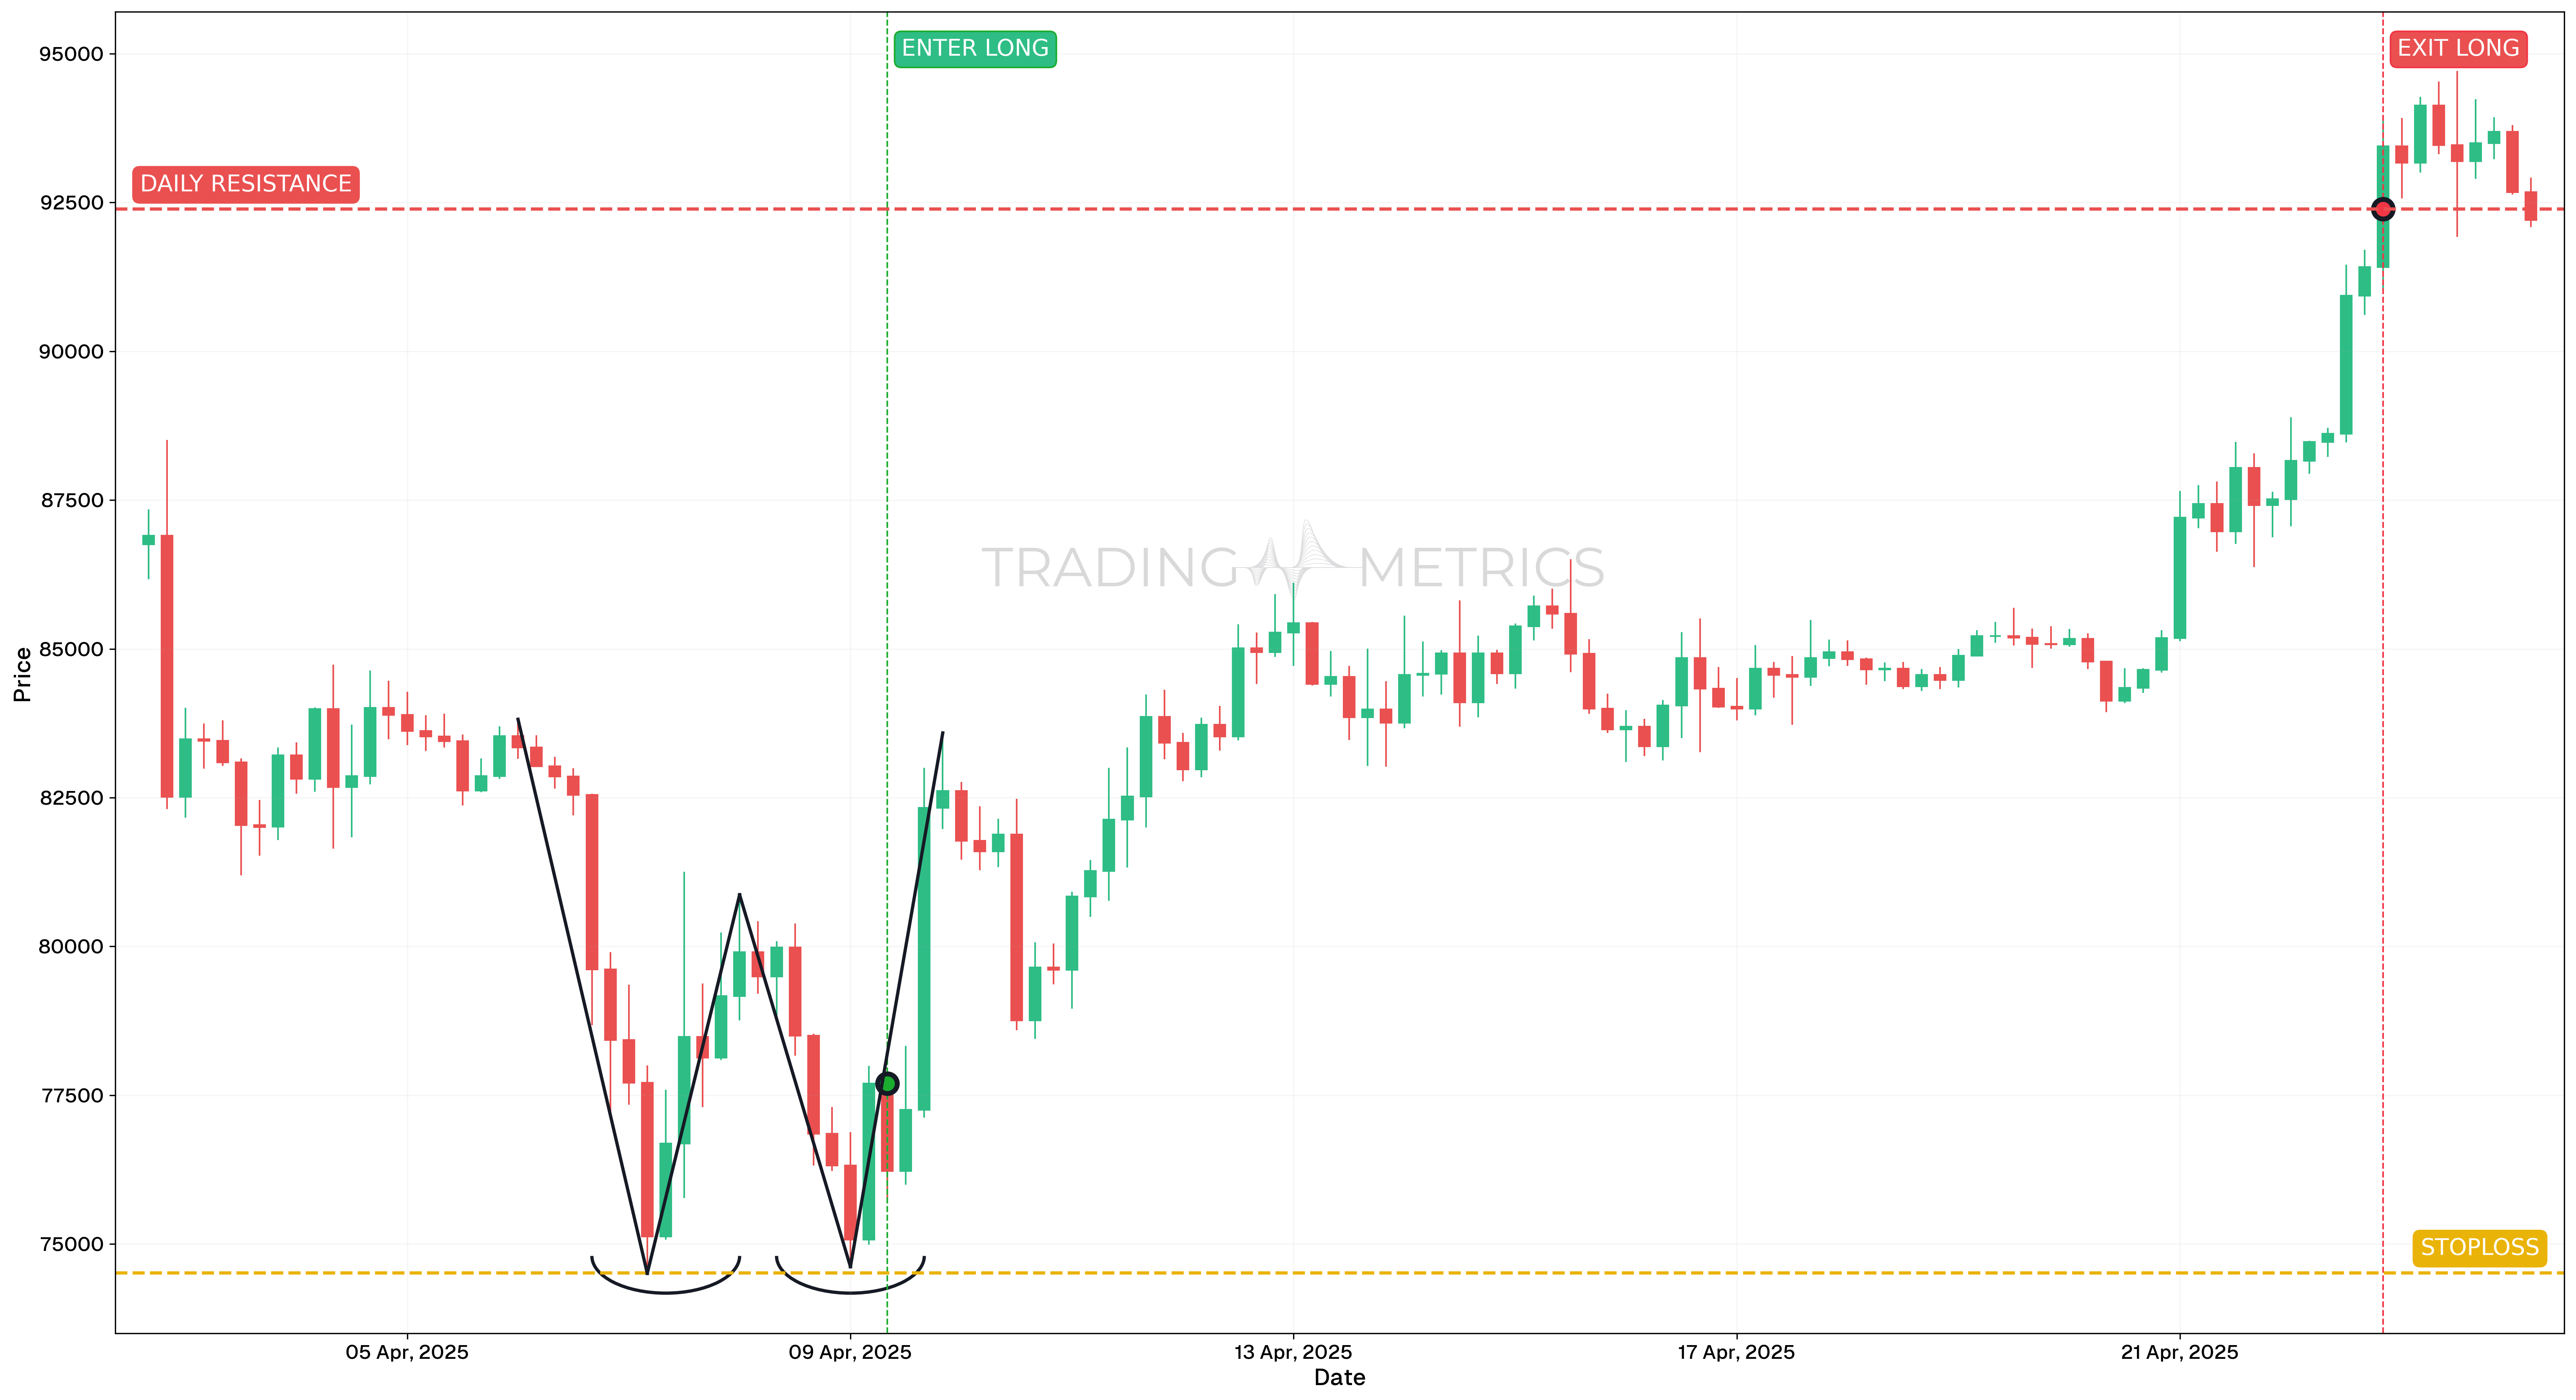
Between early and mid-April 2025, BTCUSDT formed a clean Double Bottom pattern. After a sharp decline, the pair found support around the same zone twice, with a small rally in between. The second bottom was higher in momentum and confirmed support. As price pushed back up, a Bullish Engulfing candle formed just before entry, reinforcing the case for a breakout reversal.
Trade Setup
- Entry: The long position was entered on April 9, 2025, at 08:00, at $77,694.12, shortly after a confirmed Bullish Engulfing candle. StochRSI had crossed bullish a few candles earlier, and RSI was at 43 and climbing toward 50, showing improving momentum. The setup confirmed pattern completion with breakout potential.
- Exit: The trade was closed on April 22, 2025, at 20:00, at $92,390.02, which aligned with a prior support-turned-resistance zone. This was a technically valid and conservative target, allowing profit capture before extended resistance retests.
- Outcome: The Double Bottom resulted in an impressive 18.8% gain, offering a clean and efficient reversal trade within a broader consolidation phase.
Risk Management
- Stop-Loss placement: The stop-loss was placed at $74,515.87, below the second bottom and invalidation zone. This level was chosen to ensure that the trade would only be stopped if the support structure failed.
- Position sizing: A 2% capital risk model was used, with position size calculated based on the distance between the entry and stop-loss to maintain proper risk discipline.
- Risk-Reward Ratio: The setup achieved a Risk-Reward Ratio of 1:4.62 - an exceptional return profile driven by a high-confidence pattern structure and strong momentum entry.
- Volatility Consideration: While BTC was experiencing elevated Volatility, the structure of the pattern and bullish engulfing signal helped validate the entry and manage downside risk.
- Adaptive Exit Strategy: For traders seeking more upside, a trailing stop could have been applied after resistance break. However, exiting at a historically significant level preserved gains while avoiding the uncertainty of extended breakouts.
Volume Lift: A volume surge on the neckline break boosts the pattern into a bullish climb.
Pre-Trade Checklist
Double Down: Pair the pattern with volume spikes and indicators like RSI to sidestep fakes and stack your odds.
Key Points
- Bottom Similarity: The closer the bottoms align, the stronger the signal - big gaps weaken it.
- Time Frame: Best on daily or weekly charts for solid trends.
- Combine with Indicators: Use moving averages or RSI to sharpen your entry.
- Breakout Confirmation: The neckline break flips the switch - don’t jump early.
- Price Target: Measure from bottoms to neckline, project up from the break for your aim.
- Risk Management: Set a stop-loss below the second bottom to cap losses if it flops.
Hold Steady: Moving before the neckline break risks a double flop - wait for the bounce.
Conclusion
The Double Bottom pattern is a trader’s go-to for snagging bullish reversals. Its twin-trough setup, teamed with volume, RSI, and moving averages, can spark big payoffs. Whether in crypto, stocks, or forex, this pattern hones your game. Be patient, manage your risk, and let the “W” form - those two dips could lift you to a winning rise.
Frequently Asked Questions
Quick answers based on this page's topic.
A Double Bottom indicates that the market has hit a 'hard floor.' Sellers reached a specific price level twice and were unable to break lower, signaling that institutional demand is perfectly neutralizing supply and the downtrend is likely exhausted.
The neckline is the resistance level formed by the peak between the two troughs. Breaking above this level is the final proof that the bearish 'ceiling' has collapsed. Traders use this break as an objective entry point for long positions.
Measure the vertical distance from the lowest point of the bottoms to the neckline peak. Project that exact distance upward from the breakout point to find your mathematical 1:1 expectation for the subsequent move.
A valid Double Bottom typically develops over several weeks to months on a daily chart. Patterns that form too quickly, such as within a few days, are often just normal price oscillation rather than a genuine structural reversal. Longer formation times generally indicate stronger institutional accumulation.
A failed breakout often leads to a sharp decline below both bottoms as trapped long positions are liquidated. Traders protect against this by placing a stop-loss just below the second bottom and waiting for a confirmed close above the neckline rather than entering on the first touch.