Bullish Engulfing Pattern: When Buyers Take Full Control
The Bullish Engulfing pattern is a bold bullish reversal signal in technical analysis, often igniting at the bottom of a downtrend. Picture it as a swift overtake - a small bearish candle consumed entirely by a larger bullish one - flipping the tide from gloom to hope. When this pattern emerges, it’s a striking sign that bearish momentum is crumbling, offering traders a chance to buy or go long as an uptrend takes root.
How to Identify the Bullish Engulfing Pattern in Trading
The Bullish Engulfing is a bullish reversal candlestick formation. It develops over two candles at the bottom of a downtrend, where a strong bullish move fully consumes the prior bearish candle. It’s a decisive swing back to buyers. Here’s how to spot it:
Start with the Big Picture
This pattern forms after a downtrend. Sellers appear in control, but the engulfing structure signals their grip is weakening.
Trace the Two-Candle Sequence
The structure unfolds in two steps:
- First Candle: A small bearish candle, reflecting lingering downward momentum, typically compact in size.
- Second Candle: A large bullish candle, fully engulfing the first candle’s body (open to close). It opens below the first candle’s close and closes above its open, flipping momentum.
Zero in on the Confirmation Level
The confirmation level is the close of the second candle. A strong finish above this point signals the reversal’s start.
Watch the Breakout
The bullish trigger comes when the second candle closes above the first candle’s open, confirming the shift in control. This is your entry point.
Check Volume for Additional Confirmation
Volume behavior adds conviction:
- Rises slightly on the first candle, showing weak selling.
- Spikes on the second candle, as buyers step in aggressively.
- A volume surge with the bullish candle strengthens the reversal’s reliability.
Rise Estimate: Measure the height of the second candle or use nearby resistance levels to project a realistic price target upward from the close.
How to Trade the Bullish Engulfing Pattern (Trading Example)
To illustrate how the Bullish Engulfing pattern can be used to enter a trade, we will choose the CAKEUSD pair. This strong bullish candlestick pattern appeared on the daily chart, marking a reversal after a period of sustained selling.
Analysis
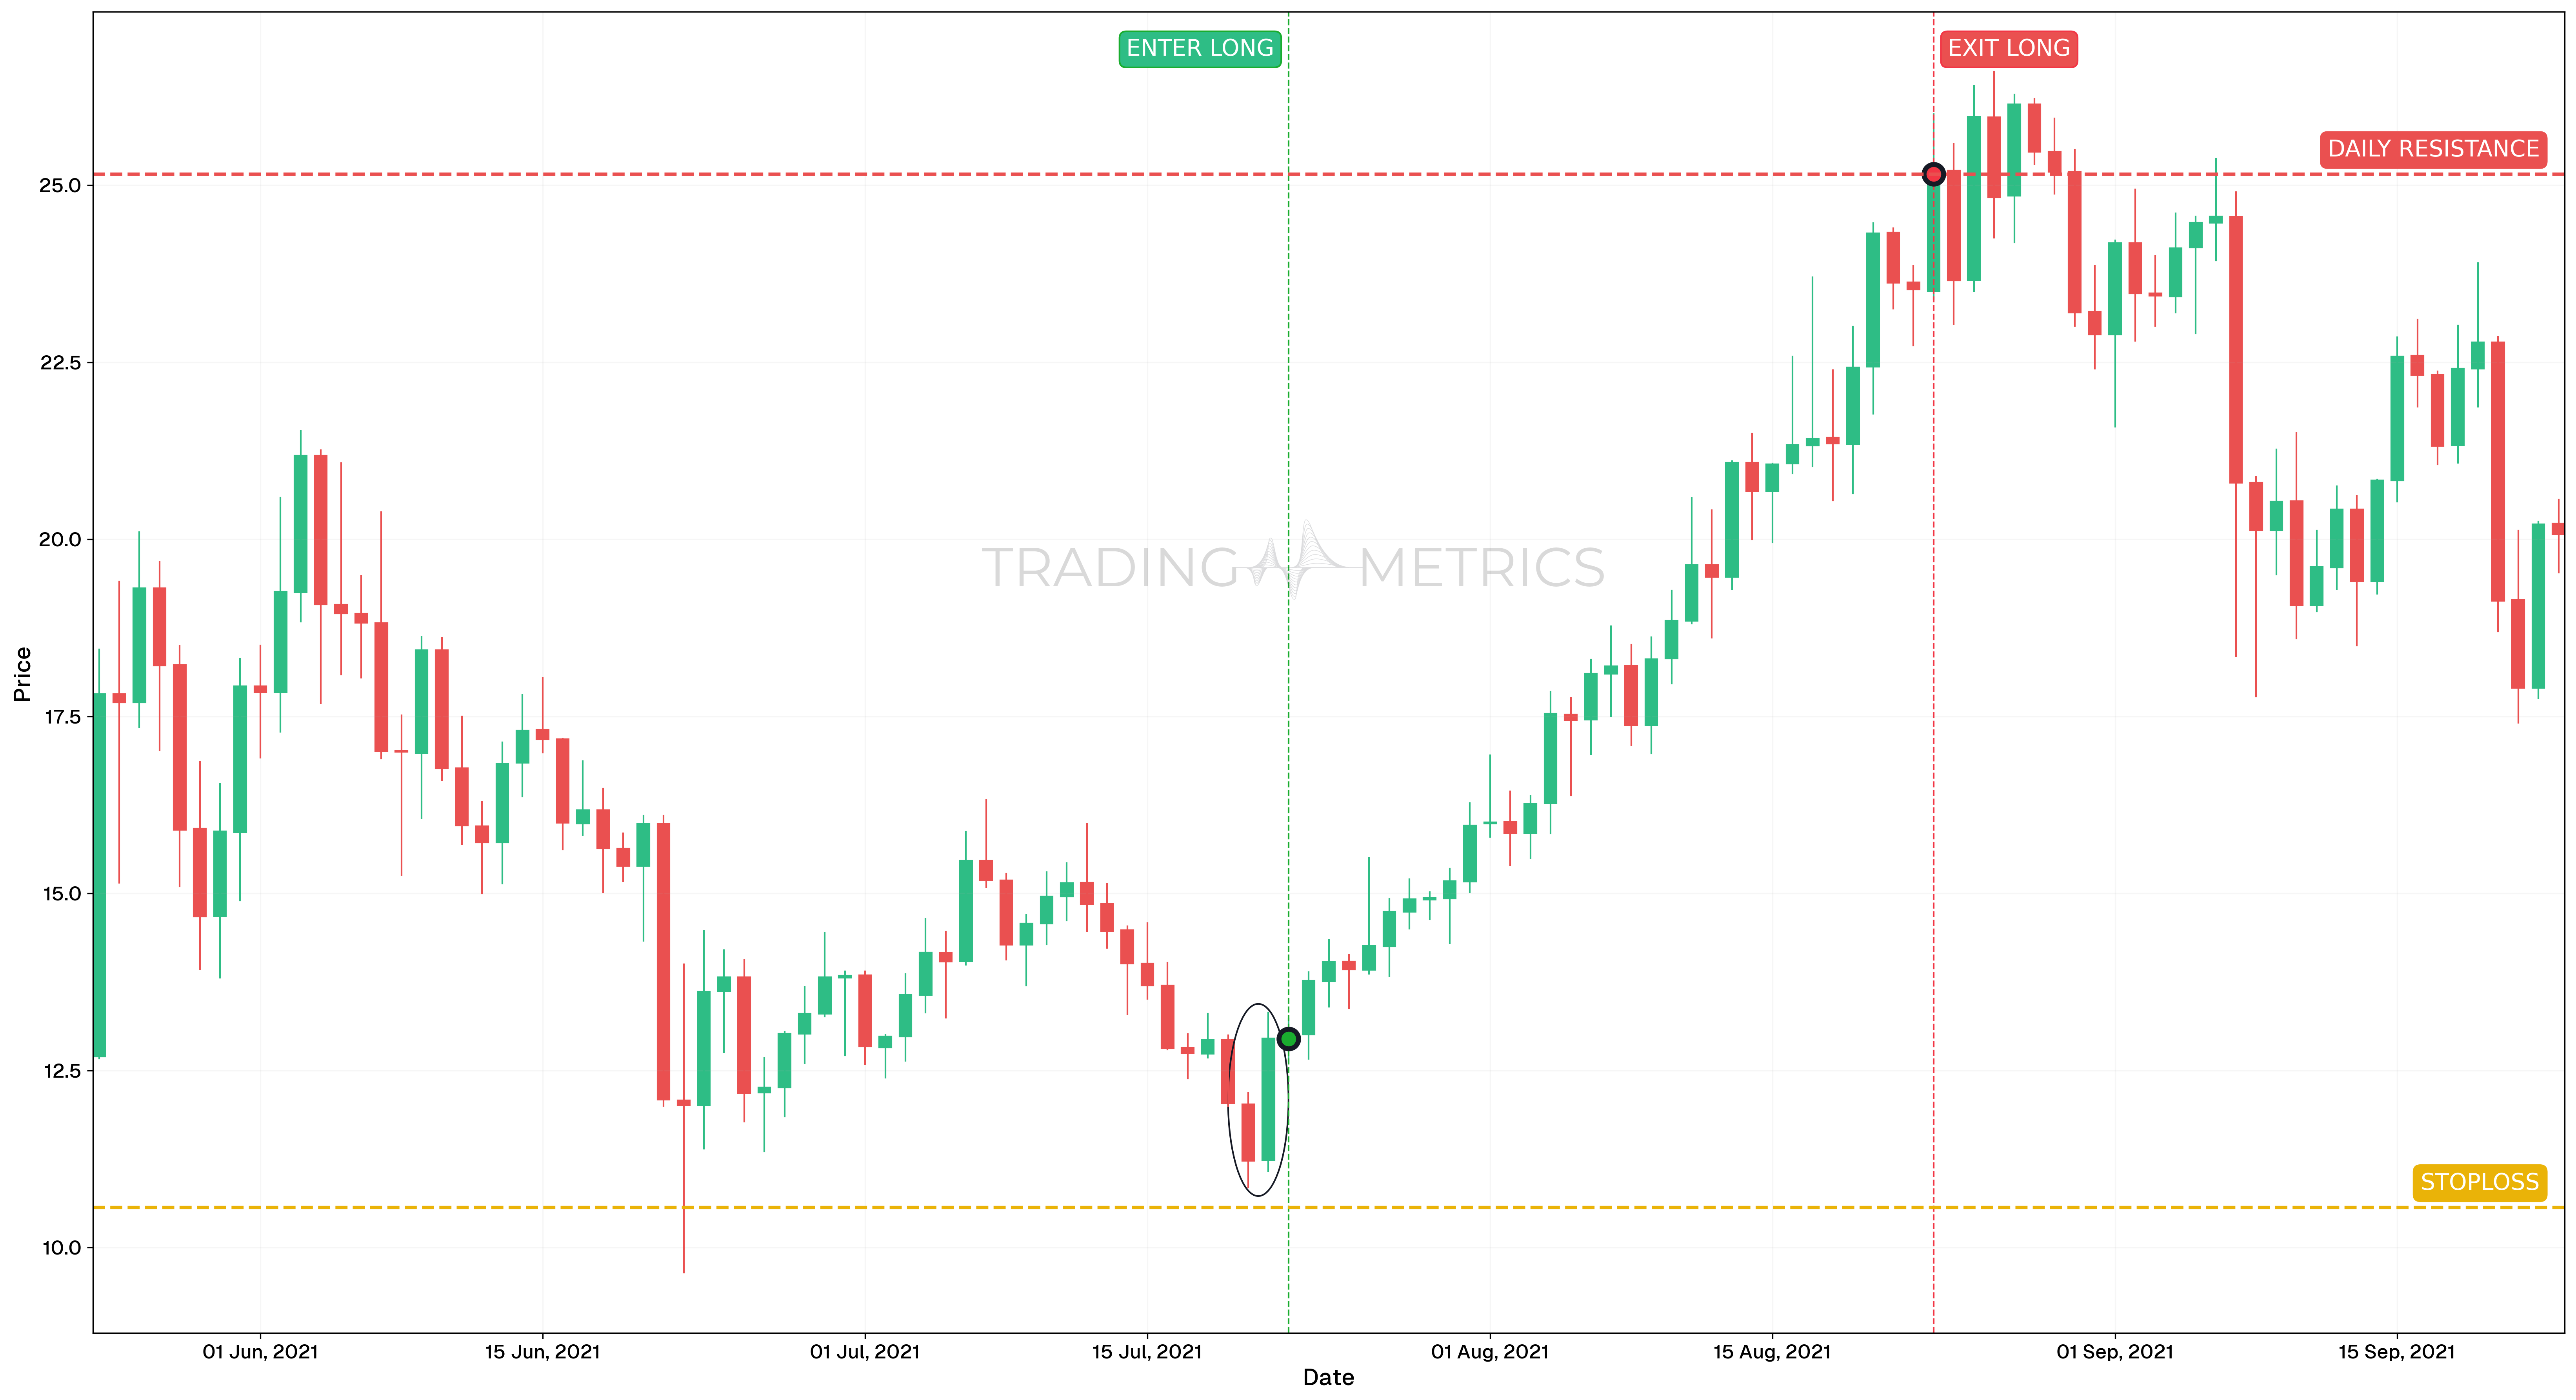
On July 22, 2021, CAKEUSD formed a clear Bullish Engulfing pattern after an extended downtrend. The large green candle completely engulfed the previous red candle, signaling a decisive shift in momentum from sellers to buyers. This reversal occurred near a local support area, increasing its technical validity.
Trade Setup
-
Entry: The trade was entered on July 22, 2021, at $12.951, immediately after the Bullish Engulfing formed. The trade was supported by:
-
Exit: The position was closed on August 23, 2021, at $25.1532, as price reached a well-tested previous support/resistance zone. This level marked the end of the short-term uptrend.
-
Outcome: The Bullish Engulfing resulted in a 94.2% gain, demonstrating how powerful this pattern can be when combined with Momentum Indicators and structure-based exits.
Risk Management
- Stop-Loss placement: The stop-loss was placed at $10.566, just below the Bullish Engulfing candle’s low and the local swing support, defining a tight and logical invalidation point.
- Position sizing: A 2% capital risk model was used to calculate position size based on the entry-to-stop range.
- Risk-Reward Ratio: The trade yielded a Risk-Reward Ratio of 1:5.12, offering a high-efficiency reversal setup with tight risk.
- Volatility Consideration: The breakout occurred during rising Volatility, helping validate the breakout’s momentum and supporting the bullish continuation.
- Adaptive Exit Strategy: Traders could have scaled out across Fibonacci levels or used dynamic EMA-based exits to lock in gains while staying exposed to potential trend extension.
Volume Flame: A volume spike on the bullish engulfing candle ignites the pattern into a bullish turn.
Pre-Trade Checklist
Ignite the Proof: Pair the pattern with volume spikes and indicators like RSI to dodge fakes and brighten your odds.
Key Points
- Candle Contrast: A small bearish candle followed by a larger bullish one boosts reliability - similar sizes dilute it.
- Time Frame: Sparks brightest on daily or weekly charts after downtrends.
- Combine with Indicators: Use moving averages or RSI to confirm the reversal.
- Breakout Confirmation: The second candle’s close above the first’s open sets the turn - don’t jump too soon.
- Price Target: Measure the bullish engulfing candle height or use resistance levels for a target above the close.
- Risk Management: Set a stop-loss below the bullish engulfing low to limit losses if it fails.
Wait for the Spark: Acting before the second candle closes risks a dim trap - let it engulf.
Conclusion
The Bullish Engulfing pattern is a trader’s fiery tool for catching bullish reversals. Its two-candle takeover, paired with volume, RSI, and moving averages, can ignite big gains. Whether in crypto, stocks, or forex, this pattern sharpens your edge. Stay alert, manage your risk, and let the bullish engulfing flare - that swift swallow could rise into a winning trade.
Frequently Asked Questions
Quick answers based on this page's topic.
It represents a 'Total Absorption' of supply. After a period of selling, buyers enter with such force that they wipe out the previous session's entire progress in one go. This negation of bearish effort proves that demand has officially exceeded supply at that specific price floor.
The target is determined using the 'Measured Move' principle. Measure the vertical height of the second (engulfing) candle and project that same distance upward from the point of entry. Alternatively, traders target the nearest major Fibonacci resistance level.
A valid reversal is confirmed when the volume on the second (bullish) candle is significantly higher than the first. High volume proves that the 'engulfing' wasn't just low-liquidity price movement, but a massive influx of capital from buyers stepping in to support the market.
A Bullish Engulfing candle closes above the previous candle's open, fully engulfing its body. A Piercing Line only closes into the lower half of the previous candle's body without fully engulfing it. Bullish Engulfing is the stronger reversal signal because the buyer takeover is more complete.
The highest-probability setups appear at key support zones such as horizontal support levels, Fibonacci retracement areas, or rising trendlines. When a Bullish Engulfing pattern forms at these structural levels, it confirms that buyers are defending a price zone that has historical significance.