Bearish Harami Cross: How to Confirm Doji-Based Reversals
The Bearish Harami Cross pattern is a bearish reversal signal in technical analysis, typically forming near the top of an uptrend. Think of it as a pause-and-shift: a large bullish candle followed by a small doji contained within its body—hinting that buying momentum is stalling. When it appears, it suggests a potential turn down, offering traders a chance to sell or go short as a downtrend may begin.
How to Identify the Bearish Harami Cross Pattern in Trading
The Bearish Harami Cross is a bearish reversal candlestick formation. It develops over two candles at the end of an uptrend, with a large bullish candle followed by a contained doji. The setup signals exhaustion of buyers and potential downside reversal. Here’s how to spot it:
Start with the Big Picture
This pattern appears after an uptrend. Buyers push price higher on the first candle, but the doji shows indecision and waning momentum.
Trace the Two-Candle Sequence
The structure unfolds in two parts. Spotting the doji inside the first candle confirms the setup.
- First Candle: A strong bullish candle continuing the advance.
- Second Candle: A doji completely contained within the first candle’s body, showing indecision and a potential shift.
Zero in on the Confirmation Level
The confirmation level is the low of the first candle. Price must close below this level to validate the reversal.
Watch the Breakout
The bearish trigger comes when a subsequent candle closes below the first candle’s low.
- A decisive close under support or
- A strong bearish candle
Both confirm the reversal and provide the entry.
Check Volume for Additional Confirmation
Volume behavior strengthens the signal.
- Elevated volume on the first bullish candle as buying climaxes.
- Light volume on the doji reflecting indecision.
- A surge in volume on the bearish breakdown, confirming sellers are stepping in.
Drop Hint: Measure the height of the first candle or use nearby support levels to project a realistic price target downward from the confirmation close.
How to Trade the Bearish Harami Cross Pattern (Trading Example)
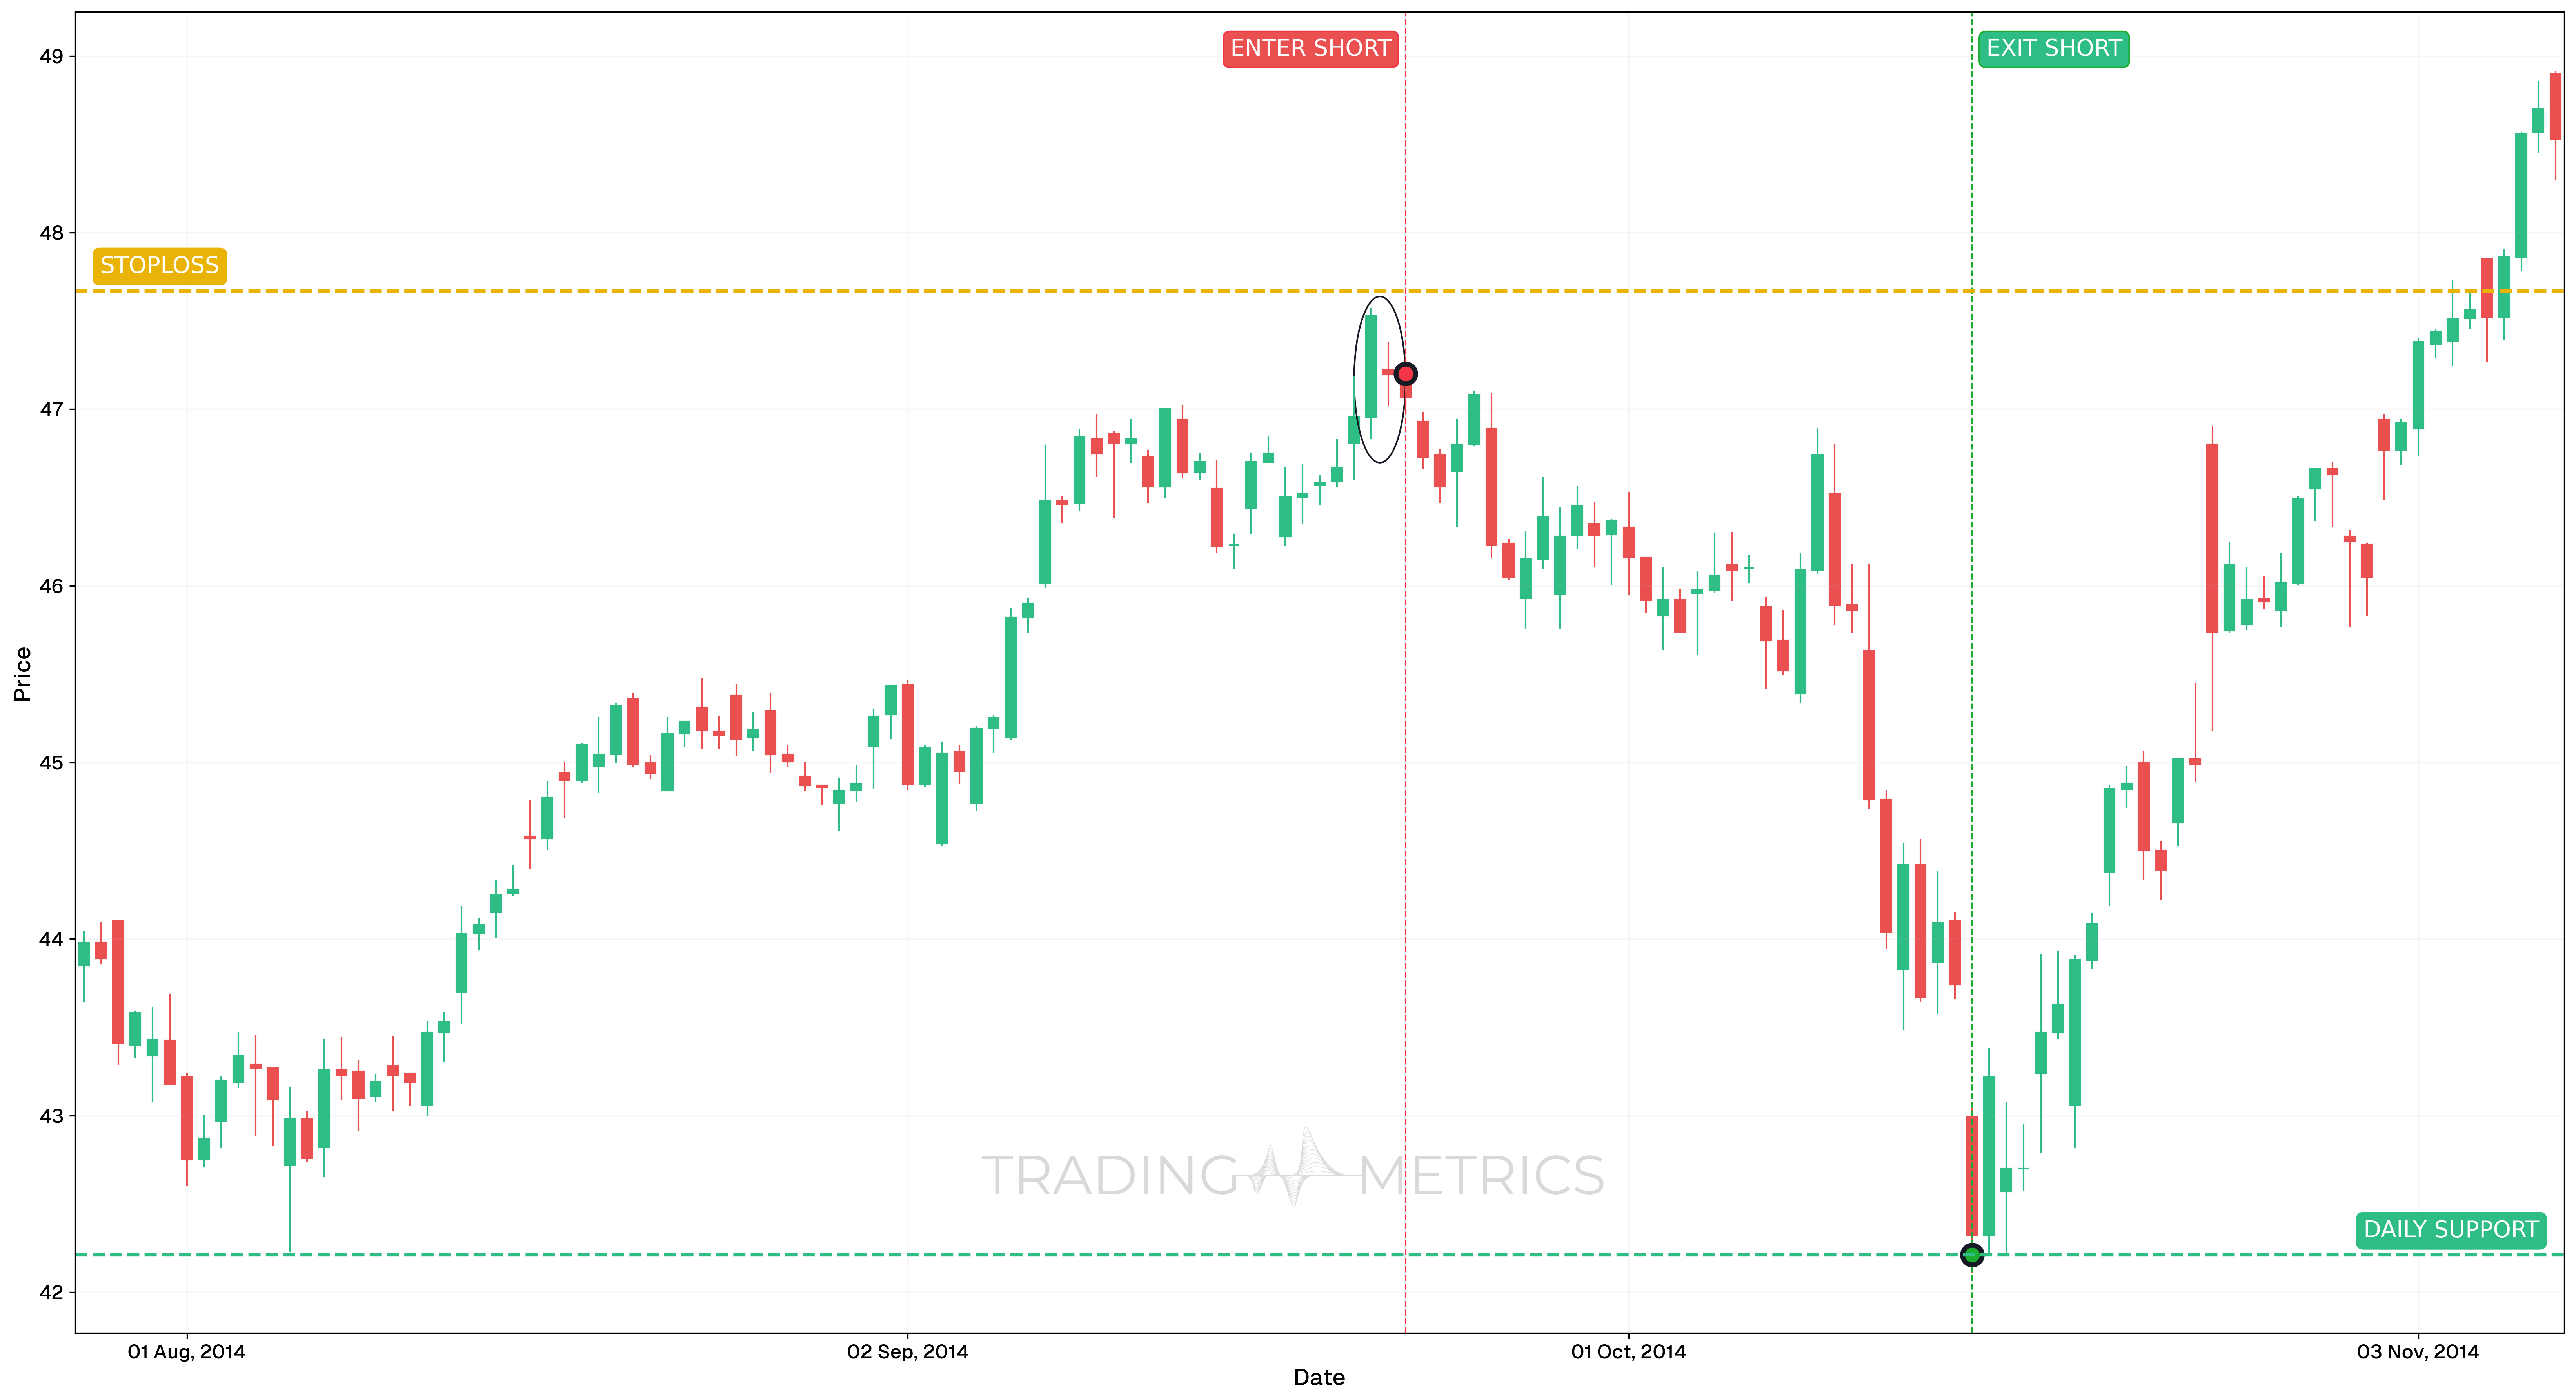
This example features the Bearish Harami Cross pattern on MSFT, using the 4-hour chart during a mid-term reversal phase. The trade formed after an extended rally and marked a significant shift in sentiment.
Analysis
On September 22, 2014, a clear Bearish Harami Cross formed. The pattern appeared near the top of a rally, where both RSI and StochRSI showed exhaustion and early signs of reversal.
Trade Setup
-
Entry: Entered short on September 22, 2014, at $47.20, immediately after the Bearish Harami Cross completed.
-
Exit: Closed the position at $42.21 on October 15, 2014, near a strong daily support zone.
-
Outcome: The pattern successfully predicted a reversal with confirmation from multiple Momentum Indicators, resulting in a high-quality short setup.
Risk Management
- Stop-Loss Placement: Stop-Loss was set at $47.67, just above the pattern’s high.
- Risk-Reward Ratio: 1:10.62 - an excellent reward profile relative to the risk taken.
- Position sizing: Position size was determined using a 2% capital risk model, aligned with the defined stop-loss.
- Volatility Consideration: Volatility was elevated during the topping formation but quickly compressed after confirmation, allowing for clear entry signals.
- Momentum Confirmation: Falling RSI and StochRSI aligned with candlestick structure, reducing the probability of a false signal.
Volume Glow: A volume spike on the confirming candle lights the pattern into a bearish turn.
Pre-Trade Checklist
Cross the Proof: Pair the pattern with volume spikes and indicators like RSI to dodge fakes and boost your odds.
Key Points
- Candle Contrast: A large bullish candle with a tiny doji boosts reliability—mismatched sizes dilute it.
- Time Frame: Shows best on daily or weekly charts after uptrends.
- Combine with Indicators: Use moving averages or RSI to confirm the reversal.
- Breakdown Confirmation: A close below the first candle’s low sets the turn—don’t act on the doji alone.
- Price Target: Measure the first candle height or use support levels for a target below the confirmation.
- Risk Management: Set a stop-loss above the first candle’s high to limit losses if it fails.
Wait for the Cross: Acting before confirmation risks a trap—let the reversal firm up.
Conclusion
The Bearish Harami Cross pattern is a trader’s tool for catching bearish reversals. Its two-candle setup—confirmed by volume, RSI, and moving averages—can flag early tops across crypto, stocks, or forex. Stay patient, manage your risk, and wait for confirmation—this quiet doji inside a strong bullish candle can precede a meaningful downturn.
Frequently Asked Questions
Quick answers based on this page's topic.
The 'Cross' version features a Doji as the second candle instead of a small real body. A Doji represents perfect indecision and equilibrium. When it appears deep inside a previously strong bullish candle, it signals a sudden and complete halt to the trend's momentum.
It represents a 'Sudden Standoff.' After buyers dominated the previous session, the market opens within that range and fails to move in either direction. This total lack of follow-through after a strong impulse often precedes a sharp 'liquidation' move to the downside.
The most technical stop-loss placement is just above the high of the first (bullish) candle. Since the pattern's validity relies on the market's failure to reach new highs, a move above that peak invalidates the bearish thesis and protects your capital.