Piercing Line Pattern: How a Weak Open Becomes a Reversal
The Piercing Line pattern is a striking bullish reversal signal in technical analysis, often emerging at the trough of a downtrend. Picture it as a bold recovery - a bearish candle followed by a bullish one that opens lower but pierces deep into the prior candle’s body - lifting spirits from despair. When this pattern takes shape, it’s a bright sign that bearish momentum is weakening, offering traders a chance to buy or go long as an uptrend begins to shine.
How to Identify the Piercing Line Pattern in Trading
The Piercing Line is a bullish reversal candlestick pattern. It shows up at the end of a downtrend when sellers drive price lower but buyers reclaim control with a sharp counter-move. Confirmation is essential for this setup. Here’s the step-by-step guide.
Start with the Big Picture
This pattern forms after a downtrend. It signals fading selling pressure and the start of a potential bullish turnaround.
Trace the Candle Sequence
The setup unfolds over two candles:
- First Candle: A strong bearish candle, extending the downtrend with solid downward momentum.
- Second Candle: A bullish candle that opens below the first candle’s low and closes above the midpoint of the first candle’s body — piercing at least 50% of its range.
Zero in on the Confirmation Level
The confirmation level is the midpoint of the first candle’s body. A close above this level by the second candle validates the reversal.
Watch the Breakout
The bullish trigger comes when the second candle closes above the first candle’s midpoint. That’s your entry point, marking the potential shift in trend.
Check Volume for Additional Confirmation
Volume behavior can strengthen the signal:
- Rises on the first candle as selling peaks.
- Spikes in volume on the second candle confirm buyer aggression; volume holding firm also strengthens the reversal signal.
Rise Gauge: Measure the height of the first candle or use nearby resistance levels to project a realistic price target upward from the second candle’s close.
How to Trade the Piercing Line Pattern (Trading Example)
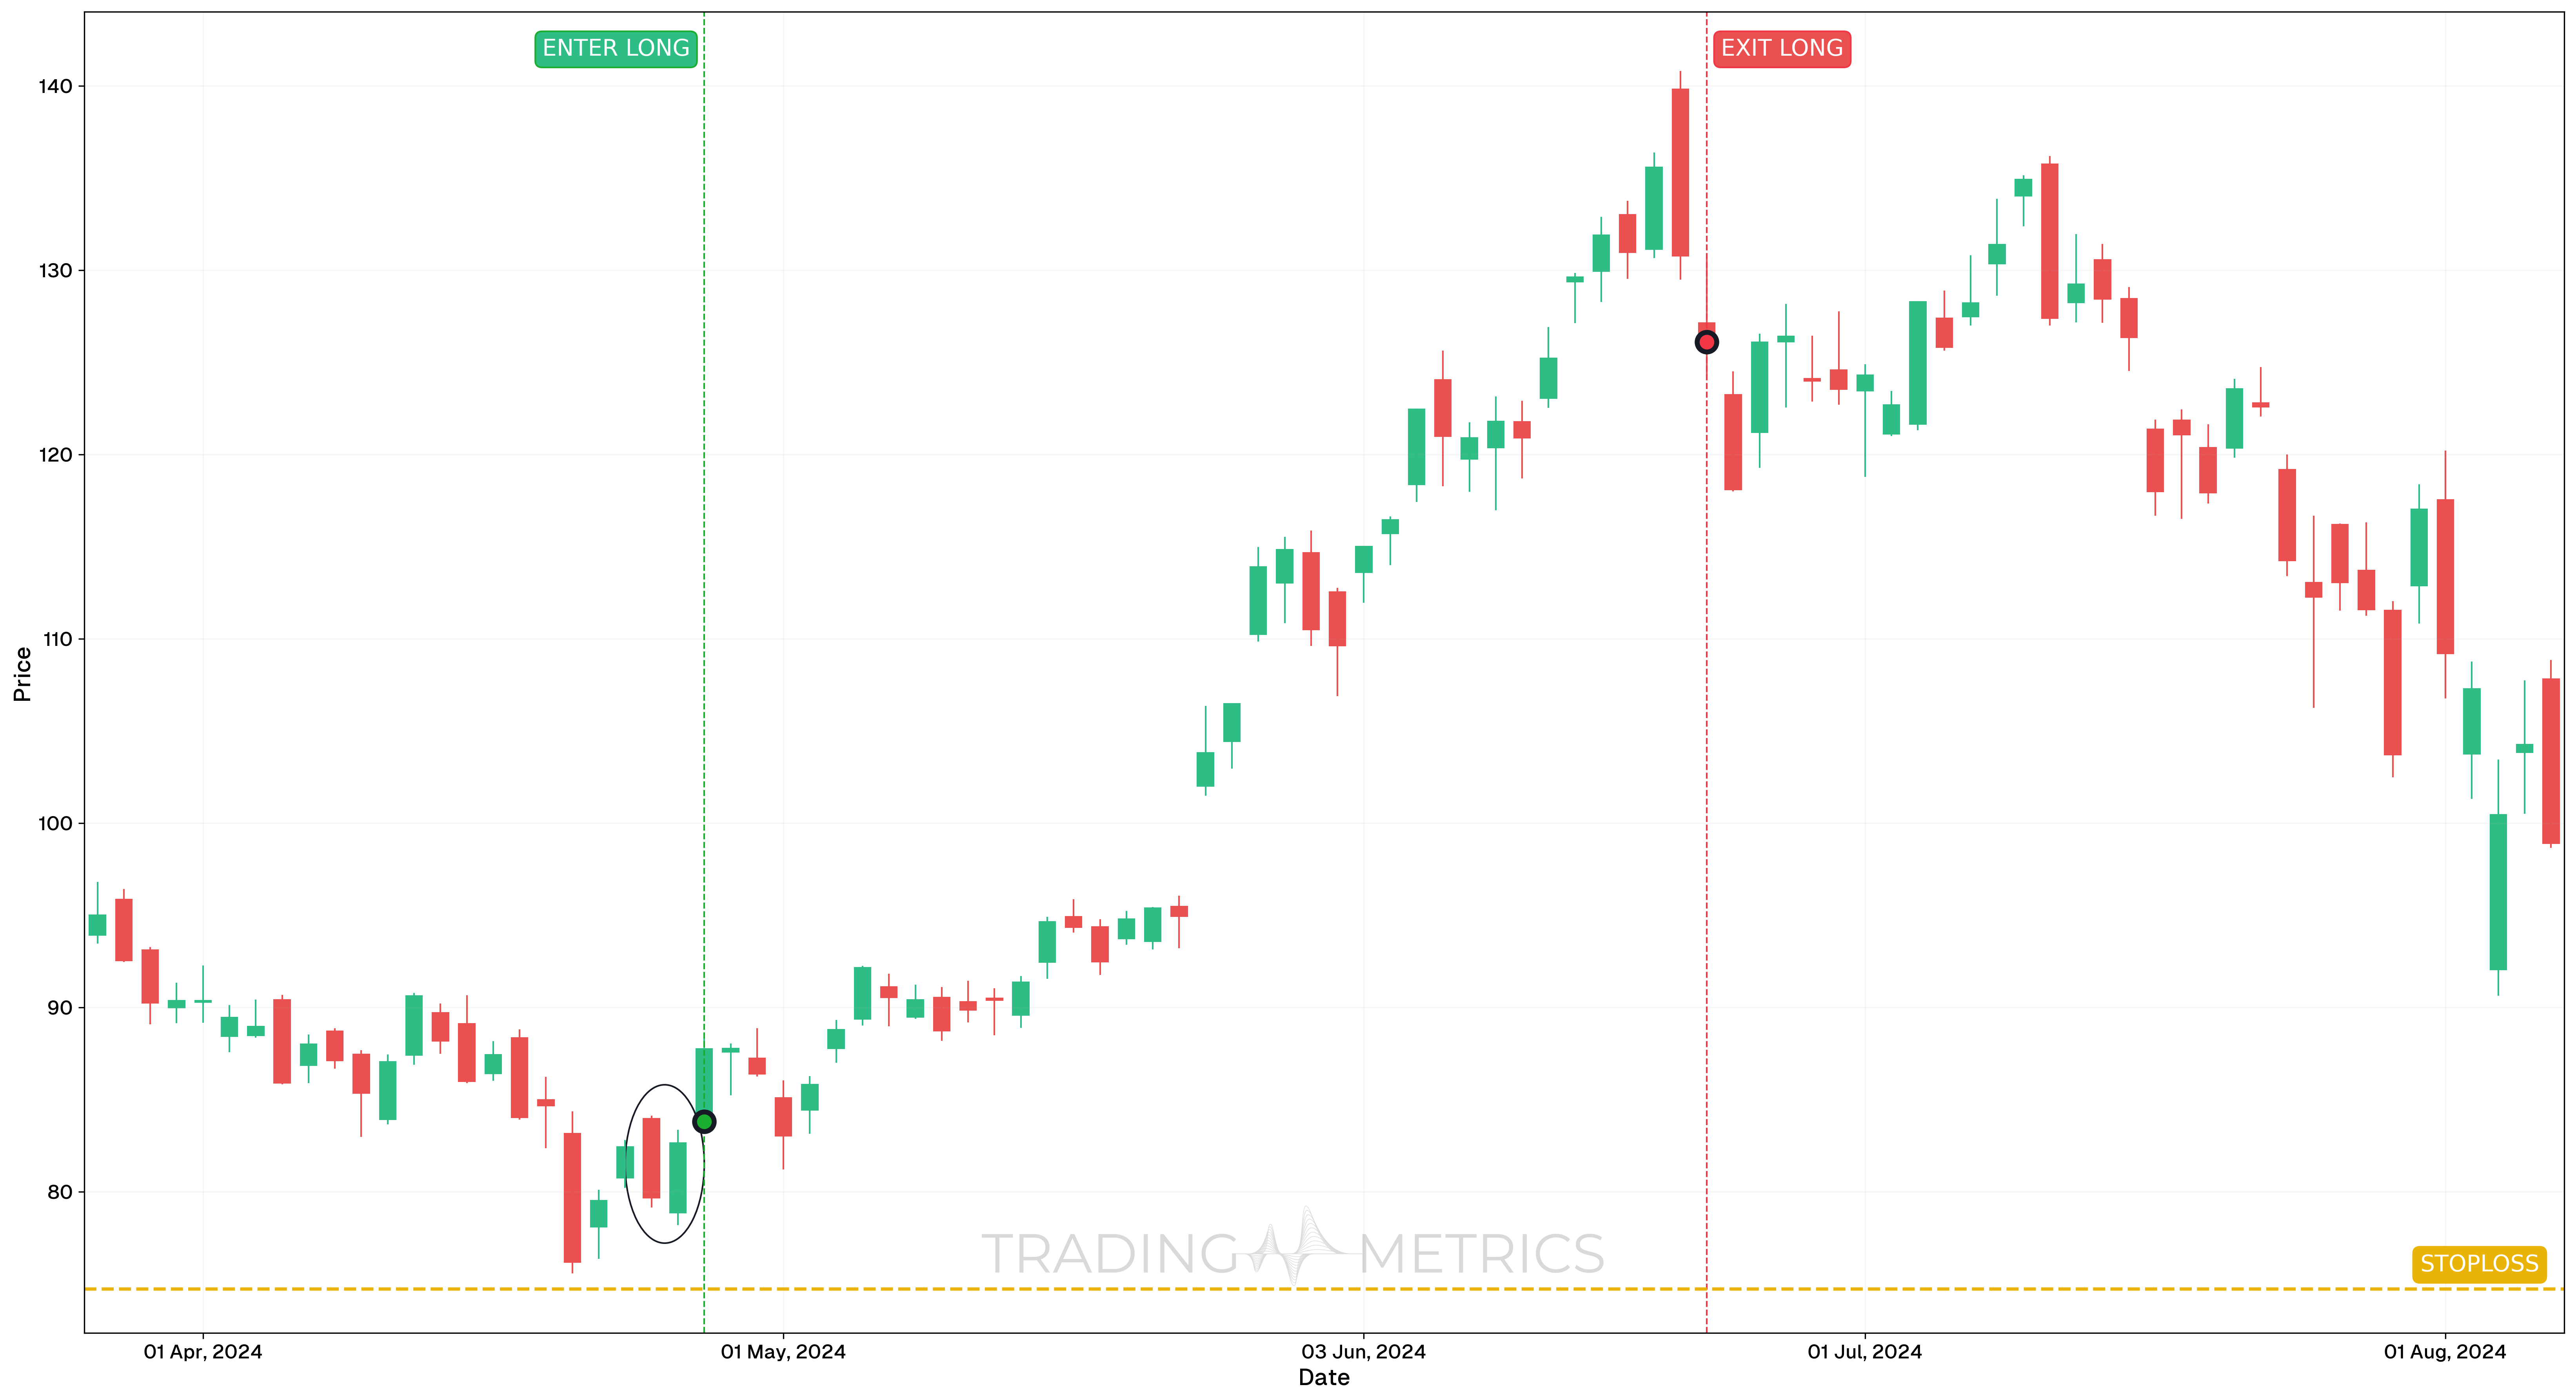
To illustrate how the Piercing Line pattern can be used to enter a trade, we will analyze the NVDA stock on the daily chart. This trade setup formed after a short-term correction and signaled a strong bullish reversal off a key support zone.
Analysis
Following a pullback in March and April 2024, NVDA approached a key support level where a clean Piercing Line candlestick formed on April 26, 2024. The first candle was a large bearish candle, followed by a bullish candle that opened lower but closed well above the midpoint of the previous candle. This structure indicated strong buying interest and a potential reversal setup.
Trade Setup
-
Entry: The trade was entered on April 26, 2024, at $83.82, following confirmation of the Piercing Line. Entry was based on:
- Formation of the pattern
- RSI rising above 50 and showing continued upward momentum
-
Exit: The trade was exited on June 21, 2024, at $126.11, near a previous support/resistance zone.
-
Outcome: The trade produced a 50.5% gain, with a strong continuation move from the initial reversal point. Price respected technical boundaries, validating the setup.
Risk Management
- Stop-Loss placement: The stop-loss was placed at $74.72, just below the low of the Piercing Line candle, providing clear invalidation of the setup if price failed to hold support.
- Position sizing: Position was sized using a 2% capital risk model, based on the difference between entry and stop-loss.
- Volatility Consideration: The pattern emerged after a period of declining volatility, which expanded after the bullish breakout, supporting a momentum-based entry.
- Risk-Reward Ratio: This trade offered a favorable Risk-Reward Ratio of 1:4.65, aligning well with reversal strategies near strong technical zones.
- Adaptive Exit Strategy: For traders seeking extended gains, trailing stops or Fibonacci extension targets could have been used. However, closing at prior resistance maintained a high-probability outcome.
Volume Glow: A volume spike on the bullish candle lights the pattern into a bullish turn.
Pre-Trade Checklist
Pierce the Proof: Pair the pattern with volume spikes and indicators like RSI to dodge fakes and brighten your odds.
Key Points
- Candle Clash: A strong bearish candle followed by a deep bullish pierce boosts reliability - shallow pierces dilute it.
- Time Frame: Glows brightest on daily or weekly charts after downtrends.
- Combine with Indicators: Use moving averages or RSI to confirm the reversal.
- Breakout Confirmation: The second candle’s close above the first’s midpoint sets the turn - don’t jump too soon.
- Price Target: Measure the first candle height or use resistance levels for a target above the close.
- Risk Management: Set a stop-loss below the second candle’s low to limit losses if it fails.
Wait for the Pierce: Acting before the second candle closes risks a dim trap - let it shine.
Conclusion
The Piercing Line pattern is a trader’s radiant tool for catching bullish reversals. Its two-candle turnaround, paired with volume, RSI, and moving averages, can spark big gains. Whether in crypto, stocks, or forex, this pattern sharpens your edge. Stay alert, manage your risk, and let the piercing form - that deep thrust could rise into a winning trade.
Frequently Asked Questions
Quick answers based on this page's topic.
The Piercing Line is a two-candle 'Bear Trap.' It begins with a large bearish candle followed by a bullish candle that gaps lower but closes more than halfway into the first candle's body. It proves that the initial panic (the gap down) was a false signal and that buyers have seized control.
Traders typically measure the vertical height of the first bearish candle and project that distance upward from the pattern's close. This 'Measured Move' approach targets the area where the trend was originally broken, providing an objective area to secure gains.
In a Bullish Engulfing, the second candle swallows the entire first candle. In a Piercing Line, the second candle closes above the midpoint (50%) but below the open of the first candle. Both are strong reversal signals, but the Engulfing is structurally more aggressive.