Bullish Reversal Patterns: Reading Accumulation at the Bottom
Bullish reversal patterns in technical analysis signal the potential end of a downward trend and the beginning of an upward trend in a financial market. These patterns often appear on candlestick charts and help traders identify buying opportunities.
Frequently Asked Questions
Quick answers based on this page's topic.
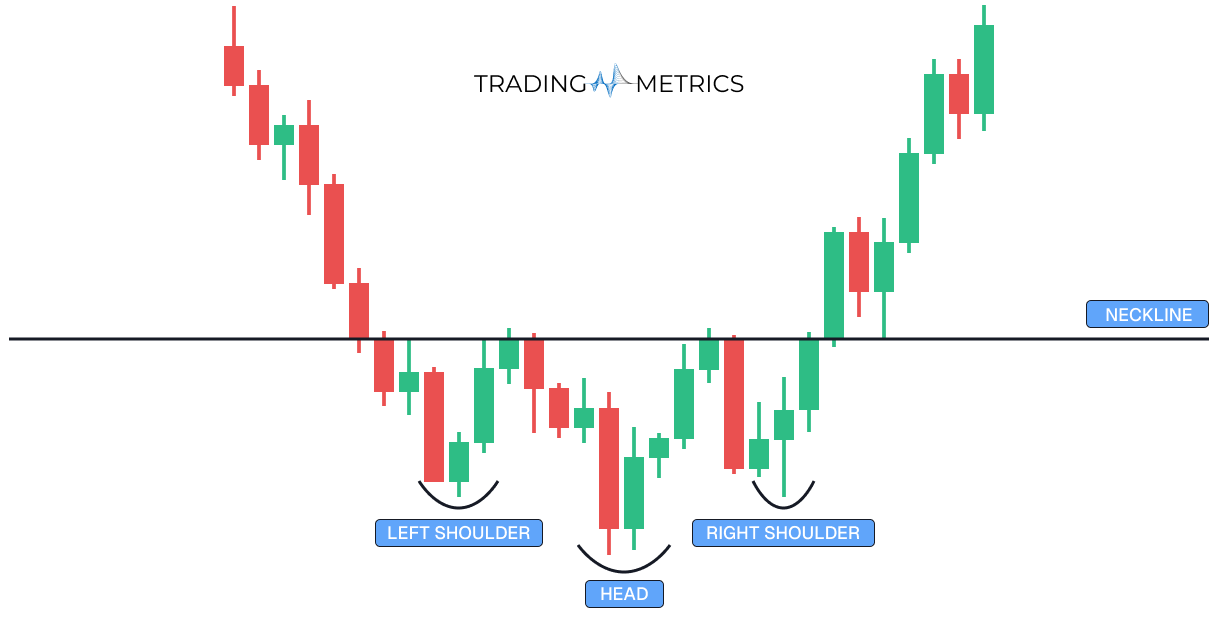
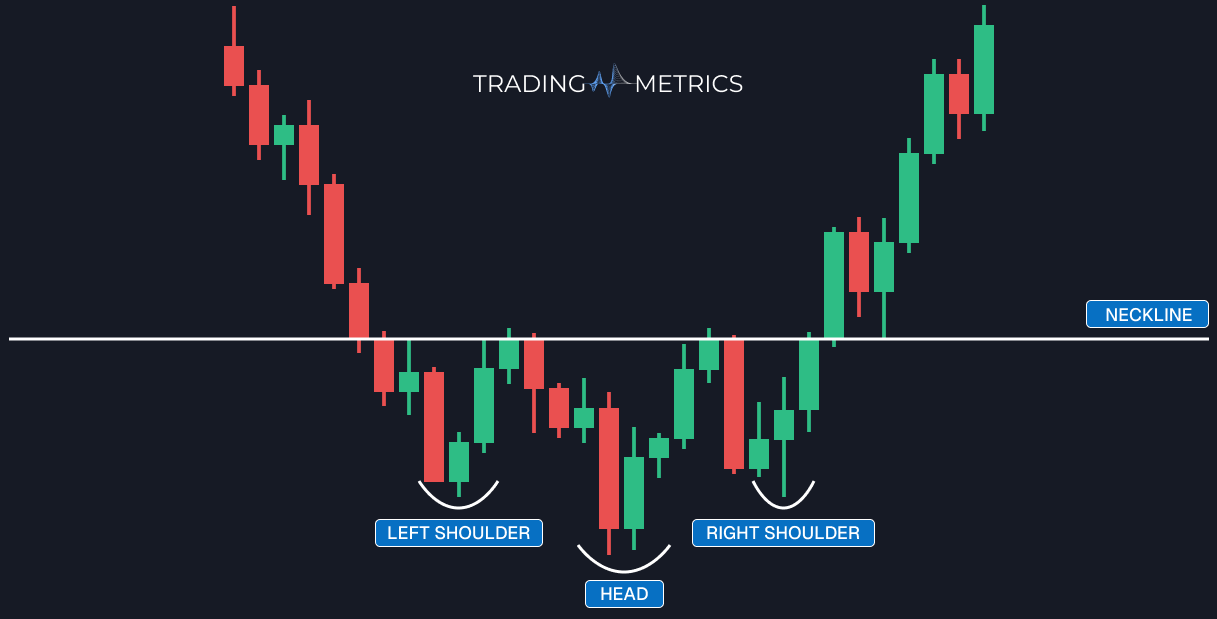
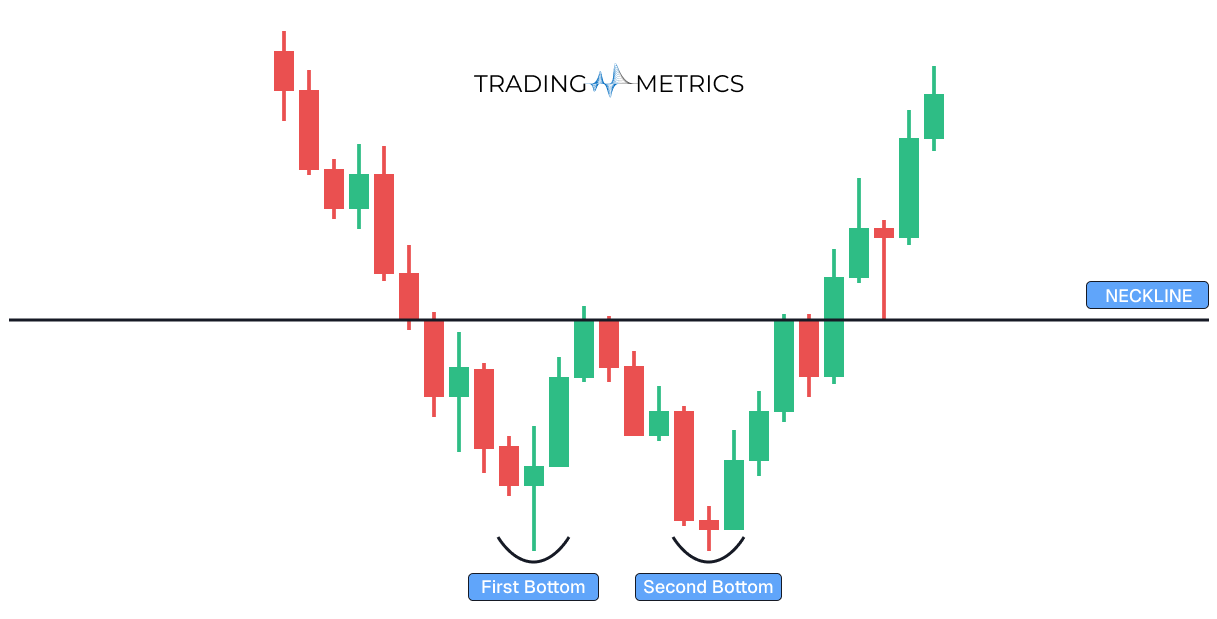
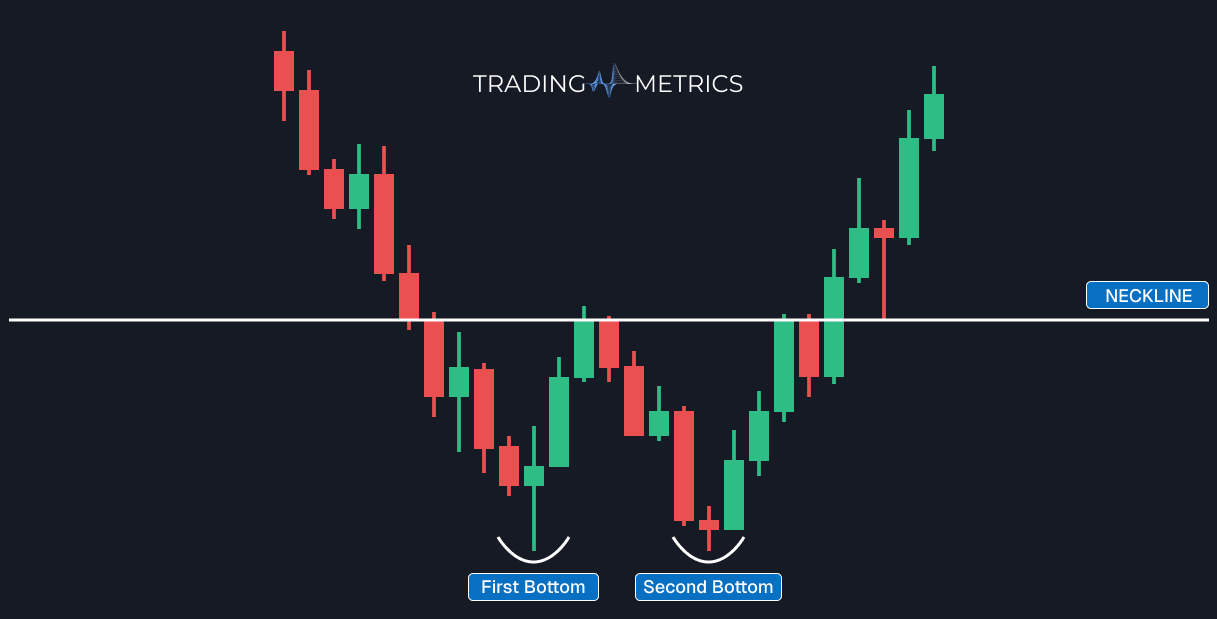
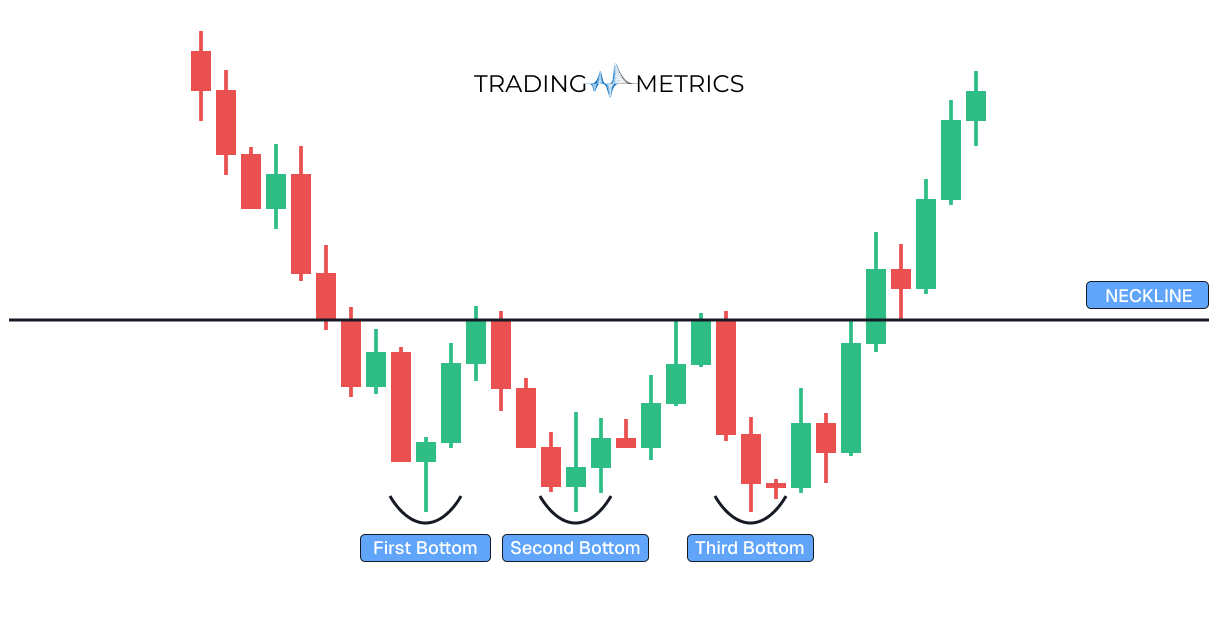
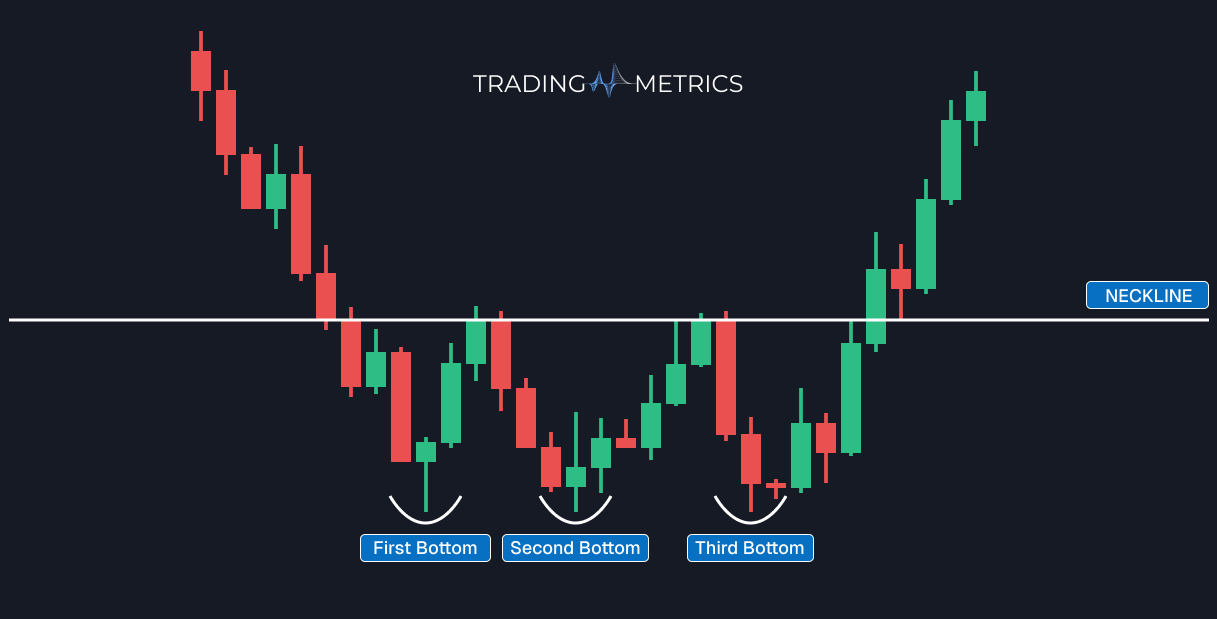
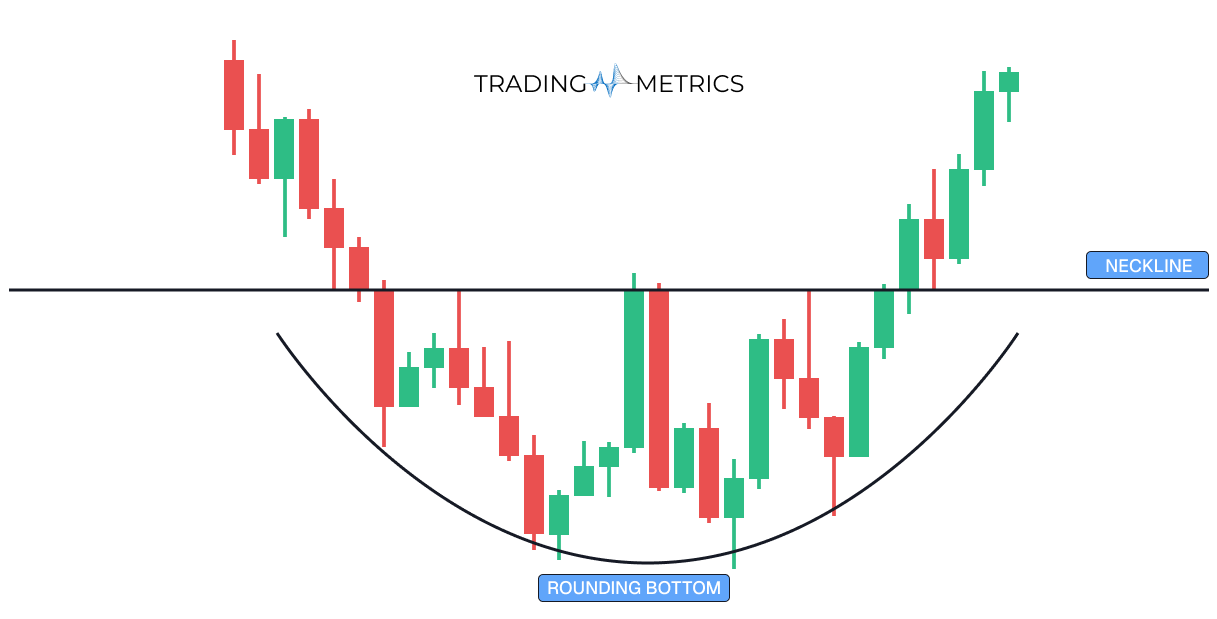
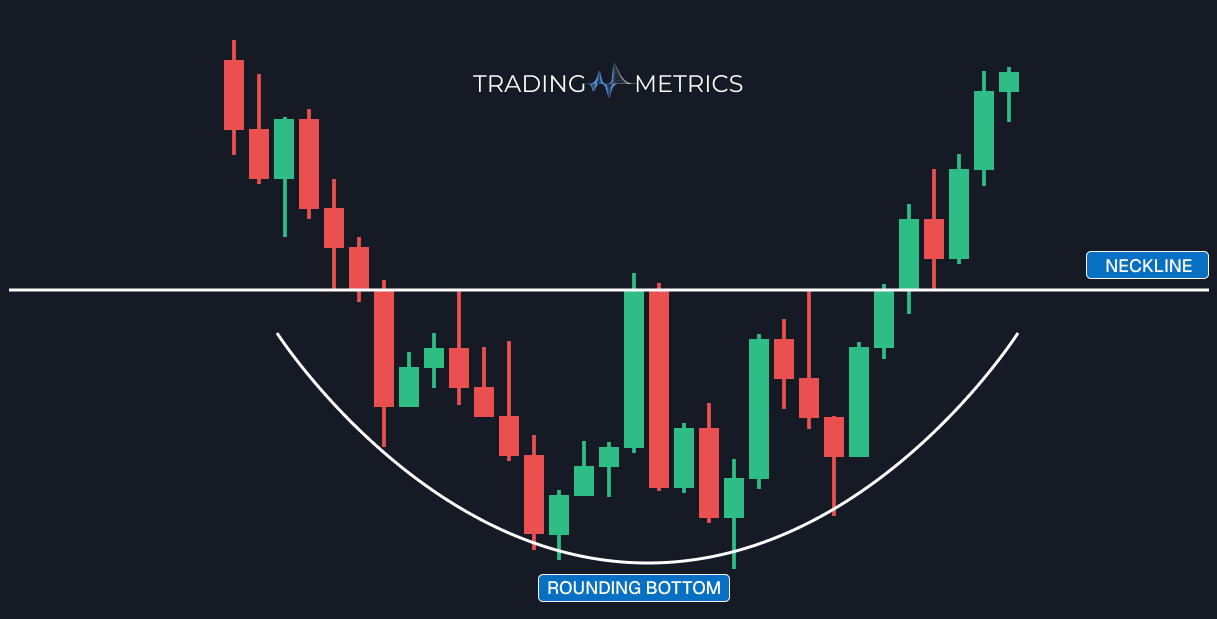
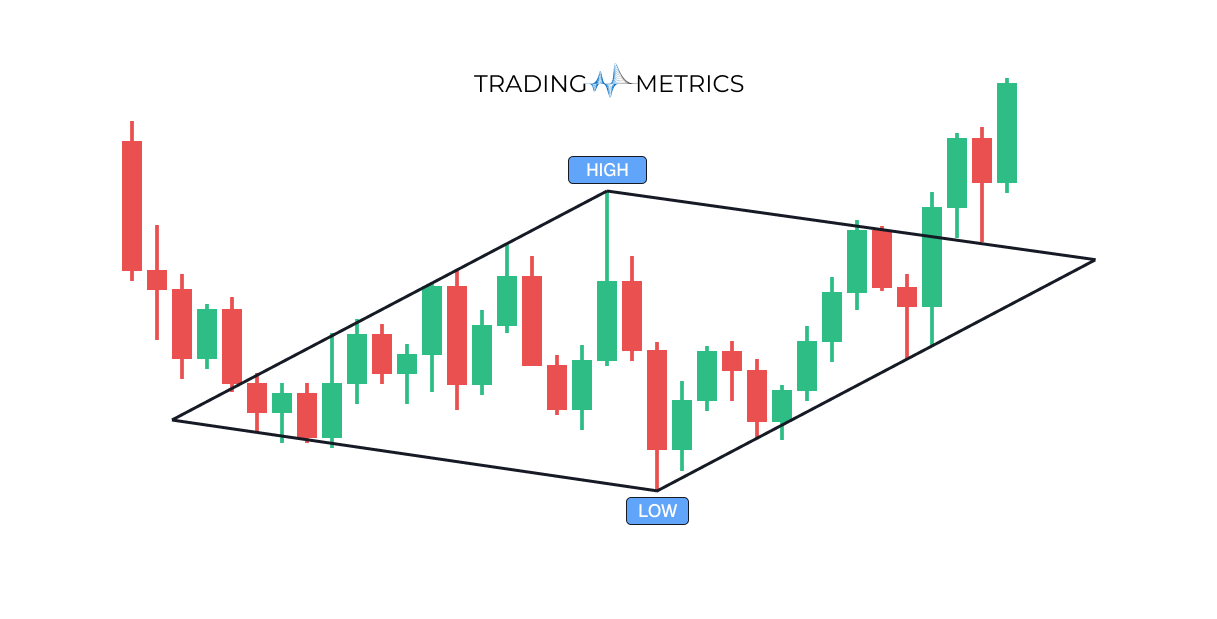
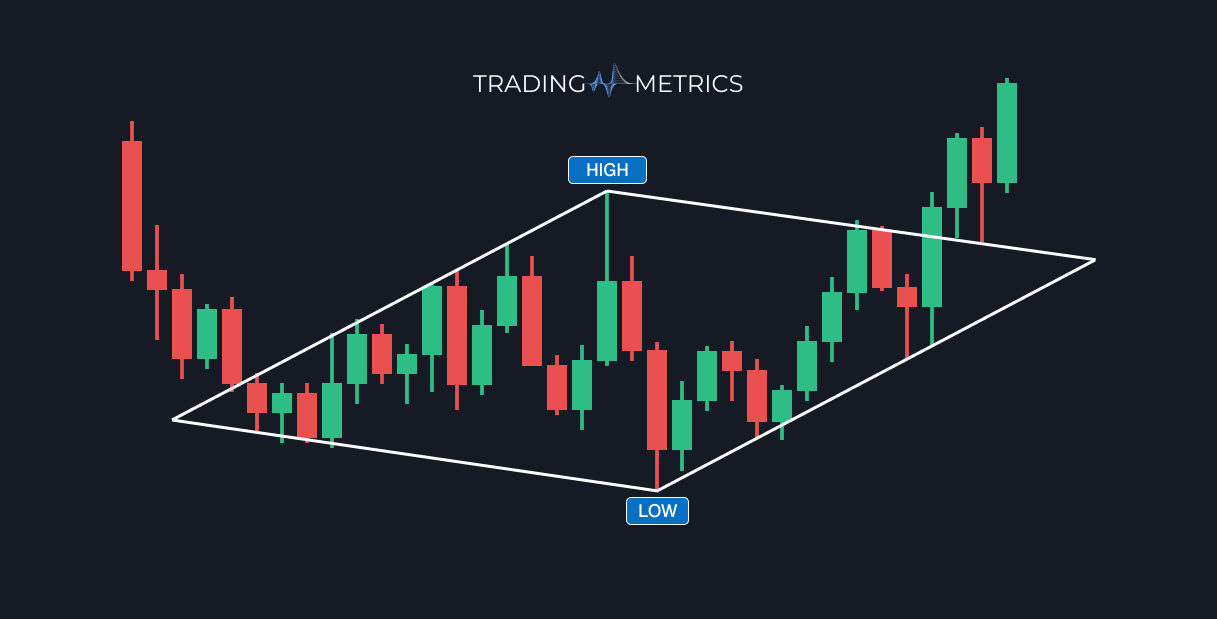
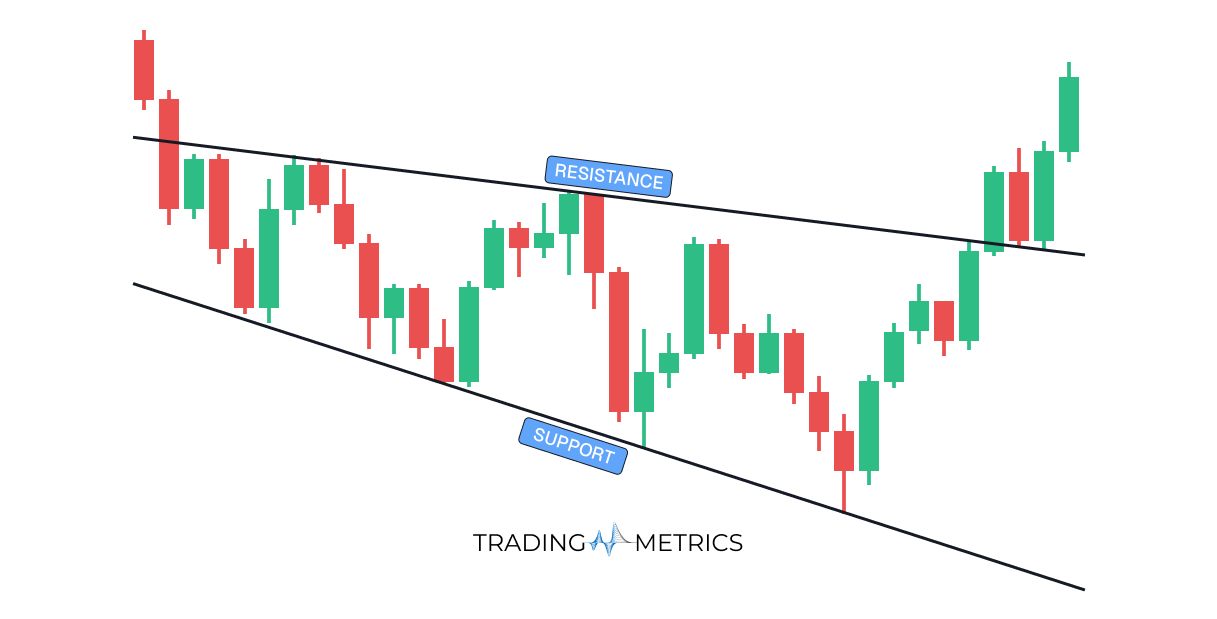
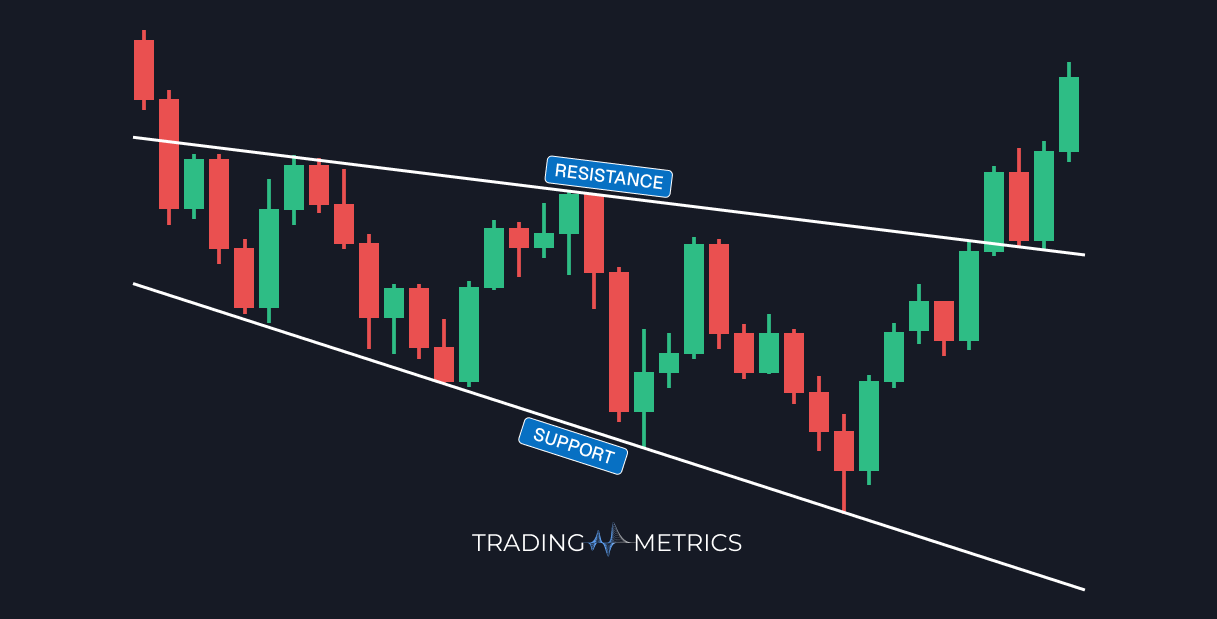
Bullish reversal patterns, such as the Double Bottom or Inverse Head and Shoulders, show where the 'floor' is being established. They indicate that sellers have exhausted their supply and buyers are stepping in with enough volume to absorb the remaining pressure, creating a base for a rally.
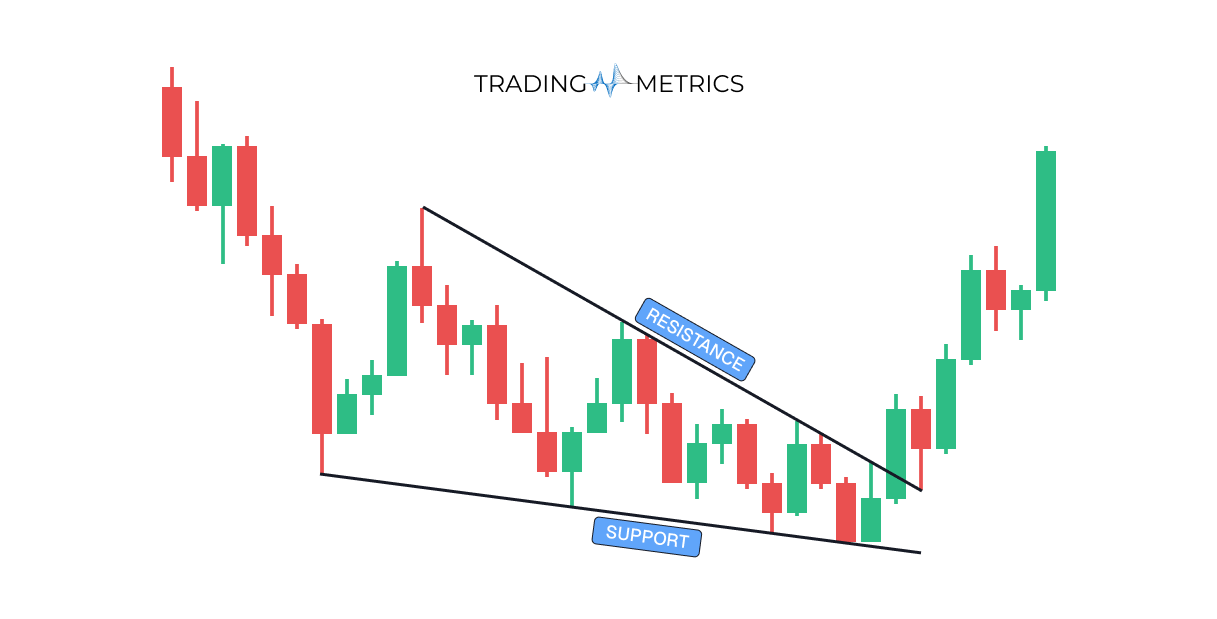
Volume acts as a confirmation engine. A bullish reversal accompanied by increasing volume on the breakout suggests strong institutional buying. If a pattern breaks out on low volume, it may lack the 'fuel' to sustain a new uptrend and could lead to a false breakout.
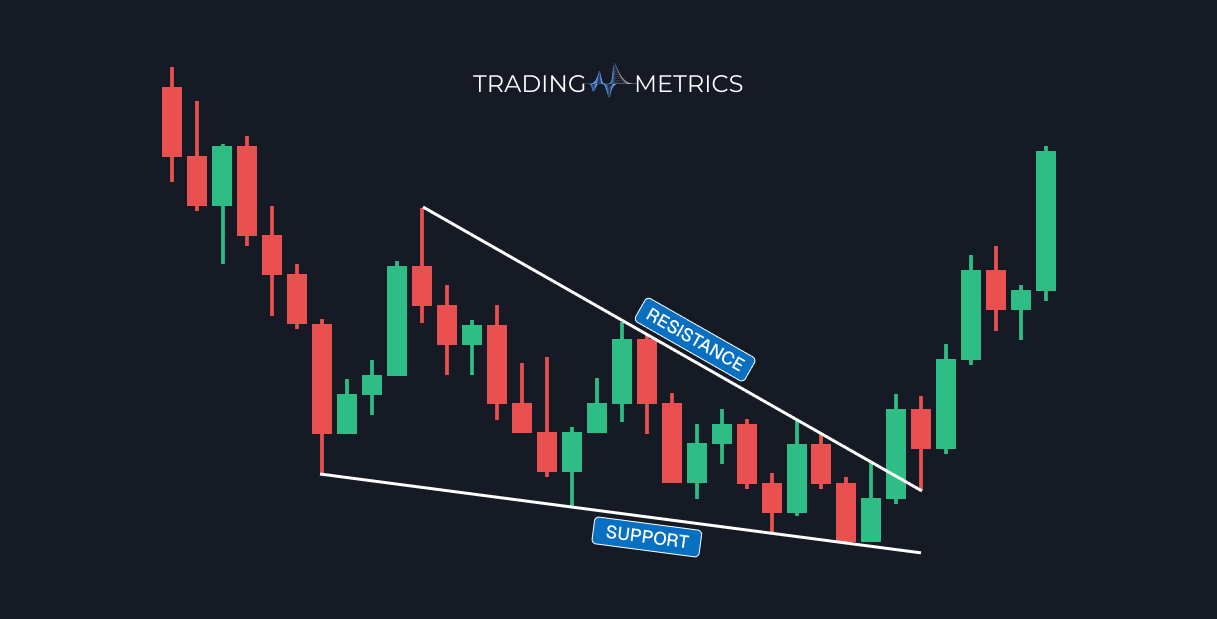
Yes. Patterns fail when the market lacks enough follow-through to overcome overhead resistance. Traders manage this risk by placing stop-losses below the pattern's lowest point, ensuring that if the reversal thesis is invalidated, their capital is protected.