Volatility (Standard Deviation): How Much Does Price Actually Move?
Volatility, often measured by standard deviation, is a statistical metric that quantifies the dispersion or variability of returns for a given security or market index. In simpler terms, it’s a way to gauge how much the price of an asset, such as Bitcoin, fluctuates over a specific period. High volatility means the price moves up and down rapidly, while low volatility indicates steadier price movements.
The essence of risk is unpredictability. Volatility is not a villain, but a messenger of the unknown.
- Howard Marks
How to Calculate Volatility (Standard Deviation)?
Volatility measures the extent to which the price of an asset fluctuates during a specific period. It is often expressed as a percentage and can be calculated using historical price data.
The standard formula for volatility (σ) is as follows:
Where:
- is the return for period
- is the average return over periods
- is the number of periods
Monitor Volatility: Keep an eye on volatility indicators to adjust your trading strategies accordingly.
Importance of Volatility in Trading
Volatility is a crucial factor in trading for several reasons. It plays a significant role in risk assessment, as high volatility indicates a greater level of risk due to the potential for significant price swings. It also helps traders identify opportunities, allowing them to capitalize on price fluctuations by buying low and selling high. Furthermore, volatility is a key component in pricing derivatives such as options, where it directly influences the value of these financial instruments.
When trading in high volatility markets, always adjust your position size to manage risk effectively. Larger price swings can amplify both potential gains and losses, so reducing position size helps protect your capital during unpredictable market movements.
Trading Examples
Below, we present detailed examples of trading scenarios to illustrate how market volatility impacts outcomes. These examples include both profitable trades and loss-making trades, highlighting the importance of timing, analysis, and risk management in navigating the complexities of financial markets.
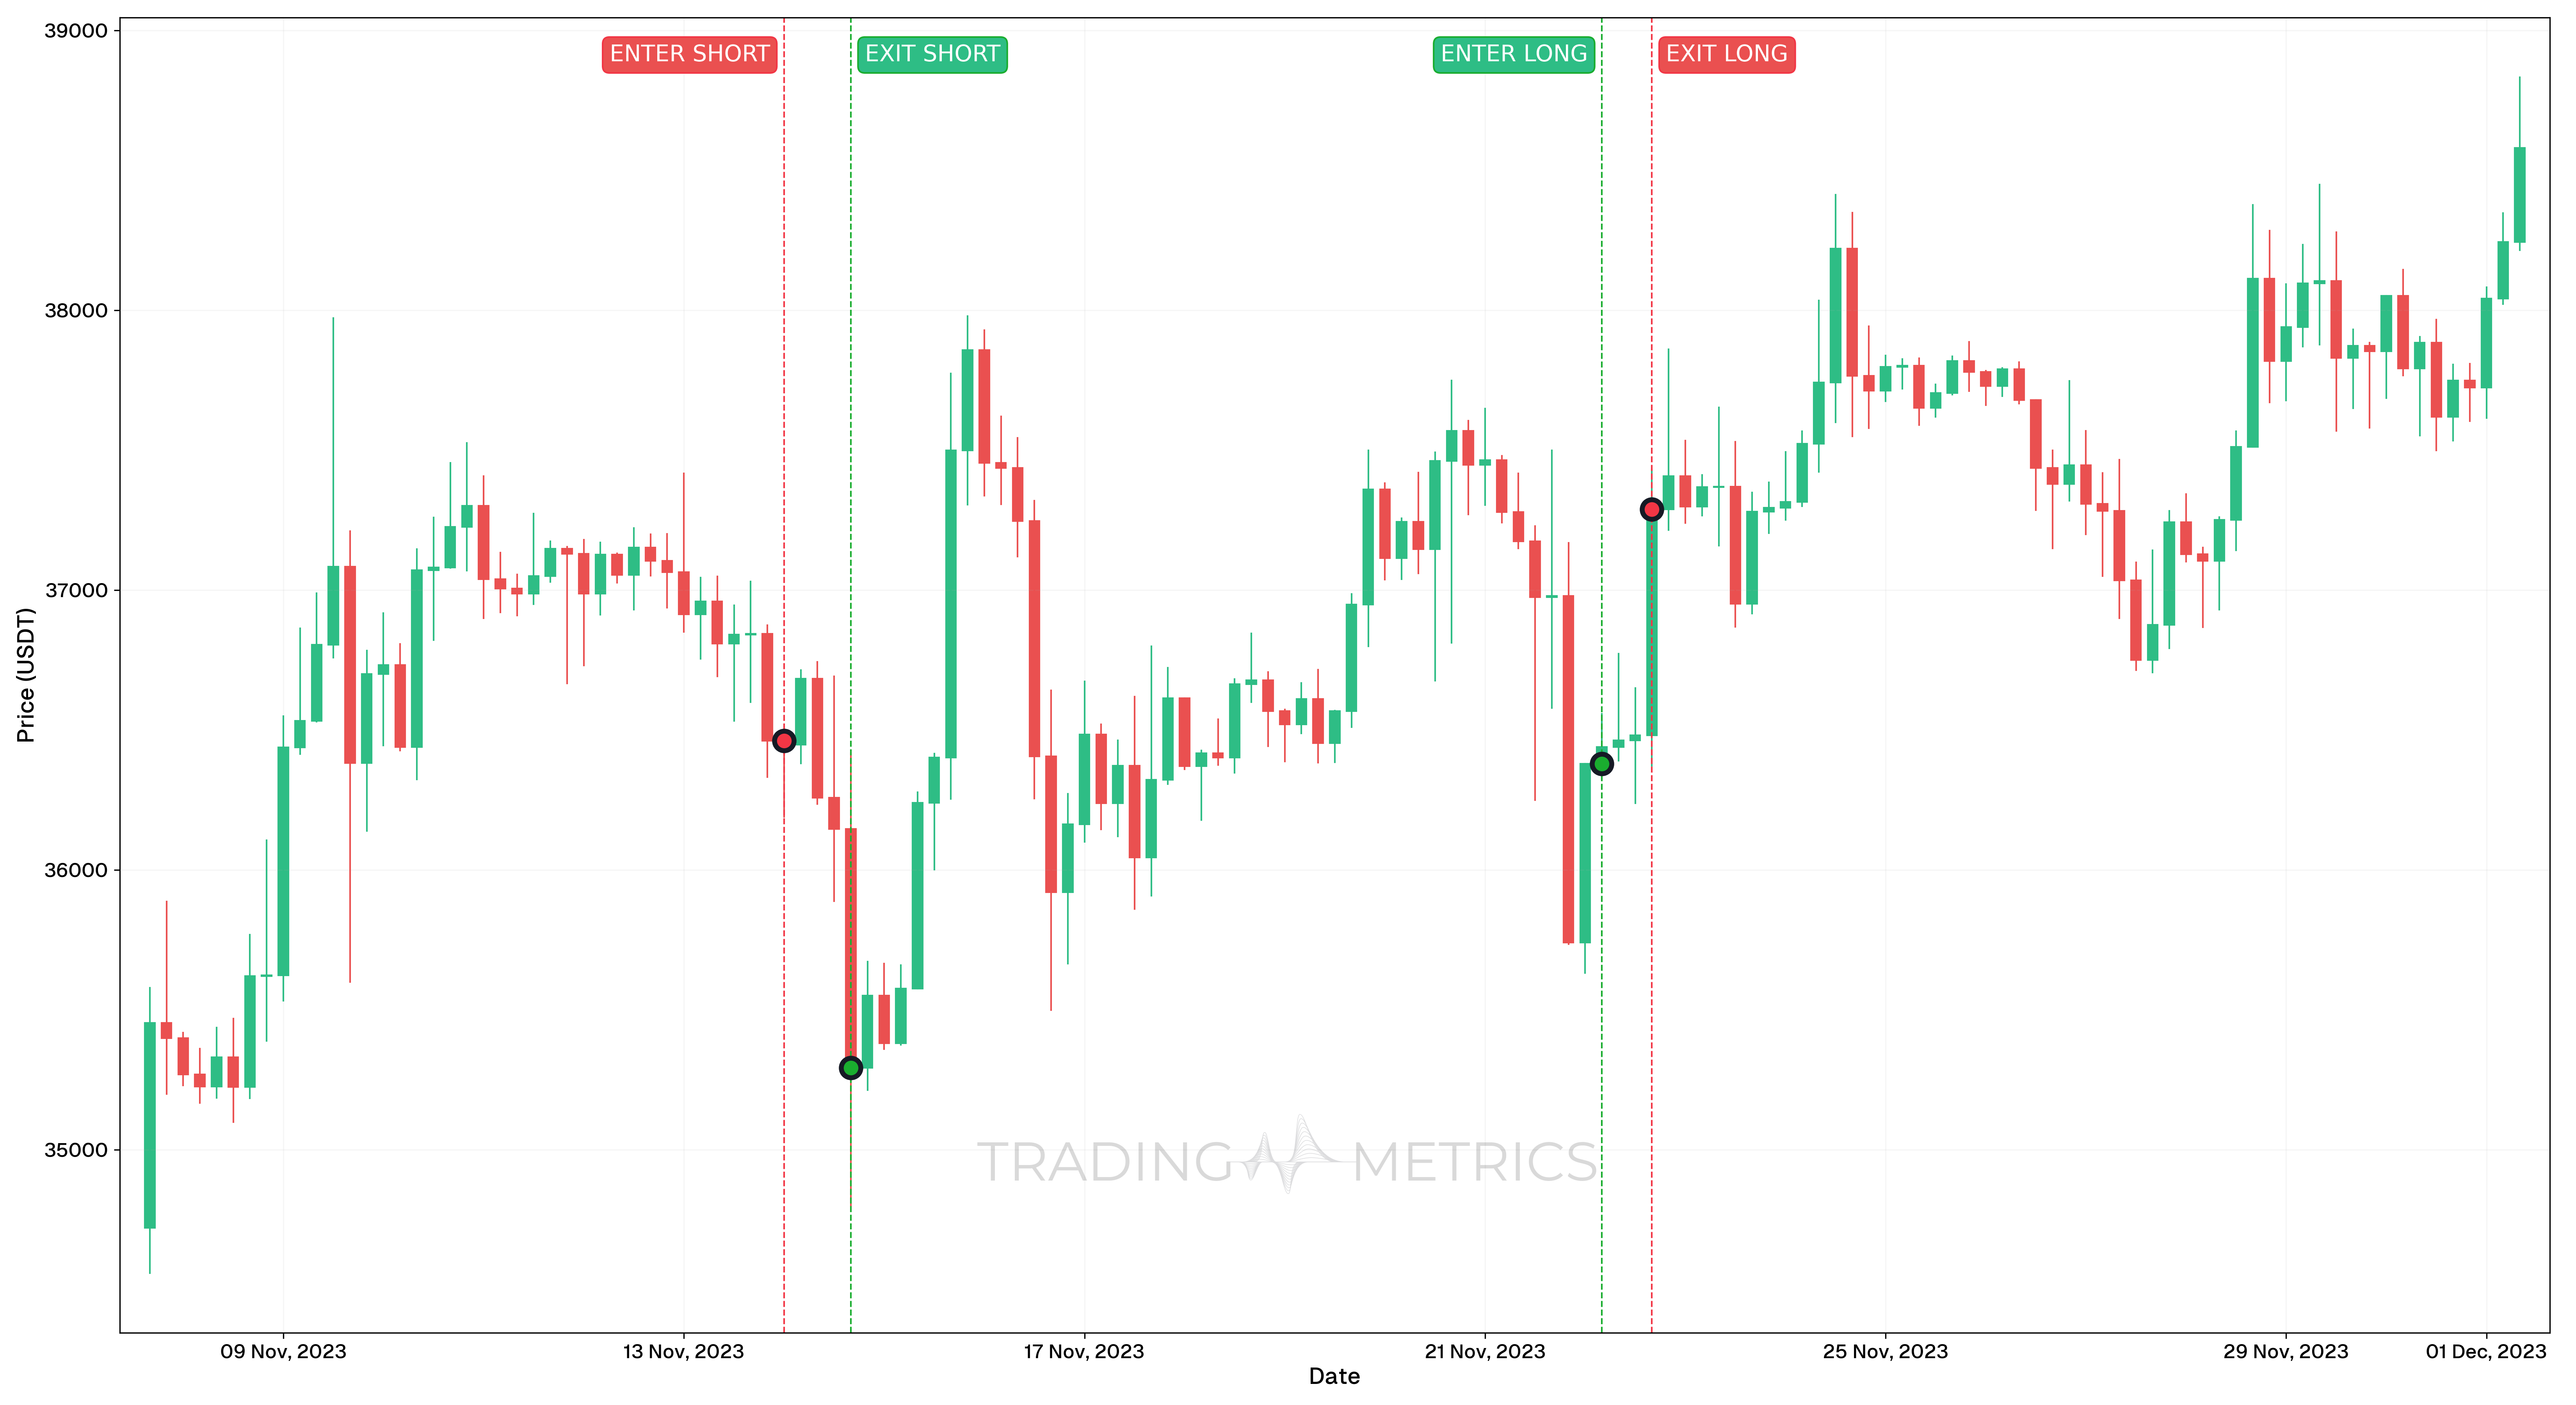
Profitable Trade
| Metric | Trade 1 | Trade 2 |
|---|---|---|
Trade Type | Short Position | Long Position |
Entry Time | 14 Nov, 2023, 00:00 | 22 Nov, 2023, 04:00 |
Exit Time | 14 Nov, 2023, 16:00 | 22 Nov, 2023, 16:00 |
Entry Price | $36,462.93 | $36,380.00 |
Exit Price | $35,293.99 | $37,289.98 |
Position | Short | Long |
Result | Gain of $1,168.94 | Gain of $909.98 |
Analysis
- The short position was initiated on 14th November 2023, 00:00, targeting a decline in Bitcoin’s price. The trade took advantage of bearish sentiment, aligning with technical indicators suggesting downward momentum.
- The long position commenced on 22nd November 2023, 04:00, with the expectation of a price recovery supported by positive market conditions.
These trades illustrate the potential for profitable outcomes in both bearish and bullish market conditions. The careful timing of entries and exits, combined with sound technical analysis, played a pivotal role in mitigating risks and securing gains. Variations in results could stem from differing exit strategies, emphasizing the importance of aligning trades with individual risk tolerance.
Trade Setup
-
Short Trade:
- Entry: On 14th November 2023, 00:00, a short position was entered at $36,462.93.
- Exit: The position was closed on 14th November 2023, 16:00 at $35,293.99, securing a gain of $1,168.94.
-
Long Trade:
- Entry: On 22nd November 2023, 04:00, a long position was initiated at $36,380.00.
- Exit: The position was closed on 22nd November 2023 at $37,289.98, achieving a gain of $909.98.
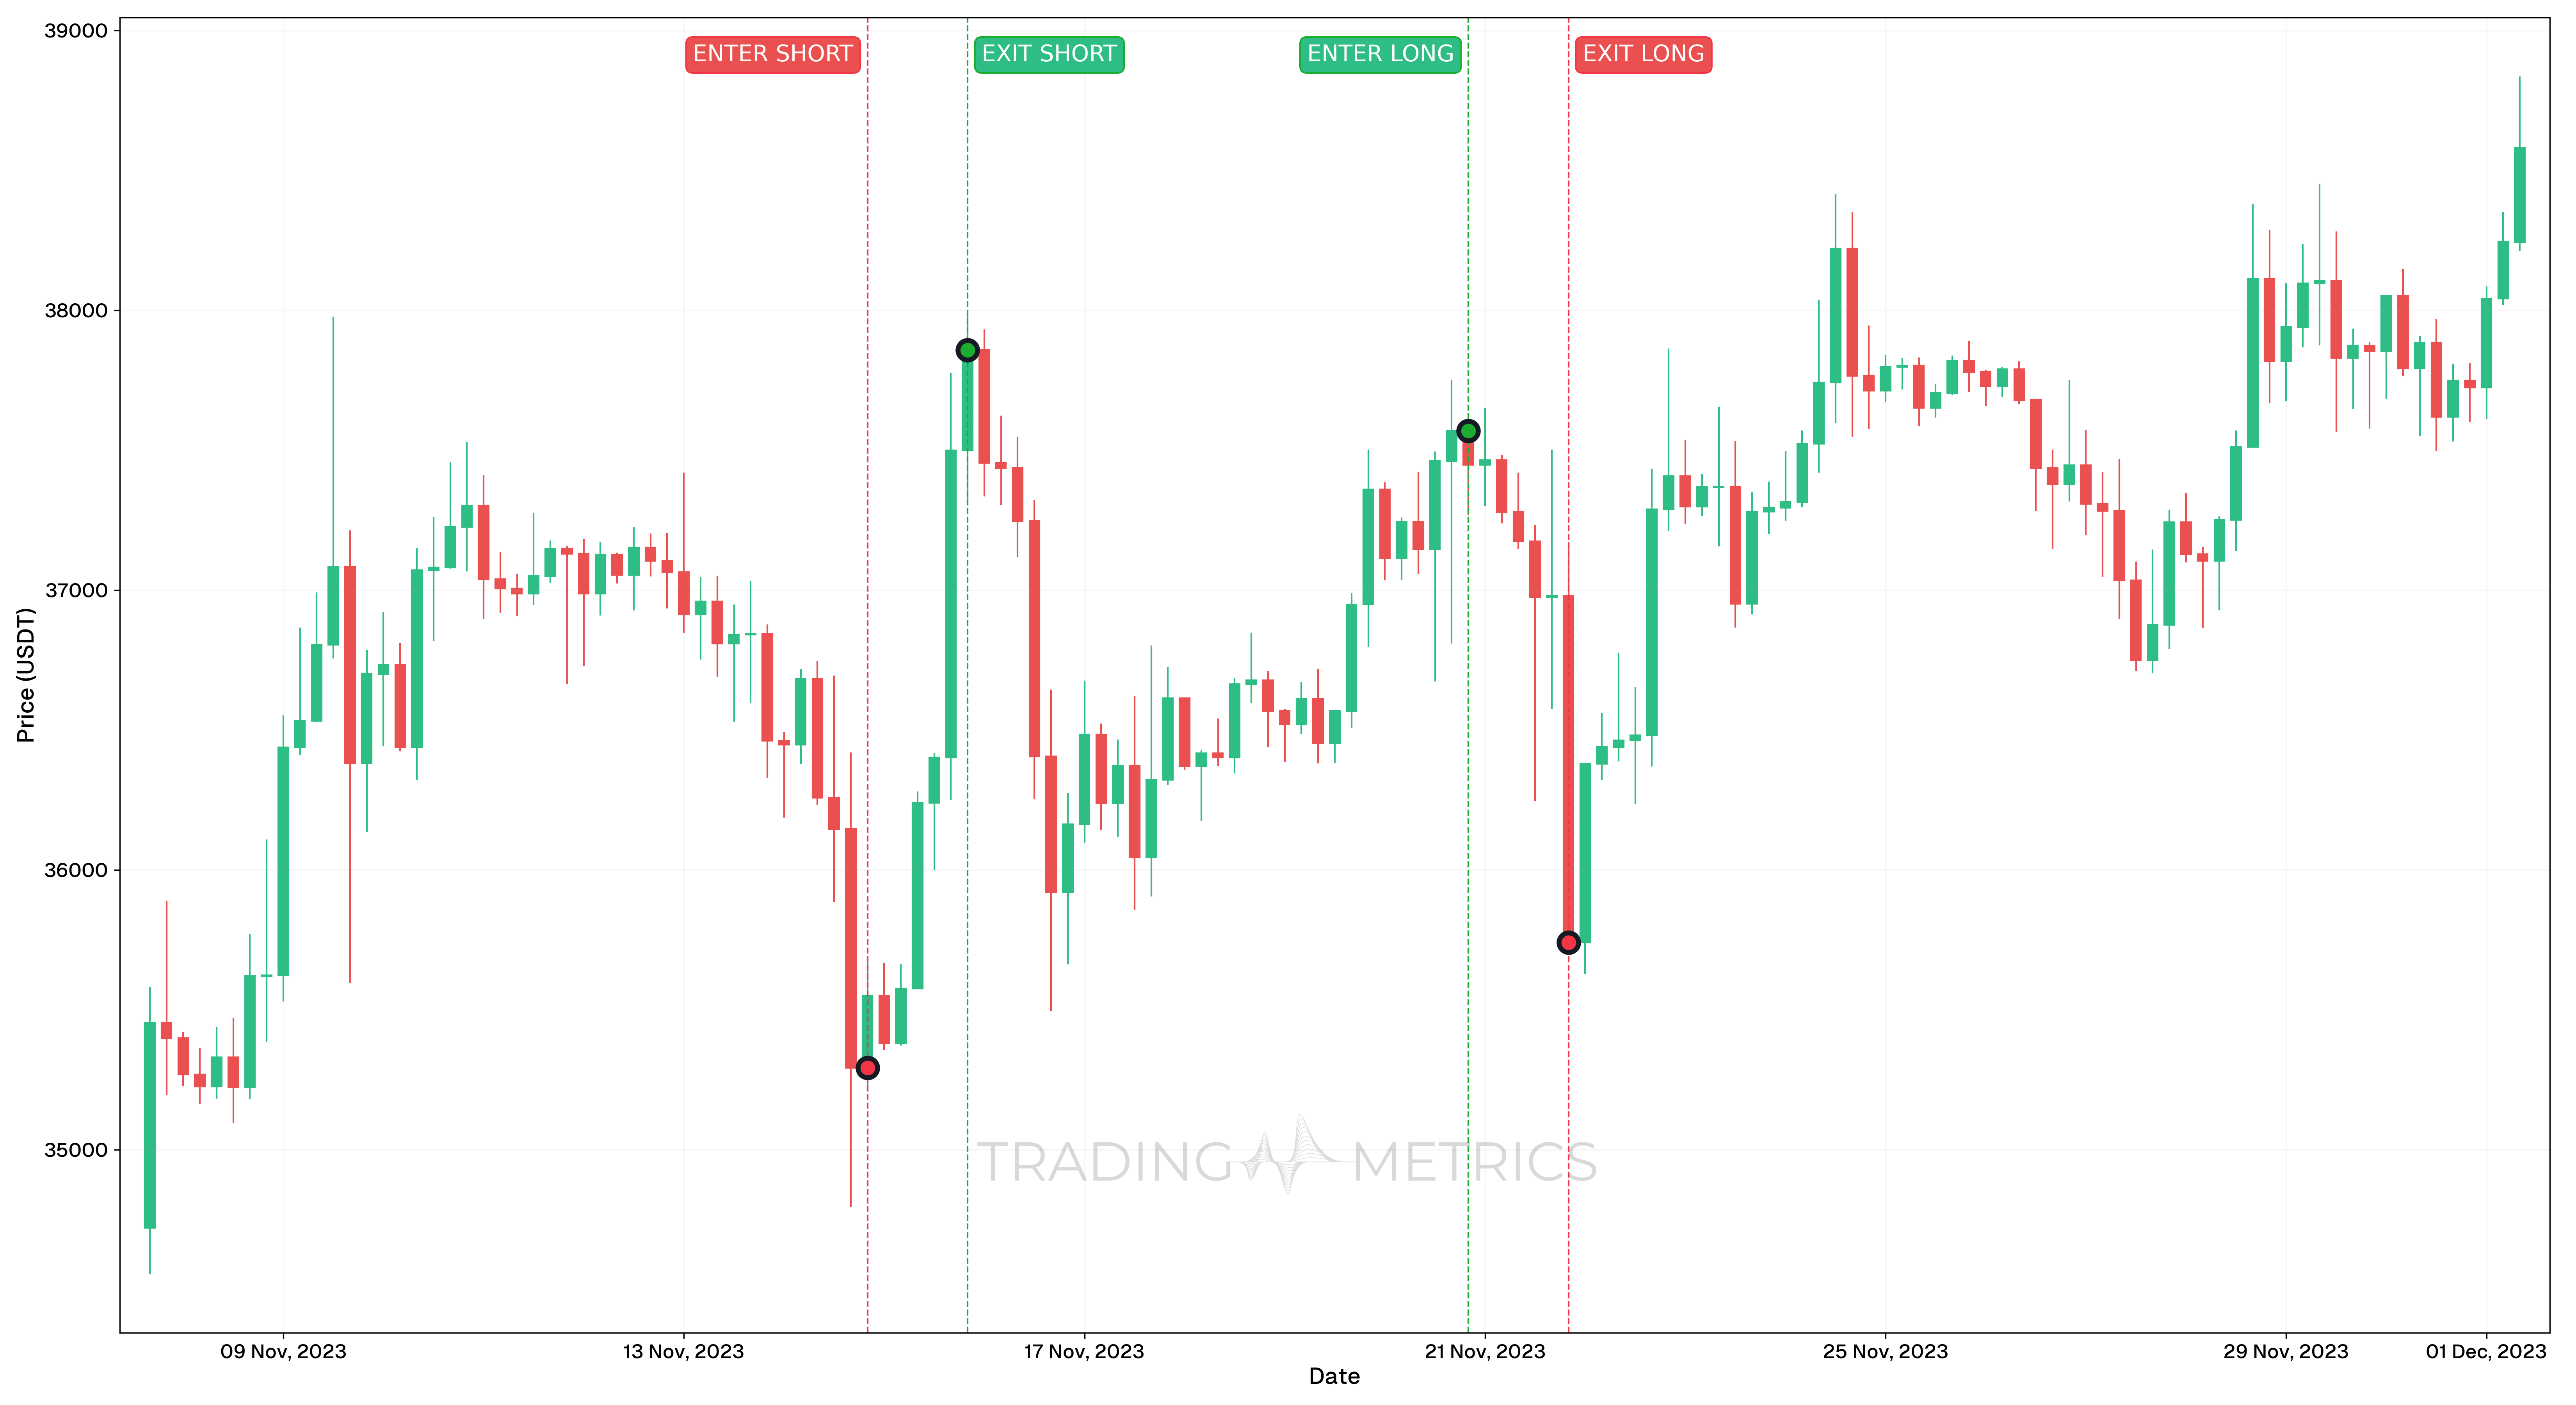
Loss-Making Trades
Analysis of Trades from 14th November to 21st November 2023
| Metric | Trade 1 | Trade 2 |
|---|---|---|
Trade Type | Short Position | Long Position |
Entry Time | 14 Nov 2023, 20:00 | 20 Nov 2023, 20:00 |
Exit Time | 15 Nov 2023, 20:00 | 21 Nov 2023, 20:00 |
Entry Price | $35,293.99 | $37,569.23 |
Exit Price | $37,858.20 | $35,741.65 |
Position | Short | Long |
Result | Loss of $2,564.21 | Loss of $1,827.58 |
Analysis
- The short position initiated on 14th November 2023, 20:00 anticipated a price decline in Bitcoin but was adversely affected by an unexpected price surge.
- The long position entered on 20th November 2023, 20:00 aimed to capitalize on a price rebound; however, a subsequent drop led to significant losses.
These loss-making trades underline the importance of strict risk management and stop-loss strategies in trading. The inability to anticipate or adapt to abrupt market reversals resulted in significant losses. Such cases emphasize the need for a disciplined approach to mitigate risks, particularly in a highly volatile market like Bitcoin.
Trade Setup
-
Short Trade:
- Entry: On 14th November 2023, 20:00, a short position was entered at $35,293.99.
- Exit: The position was closed on 15th November 2023, 20:00 at $37,858.20, resulting in a loss of $2,564.21.
-
Long Trade:
- Entry: On 20th November 2023, 20:00, a long position was initiated at $37,569.23.
- Exit: The position was closed on 21st November 2023, 20:00 at $35,741.65, resulting in a loss of $1,827.58.
Diversify: Spread your investments to mitigate the risks associated with high volatility assets.
Combining Volatility with Other Tools
Volatility can be combined with other tools to enhance trading insights:
- Bollinger bands: These are volatility bands placed above and below a moving average. When prices break above or below these bands, it indicates high volatility and potential trend changes.
- Relative Strength Index (RSI): This momentum oscillator measures the change and speed of price movements. Combining RSI with volatility can help identify overbought or oversold conditions.
- Moving Averages: Using moving averages can help smooth out price data and identify trends, while volatility provides context on the strength and stability of these trends.
Key Points
- Measure of Risk: Volatility quantifies the degree of price fluctuation in an asset, providing a key indicator of its risk profile.
- Trading Opportunities: High volatility often creates opportunities for active traders, as larger price swings can lead to significant profit potential.
- Market Sentiment Gauge: Volatility reflects investor sentiment, with spikes often indicating fear, uncertainty, or strong reactions to news.
- Impact on Portfolio: Managing volatility is essential for portfolio stability; excessive exposure to volatile assets can increase overall risk.
- Indicators of Volatility: Tools like Bollinger Bands, Average True Range (ATR), and the Volatility Index (VIX) help measure and analyze market volatility.
- Strategic Implications: Low volatility environments favor steady, long-term investment strategies, while high volatility may require more dynamic approaches.
- Correlation with Liquidity: High volatility assets can experience reduced liquidity, resulting in wider spreads and execution challenges.
- Macro Factors: Economic events, policy changes, and geopolitical developments often trigger shifts in market volatility.
- Psychological Influence: Volatility can provoke emotional trading; maintaining discipline and sticking to risk management plans is critical.
- Diversification Benefits: Combining assets with different volatility levels in a portfolio can help mitigate risk and achieve balanced returns.
Conclusion
In conclusion, volatility is a vital metric in trading, offering insights into the risk and potential rewards of an asset. Understanding and calculating volatility can help traders make informed decisions and manage risk effectively. By understanding and leveraging volatility, traders can navigate the markets more effectively, balancing risk and opportunity to achieve their financial goals.
Frequently Asked Questions
Quick answers based on this page's topic.
Standard deviation measures how much an asset's price varies from its average over time. High standard deviation indicates large, unpredictable price swings (high risk), while low standard deviation suggests steady, more predictable price action (low risk).
The 'Golden Rule' of risk management is to reduce position size as volatility increases. By doing this, you keep the dollar amount of your risk consistent. Trading the same size in a high-volatility market as you do in a low-volatility one leads to accidental over-leveraging.
Not necessarily. Volatility is simply movement, and movement creates opportunity. While it increases risk, it also provides the price ranges needed for large profits. The key is not avoiding volatility, but rather having the tools to measure and manage it correctly.