Evening Star Pattern: Reading the Three-Candle Top Reversal
The Evening Star pattern is a bearish reversal signal in technical analysis, most often appearing at the peak of an uptrend. It consists of three candles: a strong bullish candle, a small-bodied candle showing indecision, and a large bearish candle that confirms the reversal. This sequence signals that bullish momentum is fading and sellers are gaining control, offering traders a chance to sell or short as a potential downtrend begins.
Mind the Gap: A gap between the first and second candles is common in stocks due to overnight trading. In crypto, where markets trade 24/7, this gap may not appear, but the pattern remains valid even without it.
How to Identify the Evening Star Pattern in Trading
The Evening Star is a bearish reversal candlestick formation. It develops over three candles at the top of an uptrend, moving from bullish strength to hesitation and then a decisive bearish shift. The setup signals that buyers are exhausted and sellers have taken control. Here’s how to spot it:
Start with the Big Picture
This pattern appears after an uptrend. Buyers dominate at first, but momentum fades into indecision before turning into heavy selling pressure.
Trace the Three-Candle Sequence
The structure plays out across three stages. Recognizing how momentum fades and flips is key to spotting the setup.
- First Candle: A long bullish candle extending the uptrend, closing near its high.
- Second Candle: A small-bodied candle (bullish, bearish, or doji), often gapping up, showing hesitation.
- Third Candle: A long bearish candle that closes well into the first candle’s body, ideally below its midpoint, confirming the reversal.
Zero in on the Confirmation Level
The confirmation level is the midpoint of the first candle’s body. For a valid signal, the third candle should close below this midpoint, confirming the bearish reversal. More aggressive traders may act earlier if price closes below the second candle’s low, but this carries greater risk.
Watch the Breakdown
The bearish trigger comes when the third candle closes below the midpoint of the first candle’s body.
- A decisive bearish close or
- A gap-down with strong follow-through
Both confirm the reversal and provide the entry.
Check Volume for Additional Confirmation
Volume helps strengthen the case.
- Rises on the first bullish candle.
- Dips on the second small-bodied candle.
- Surges on the third bearish candle, showing sellers firmly in control.
Drop Fade: Measure the first candle’s body or use nearby support levels to project a realistic price target downward from the third candle’s close.
How to Trade the Evening Star Pattern (Trading Example)
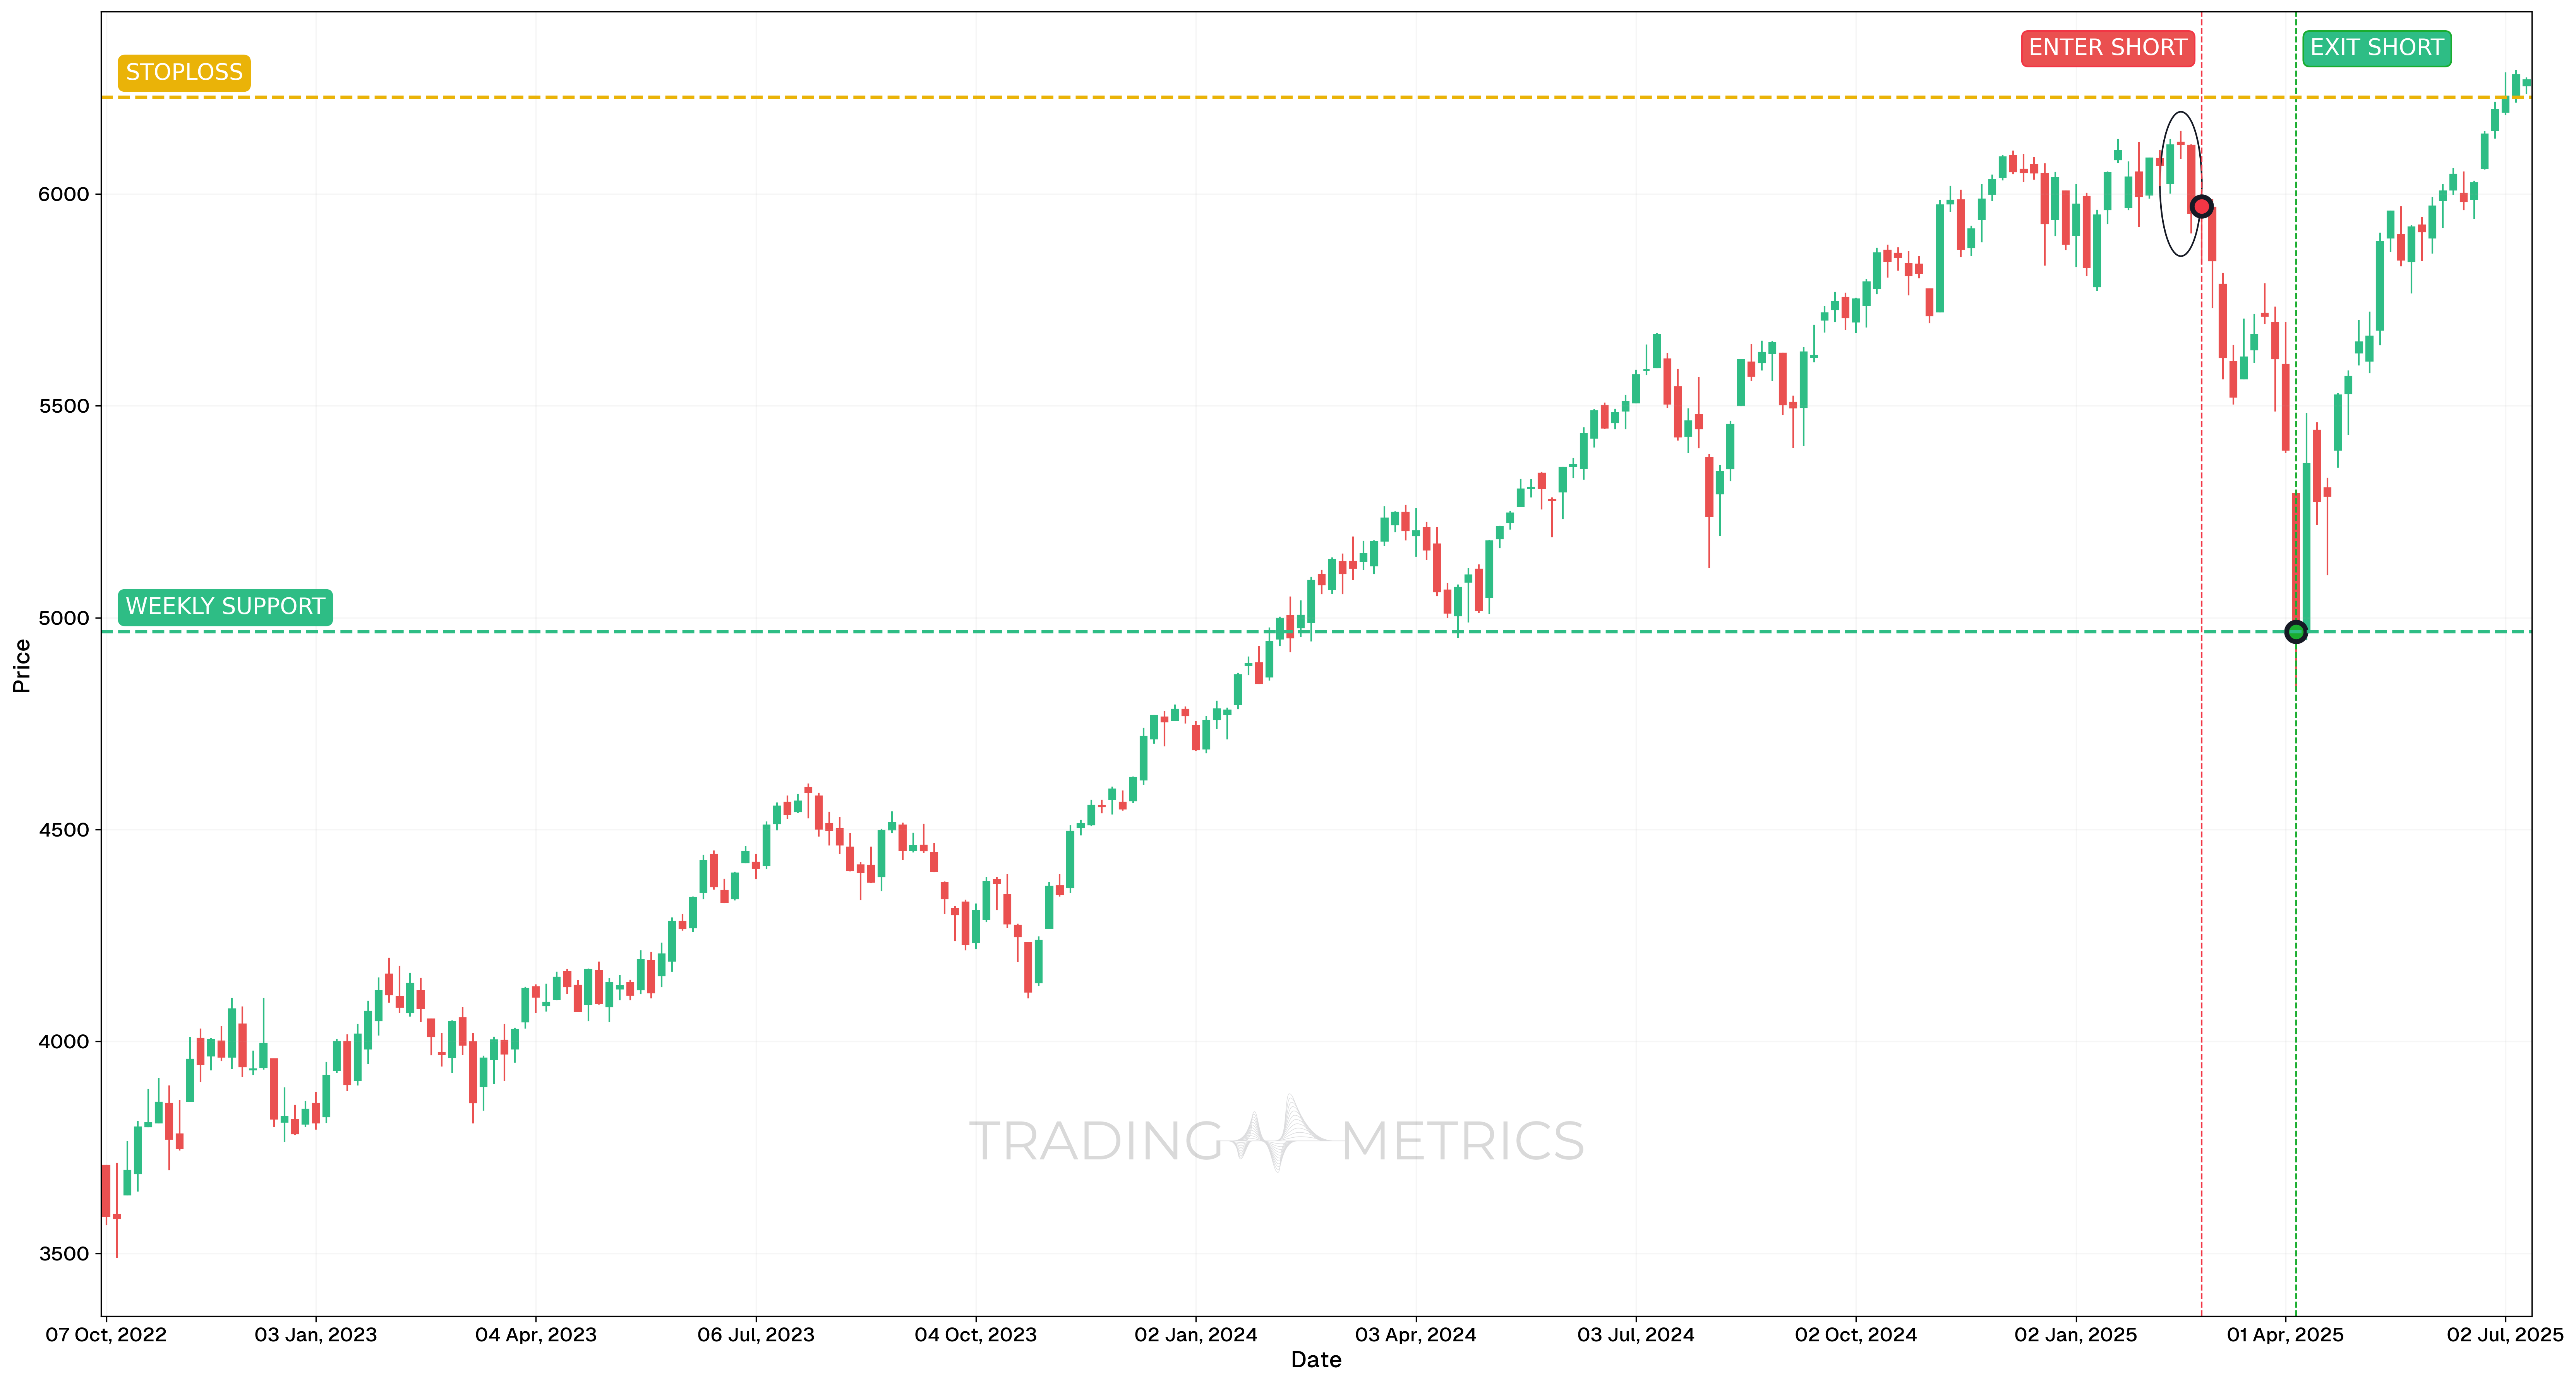
To demonstrate how the Evening Star pattern works in real market conditions, we’ll examine the S&P500 Index on the 3-day chart. This pattern developed after a sustained rally and triggered a strong correction.
Analysis
Between February 28, 2024 and May 1, 2025, the S&P500 Index showed clear signs of exhaustion following a prolonged uptrend. On February 26, 2025, a classic Evening Star pattern formed over three candles, signaling potential bearish reversal. The pattern aligned with momentum weakening, and further confirmation came from key indicators.
Trade Setup
-
Entry: The short position was initiated on February 26, 2025, at $5970.87, following confirmation of the Evening Star setup.
-
Exit: The trade was exited on April 4, 2025, at $4967.24, as price approached a major weekly support level. The index stalled at this zone, making it a logical place to secure profits.
Risk Management
- Stop-Loss placement: The stop-loss was placed at $6228.14, slightly above the high of the Evening Star formation to avoid premature exit due to noise.
- Risk-Reward Ratio: 1:3.90 This indicates the potential reward was 3.90 times greater than the risk taken on the trade. With an entry at $5970.87, a stop-loss at $6228.14, and a target at $4967.24, the setup offered a high-probability reversal opportunity with strong downside potential. Such a high ratio is ideal for swing traders or position traders aiming for asymmetric trades, where even a lower win rate can lead to consistent long-term profitability.
- Position sizing: Position size was calculated based on a 2% capital risk model, ensuring that even with a larger stop range, the account remained protected.
- Volatility Consideration: The market showed a decrease in bullish volatility during the pattern formation and an increase in bearish momentum afterward, validating the short setup.
Volume Night: A volume spike on the third candle dims the pattern into a bearish plunge, locking in the reversal’s strength.
Pre-Trade Checklist
Dim the Proof: Pair the pattern with volume surges and indicators like RSI to dodge fakes and boost your odds.
Key Points
- Star Clarity: A long first candle, small second, and deep third boost reliability - shallow moves dilute it.
- Time Frame: Shines deepest on daily or weekly charts after uptrends.
- Combine with Indicators: Use moving averages or RSI to confirm the reversal.
- Breakout Confirmation: A close below the first candle’s midpoint sets the turn - third candle strength is key.
- Price Target: Measure the first candle’s body or use support levels for a target below the close.
- Risk Management: Set a stop-loss above the second candle’s high to limit losses if it fails.
Wait for the Night: Acting before the third candle confirms risks a star trap - let the reversal darken.
Conclusion
The Evening Star pattern is a trader’s celestial tool for catching bearish reversals. Its twilight trio, paired with volume, RSI, and moving averages, can fade into big gains. Whether in crypto, stocks, or forex, this pattern sharpens your edge. Stay vigilant, manage your risk, and let the Evening Star dim - that fading light could plunge into a winning trade.
Frequently Asked Questions
Quick answers based on this page's topic.
The Evening Star is a three-candle sequence: a strong bullish move, a small-bodied 'star' of indecision, and a large bearish candle. This transition from strength to stalemate to rejection provides a complete 'story' of a trend reaching exhaustion and finally breaking down.
The star represents the 'turning point.' Its small body indicates that the previous buying pressure has been matched by selling supply. This 1:1 equilibrium at the top of a trend creates the necessary conditions for the third bearish candle to take control.
Traders typically target the next major area of market structure, such as the most recent swing low or a key Fibonacci retracement level. Because the Evening Star often marks a major cycle top, it can signal the start of a prolonged downtrend.