Volume Weighted Moving Average (VWMA): Where Volume Meets Price
The Volume Weighted Moving Average (VWMA) is a type of moving average that, unlike the Simple Moving Average (SMA), considers the volume of each trading period when calculating the average price. In simpler terms, VWMA gives more weight to price data points where there was higher trading volume, making it a more responsive and dynamic tool than the traditional moving average.
Price shows you the path but VWMA shows you how strong the footsteps are.
- Anonymous
How to Use the Volume Weighted Moving Average (VWMA)?
Traders use VWMA to identify the underlying trends in price movement, with a focus on where the majority of trading activity is happening. Here’s how:
- Identifying Trends: If the price is above the VWMA, it signals a bullish trend, indicating that the market sentiment is strong. Conversely, if the price is below the VWMA, it suggests a bearish trend.
- Spotting Reversals: When the price crosses the VWMA from above or below, it could signal a potential reversal. For example, if a stock’s price drops below the VWMA after a period of staying above it, it might be time to consider a short position or exit a long position.
- Confirming Entry and Exit Points: VWMA can be used alongside other indicators to confirm buy or sell signals. For instance, if the price crosses above the VWMA and this move is accompanied by a significant increase in volume, it can be a strong signal to enter a trade.
Weighted by Volume: VWMA gives more importance to price movements with higher volume, offering a more accurate reflection of market activity.
How to Calculate the Volume Weighted Moving Average (VWMA)?
The Volume Weighted Moving Average (VWMA) is calculated by weighting prices based on trading volume, making it more responsive to periods with higher activity. Here’s how to calculate the VWMA:
Formula:
Where:
- n: Number of periods.
- Price₁: Price of the asset at period ( i ) (commonly the closing price).
- Volume₁: Trading volume during period ( i ).
Importance of the VWMA in Trading
The VWMA is particularly useful in volatile markets where trading volume can fluctuate significantly. It gives traders a better sense of where the true average price lies by factoring in the volume, thus reducing the noise and providing a clearer signal.
Avoid Low-Volume Noise: VWMA is sensitive to low-volume periods, so confirm signals with additional indicators or higher timeframes.
Optimal Period Values for VWMA
Choosing the right period for the Volume-Weighted Moving Average (VWMA) is essential for aligning the indicator with your trading style. Whether you’re an intraday trader, swing trader, or long-term investor, understanding optimal period values ensures better anticipation of market movements and more informed decisions.
Short-Term Trading: 5-15 Periods
- Best for intraday traders aiming to capitalize on quick price movements.
- Tracks recent price actions and volume changes with high sensitivity.
- Ideal for spotting short-lived opportunities in fast-moving markets.
Medium-Term Trading: 20-50 Periods
- Designed for swing traders holding positions for several days or weeks.
- Balances responsiveness with trend stability, reducing short-term noise.
- Perfect for riding emerging trends and identifying momentum-driven setups.
Long-Term Trading: 50-200 Periods
- Tailored for long-term investors focusing on sustained trends.
- Smooths out short-term volatility, revealing broader market directions.
- Effective for aligning with significant, long-term market movements.
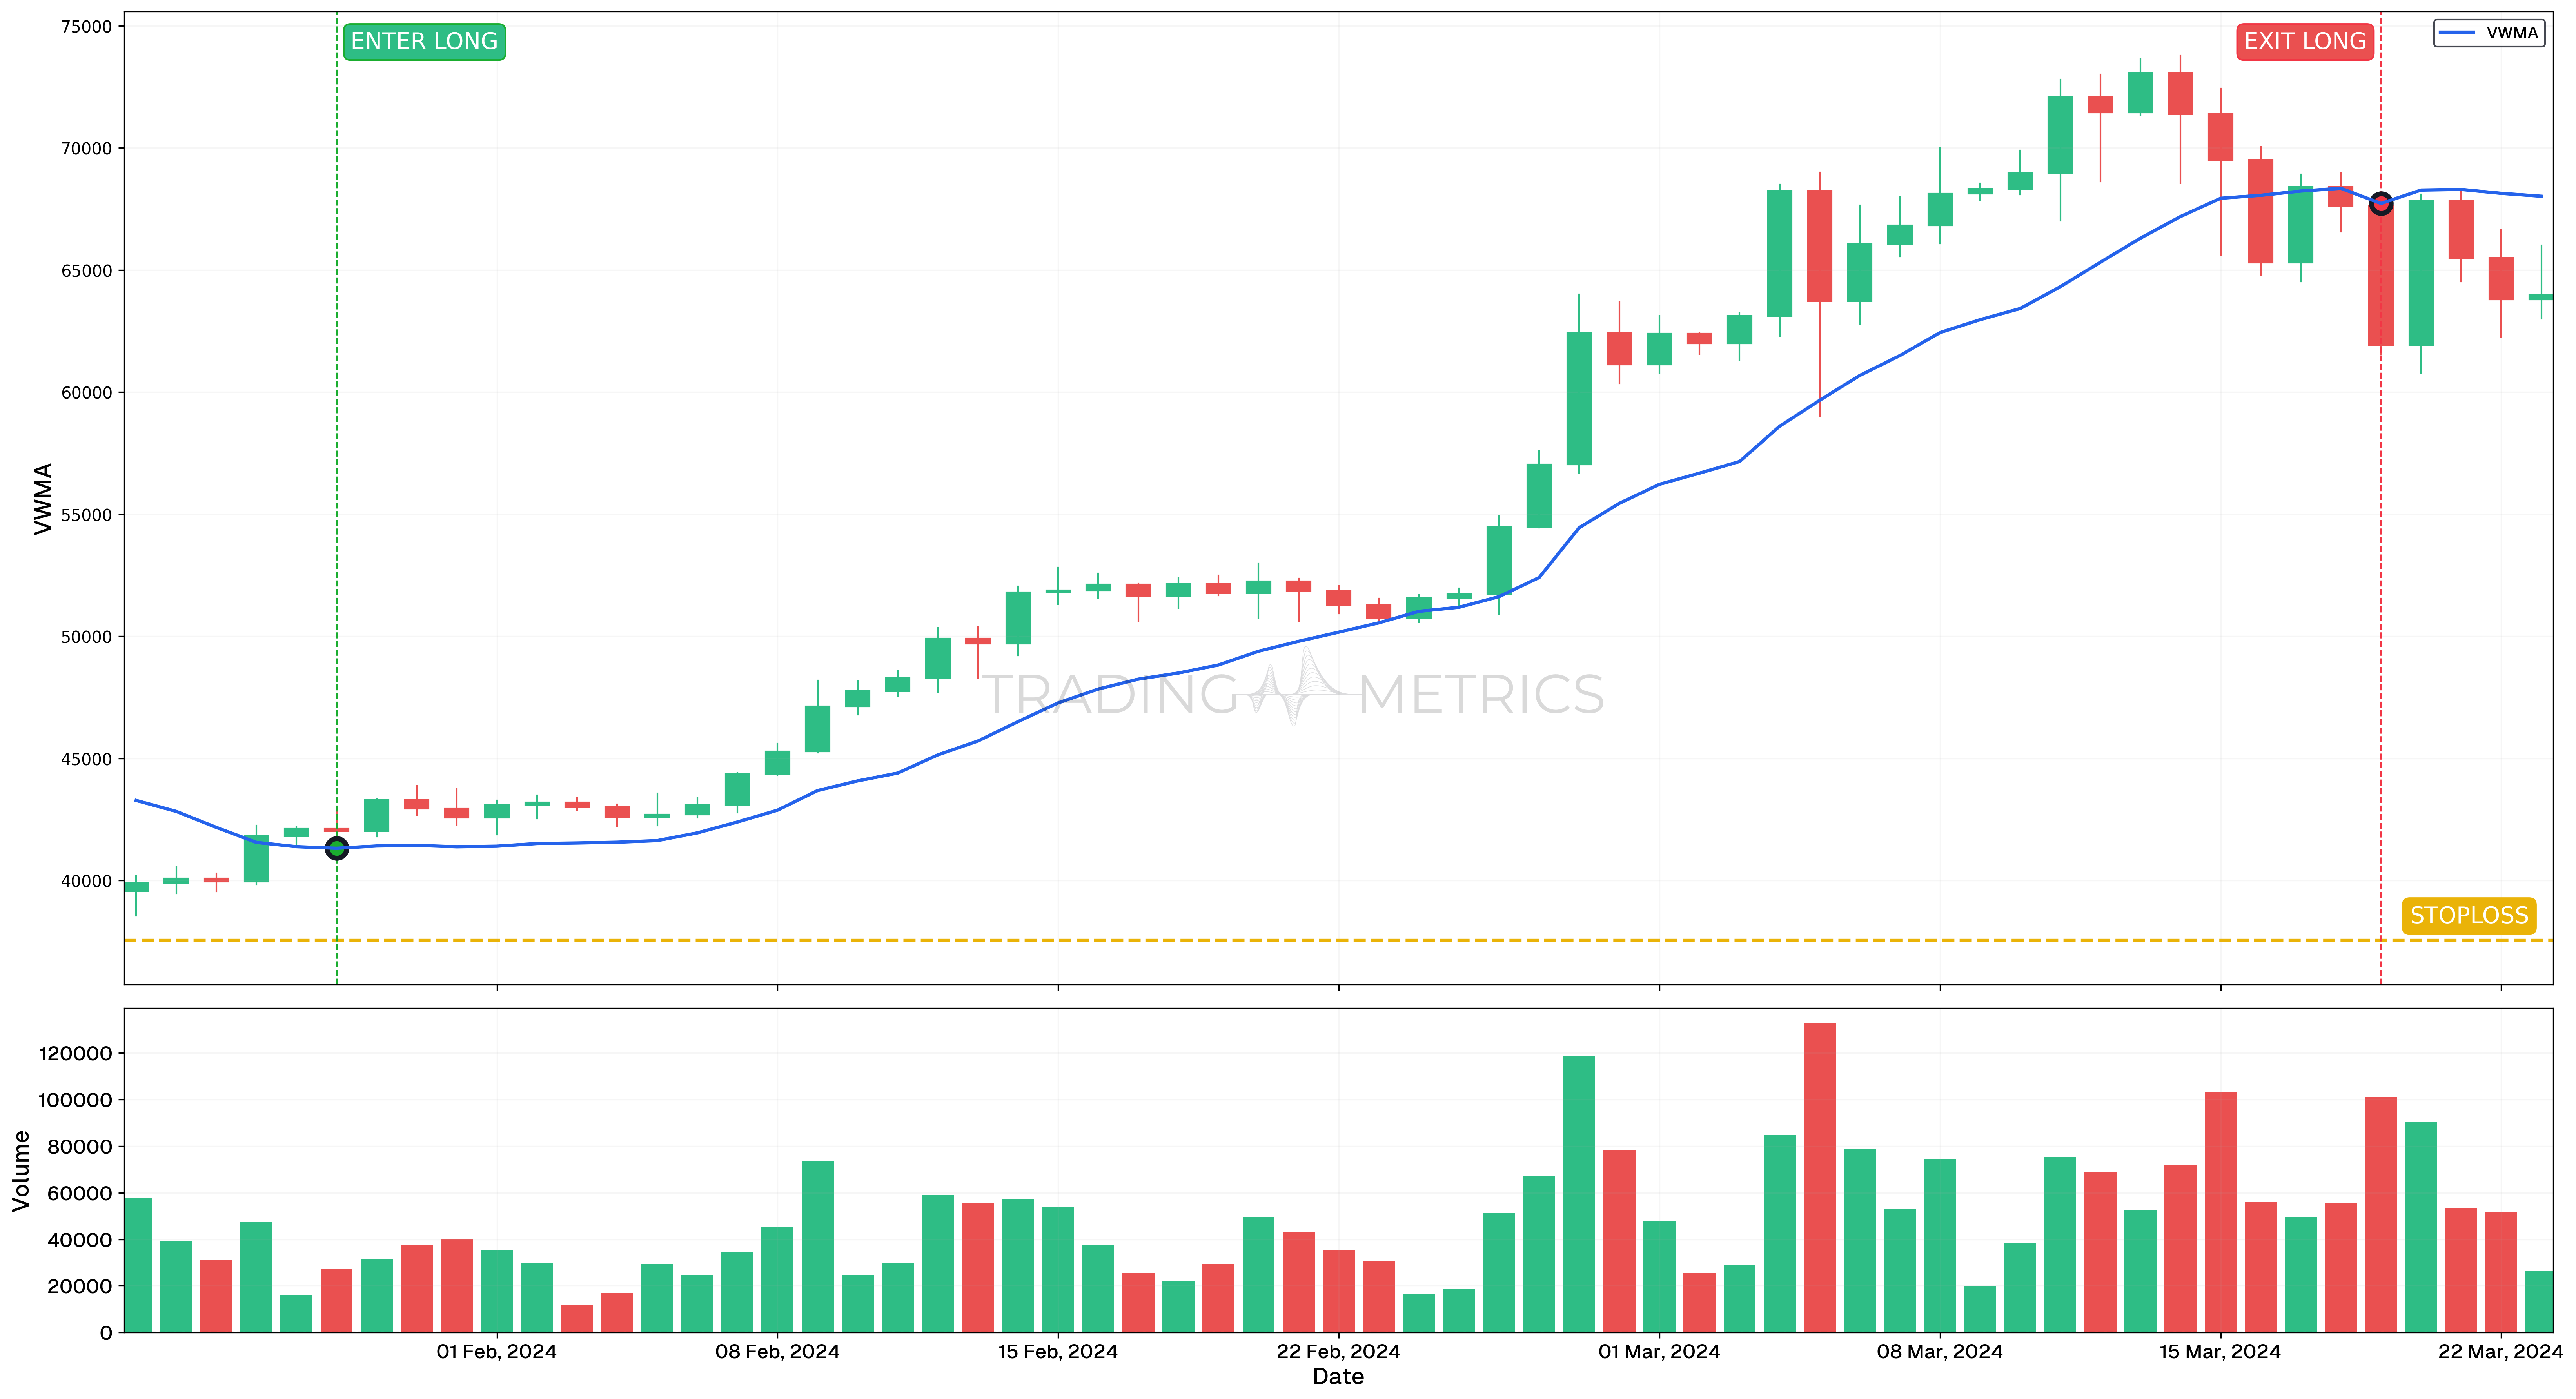
Bullish trend confirmation
This chart illustrates the use of the VWMA indicator for confirming bullish trends. The VWMA is an essential tool that helps traders make informed buy and sell decisions based on the relationship between the indicator and the candlesticks.
Analysis
- Buy Signal: A long position entry is triggered when the VWMA falls below the entire candlestick, including the low. This indicates potential upward price movement. On January 28, 2024, this condition was met, signaling an opportunity to enter a long trade.
- Sell Signal: A long position exit or short position entry is triggered when the VWMA rises above the entire candlestick, including the high. This suggests potential downward price movement. On March 19, 2024, this condition was met, signaling an opportunity to exit a long position or enter a short trade.
Trade Setup
- Entry: Long position initiated on January 28, 2024, as the VWMA fell below the candlestick, signaling a likely increase in market price.
- Exit: Position closed on March 19, 2024, when the VWMA rose above the candlestick, signaling potential downward movement.
- Outcome: This setup demonstrates how the VWMA can provide clear entry and exit points based on its relationship to price action.
Risk Management
- Stop-Loss Placement: The stop-loss was strategically placed at $37,550, aligning with a significant support/resistance zone identified in prior price action. This level was selected to provide a protective buffer against unexpected price reversals while maintaining controlled risk exposure.
- Position sizing: The position size was calculated to cap risk exposure at 2% of total trading capital, adhering to risk management best practices and maintaining consistency in risk control.
- Risk-Reward Analysis: The trade setup maintained a 1:7 Risk-Reward Ratio, optimizing potential profit relative to the defined risk, particularly given the bullish trend confirmation by the VWMA.
- Managing Volatility: With VWMA trends, increased volatility can lead to rapid price changes. Monitoring VWMA positioning relative to candlestick structure and adjusting the stop-loss as necessary can help mitigate potential losses.
- Exit Strategy: Implementing a phased exit strategy as the price approaches key resistance levels can lock in gains while maintaining exposure for potential continued upward movement, especially if VWMA continues to confirm the bullish trend.
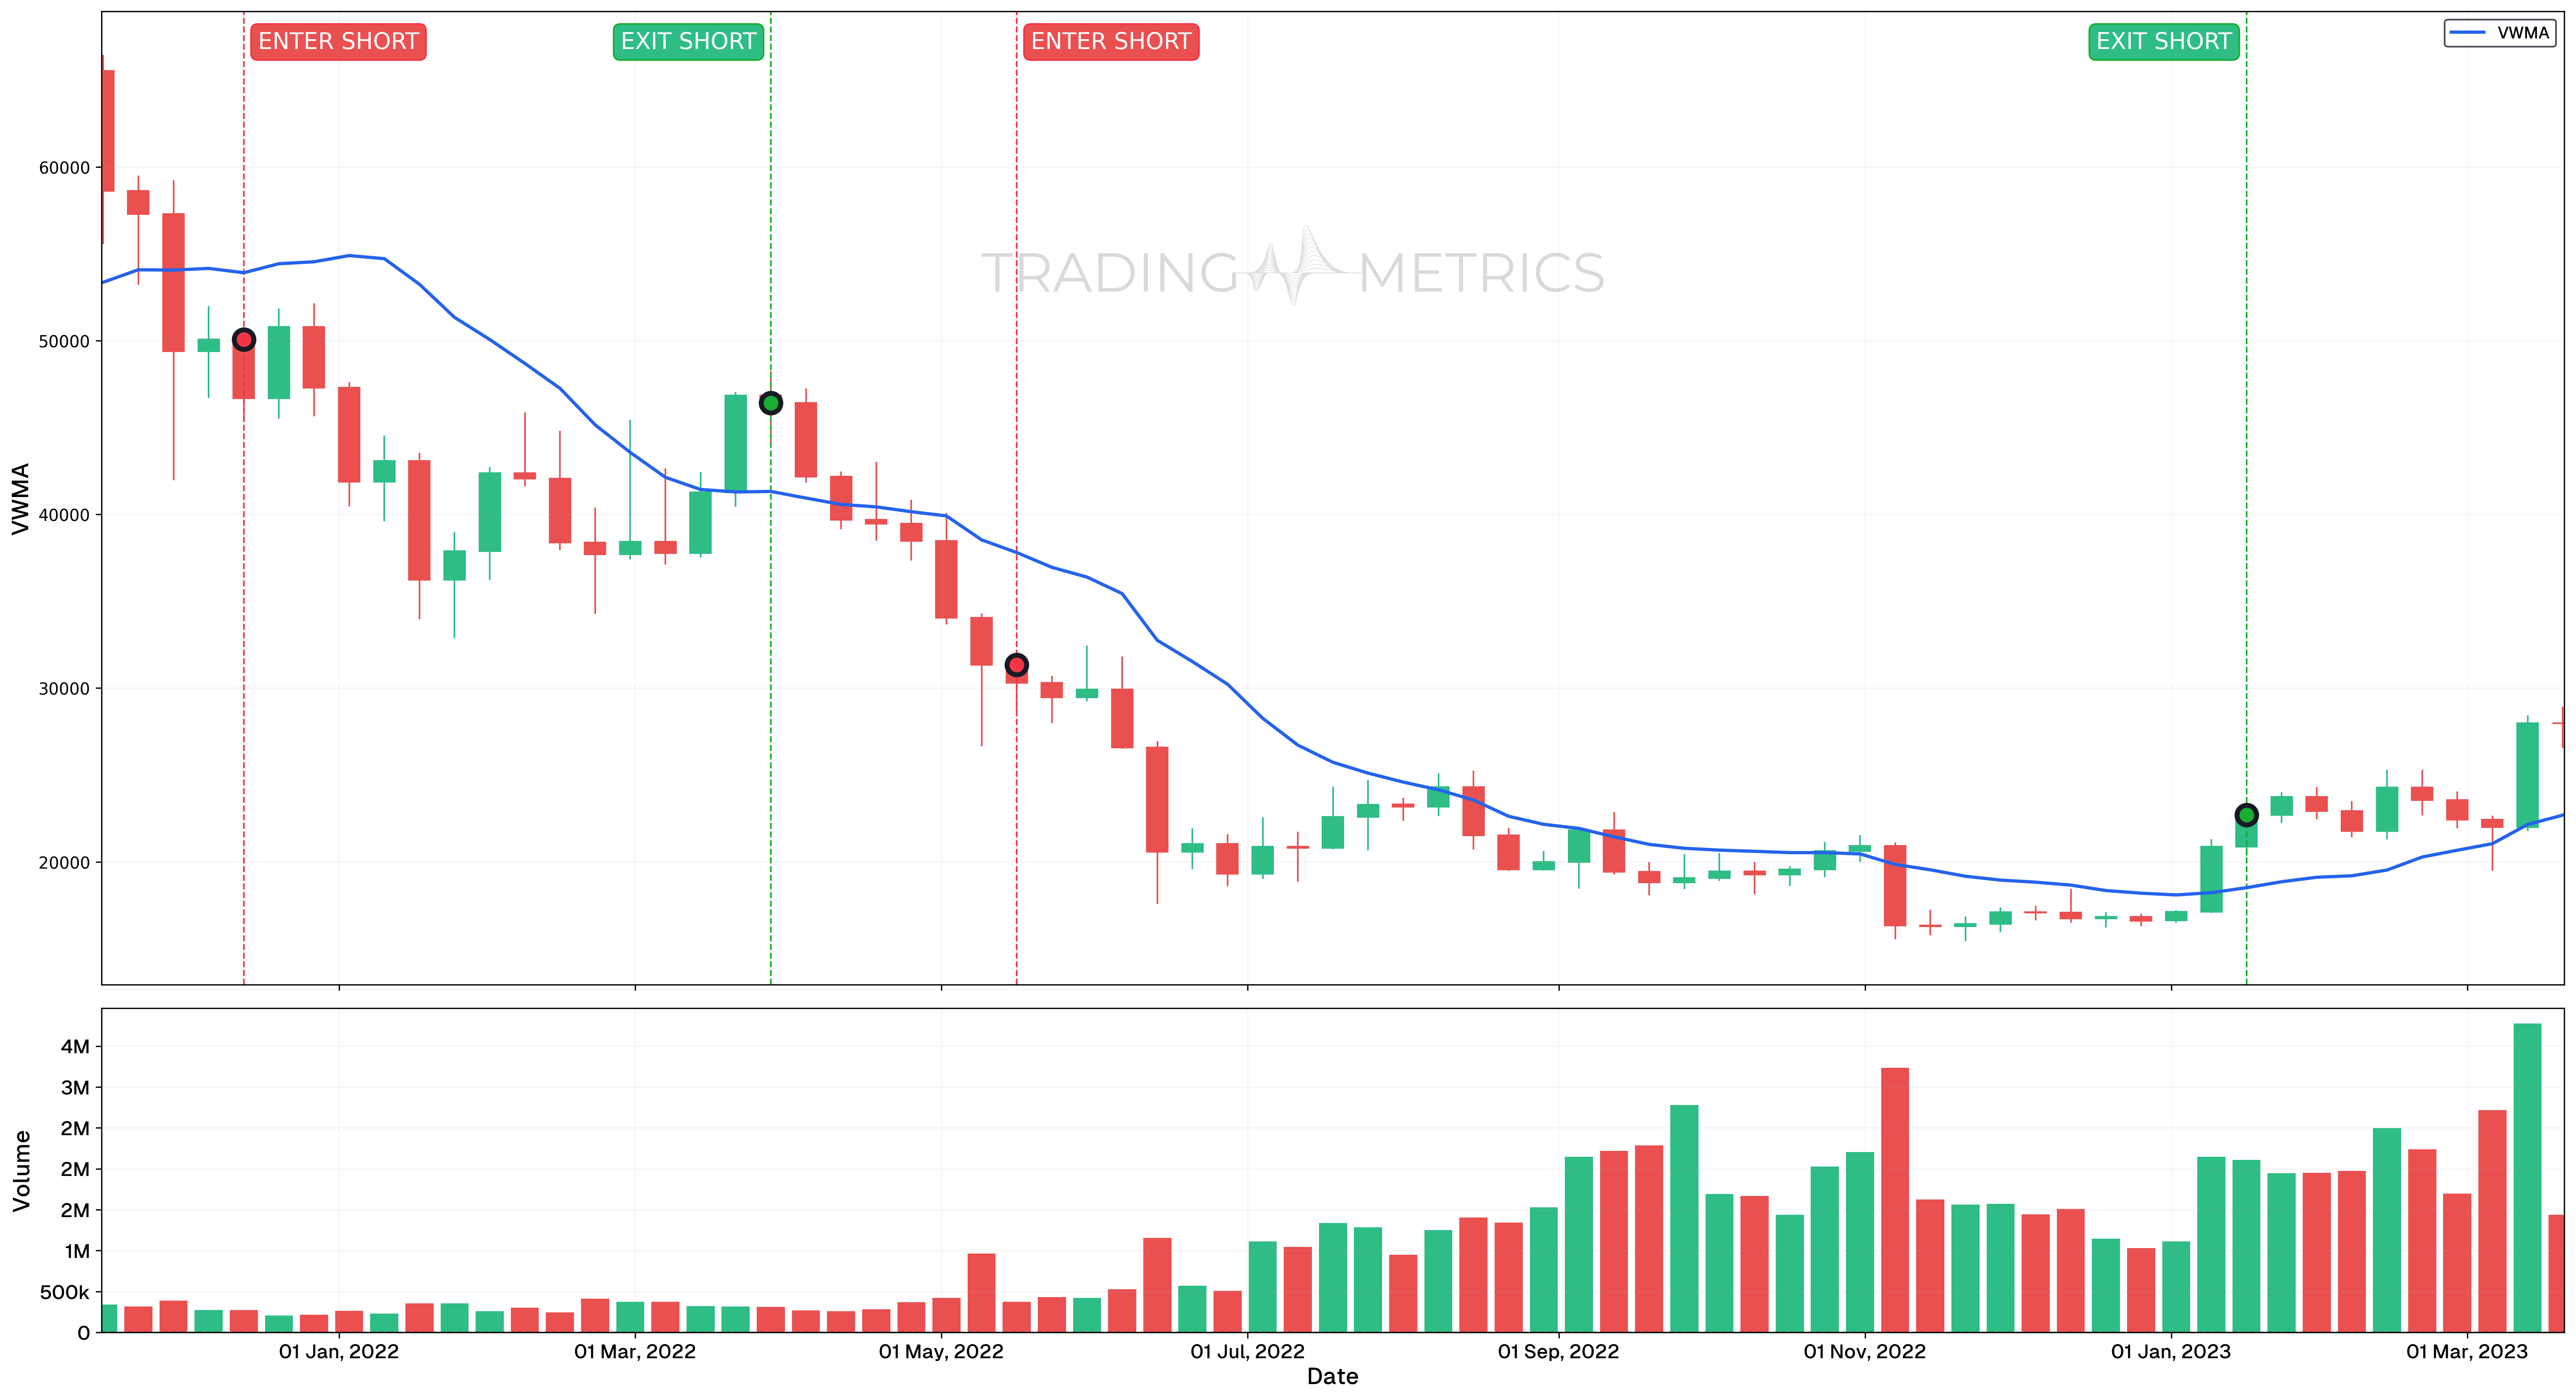
Bearish trend confirmation
The Volume Weighted Moving Average (VWMA) is a valuable indicator for confirming bearish trends and identifying potential shorting opportunities. This chart demonstrates how the VWMA can be used to effectively time entries and exits for short trades.
Analysis
- Entry Signal: A short position entry is triggered when the VWMA rises above the entire candlestick, including the high. On December 13, 2021, this condition was met, signaling a potential downward price movement and providing an opportunity to enter a short trade.
- Exit Signal: A short position exit is indicated when the VWMA falls below the entire candlestick, including the low. This occurred on March 28, 2022, suggesting the end of the downward trend and an ideal exit point.
Trade Setups
-
Trade
- Entry: Short position initiated on December 13, 2021, when the VWMA rose above the candlestick.
- Exit: Position closed on March 28, 2022, as the VWMA moved below the candlestick.
- Outcome: This trade resulted in a price drop of -7.29%, which was favorable for the short position.
-
Trade
- Entry: Short position initiated on May 16, 2022, when the VWMA rose above the candlestick.
- Exit: Position closed on January 16, 2023, as the VWMA moved below the candlestick.
- Outcome: This trade achieved a significant price drop of -33.37%, reflecting a strong bearish trend.
Risk Management
- Stop-Loss Placement: The stop-loss placement in this bearish VWMA setup should be aligned with significant support/resistance zones or Fibonacci Retracement levels, allowing for flexibility based on market context and the VWMA’s interaction with candlestick highs and lows.
- Position sizing: Position size should be determined to limit risk exposure to 2% of total trading capital, ensuring consistency in risk management across both short trades in the example.
- Managing Volatility: Given the nature of VWMA trend reversals, volatility can intensify during retracement phases. Traders should monitor the VWMA’s positioning relative to price action and adjust the stop-loss if significant reversals or consolidations are detected.
- Exit Strategy: Implementing a multi-phased exit strategy can be effective in locking in profits as price approaches significant support levels, while maintaining partial exposure to capture extended bearish momentum if VWMA continues to align with the trend.
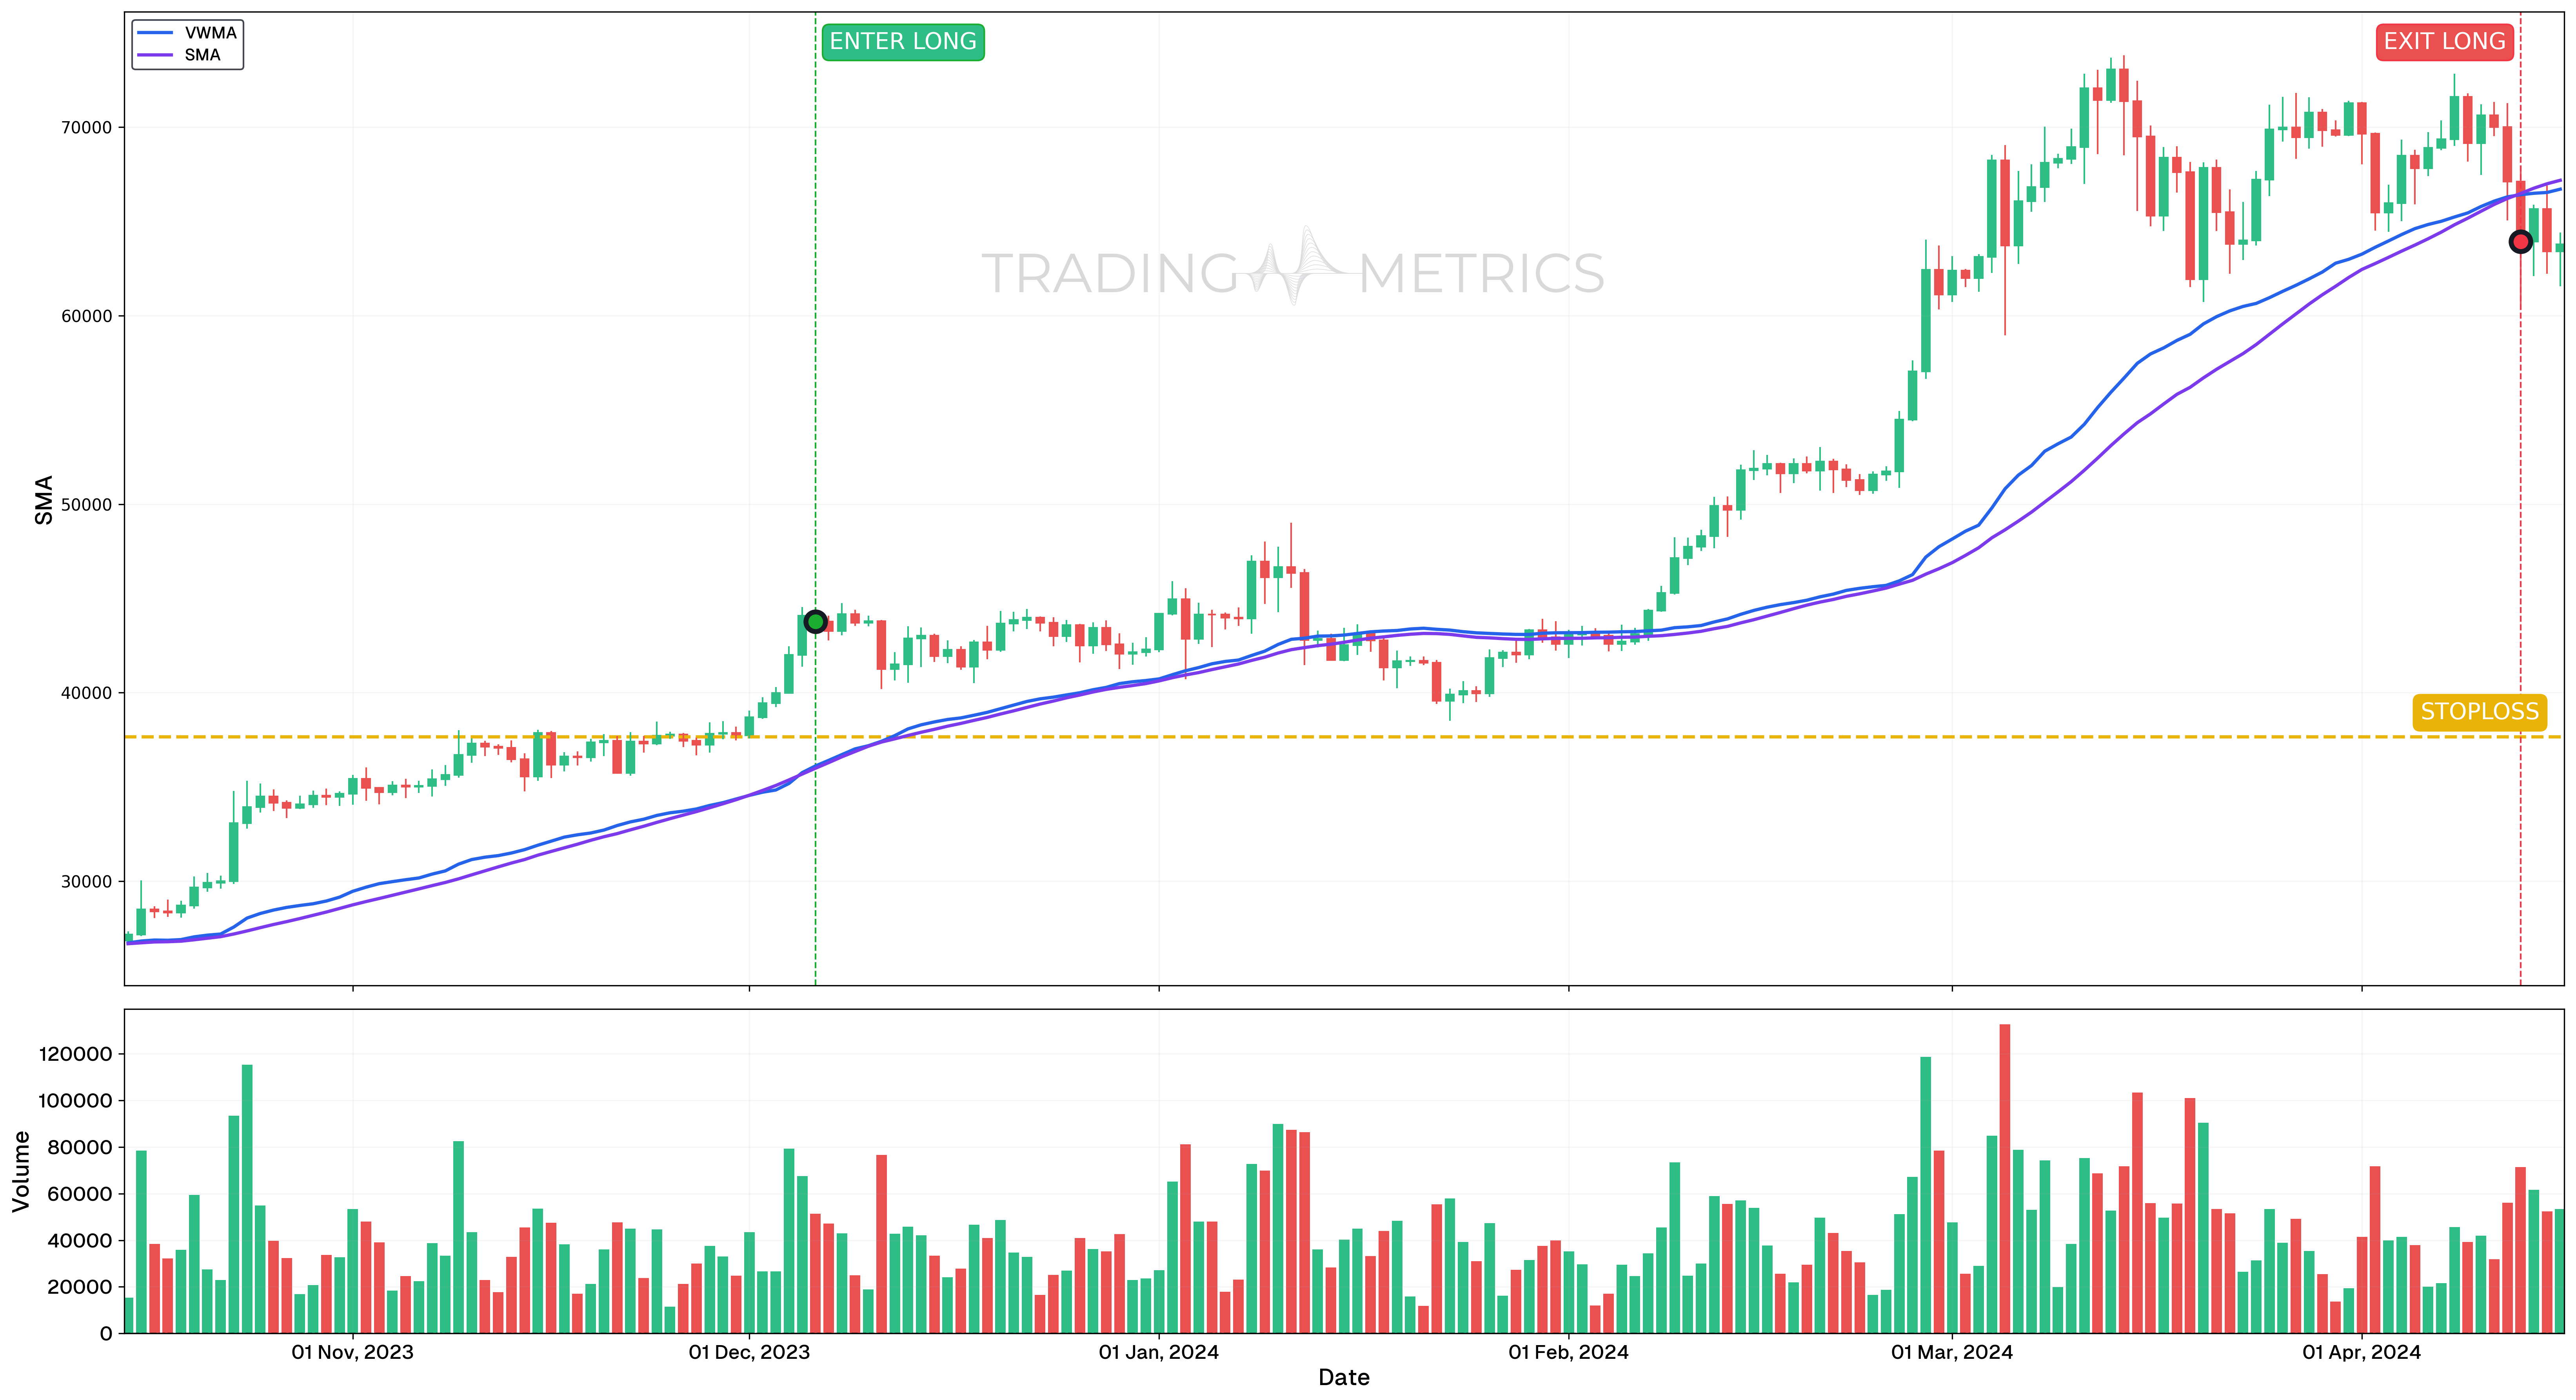
VWMA Uptrend Crossing
The VWMA/SMA Crossing on BTC Daily Chart highlights two key moments where the Volume Weighted Moving Average (VWMA) and Simple Moving Average (SMA) lines generated important buy and sell signals.
Analysis
- Buy Signal on December 6, 2023: A bullish crossover occurred when the VWMA(50) crossed above the SMA(50), marked by a green vertical line. This signal indicated that price momentum, weighted by trading volume, was increasing faster than the simple price average. Following this crossover, Bitcoin experienced a rally, with the price increasing by 45.04% in the subsequent period.
- Sell Signal on April 13, 2024: A bearish crossover, marked by a red vertical line, occurred when the VWMA(50) dropped below the SMA(50). This signaled weakening volume-weighted price momentum relative to the simple price average, prompting traders to consider selling or taking profits. The price declined shortly after this signal.
Trade Setup
- Entry: The bullish crossover on December 6, 2023, provided a clear Long Position Entry Signal, as the VWMA(50) rising above the SMA(50) indicated strengthening momentum.
- Exit: The bearish crossover on April 13, 2024, served as a reliable Long Position Exit Signal, suggesting a potential market downturn and an opportunity to lock in profits.
- Outcome: Between the buy signal on December 6, 2023, and the sell signal on April 13, 2024, the price increased by 45.04%, demonstrating the effectiveness of the VWMA/SMA crossover strategy.
Risk Management
- Stop-Loss Placement: The stop-loss for the VWMA/SMA crossover setup is set at $37,643, aligning with a previous support and resistance zone. This level serves as a protective barrier against unexpected market reversals while allowing sufficient room for the trade to develop.
- Position sizing: Limit risk exposure to 2% of the trading capital, maintaining a consistent risk management approach regardless of the setup. Calculate position size based on the distance between the entry point and the predefined stop-loss.
- Risk-Reward Analysis: Aim for a minimum 1:3.09 Risk-Reward Ratio, aligning with the VWMA/SMA crossover strategy’s potential to capture significant uptrend movements while maintaining controlled risk.
- Monitoring Market Conditions: The VWMA and SMA can both act as dynamic support and resistance levels. Traders should remain vigilant for potential false breakouts or trend reversals, especially during high-volume periods or volatile market conditions.
- Adjusting Stop-loss: If the price action continues to respect the VWMA and SMA as support levels, consider trailing the stop-loss to lock in profits while still allowing the trade to potentially capture further gains.
Scaling Positions: Use VWMA to scale into positions during pullbacks, ensuring you align with the dominant trend.
Combining VWMA with Other Tools
VWMA works well when combined with other technical indicators to give a more comprehensive view of the market:
- VWMA and Relative Strength Index (RSI): RSI measures the change and speed of price movements. Combining it with VWMA can help you confirm overbought or oversold conditions. For example, if RSI shows an overbought condition and the price is also above the VWMA, it might be a strong signal to prepare for a pullback.
- VWMA and Bollinger Bands: Bollinger Bands can help identify volatility, and when combined with VWMA, they can give clearer signals. For example, if the price is near the upper Bollinger Band but below the VWMA, it suggests that the upward move might not be supported by strong volume, signaling caution.
- VWMA and MACD (Moving Average Convergence Divergence): The MACD is a trend-following momentum indicator. When combined with VWMA, it helps confirm trends. For instance, if the MACD line crosses above the signal line while the price is above the VWMA, it can be a strong buy signal.
Dynamic Support and Resistance: VWMA adapts to market activity, acting as a more accurate dynamic support or resistance level compared to standard moving averages.
Key Points
- Volume-Weighted Trend Indicator: The Volume-Weighted Moving Average (VWMA) gives more weight to price movements with higher trading volume, providing a clearer picture of market sentiment.
- Responsive to Volume: Unlike simple or Exponential Moving Averages (EMA), the VWMA emphasizes periods with high trading activity, making it more sensitive to significant price moves.
- Trend Confirmation: Use VWMA to confirm trends:
- Price above the VWMA suggests bullish momentum.
- Price below the VWMA indicates bearish momentum.
- Support and Resistance: The VWMA acts as a dynamic support or resistance level, guiding trade entry and exit decisions.
- Combine with Other Averages: Use VWMA with SMA or EMA to identify crossovers and validate trend signals.
- Volume Analysis: The VWMA highlights periods where price moves are backed by strong volume, adding credibility to trend strength.
- Customizable Periods: Adjust the VWMA calculation period to suit your trading strategy:
- Shorter periods for active trading.
- Longer periods for broader market analysis.
- Effective in Trending Markets: VWMA works best in trending markets where volume plays a significant role in driving price action.
- Market Condition Adaptability: In volatile or range-bound markets, combine VWMA with oscillators like RSI or MACD for better signal accuracy.
- Backtesting and Refinement: Test VWMA strategies in backtesting to evaluate their effectiveness and fine-tune parameters for optimal performance.
Conclusion
The VWMA is a powerful tool for traders who want to understand where the majority of trading activity is happening relative to the price. By factoring in volume, it gives a more accurate picture of market sentiment than traditional moving averages.
Frequently Asked Questions
Quick answers based on this page's topic.
The VWMA gives more mathematical weight to price data from high-volume periods, whereas the SMA treats all periods equally. This ensures the moving average reflects where the most actual trading activity occurred, providing a more accurate representation of true market value.
During a healthy trend, the VWMA should pull away from a standard SMA. If the VWMA is above the SMA in an uptrend, it confirms the rise is supported by high volume; if they converge, it suggests the trend is losing institutional backing.
Yes, because the VWMA accounts for volume, it often acts as a more reliable support level than traditional averages. Large traders often look at volume-weighted levels to enter or exit positions, making the VWMA a natural area for price bounces.