Bullish Harami Cross: A Doji Inside the Storm of a Downtrend
The Bullish Harami Cross pattern is a subtle bullish reversal signal in technical analysis, often appearing during a downtrend. Imagine it as a moment of indecision - a large bearish candle followed by a small doji that’s fully contained within its body - hinting at a stall in selling momentum. When this pattern forms, it’s a quiet whisper that bearish momentum is fading, offering traders a chance to buy or go long as a potential uptrend emerges.
How to Identify the Bullish Harami Cross Pattern in Trading
The Bullish Harami Cross is a bullish reversal candlestick formation. It develops over two candles at the bottom of a downtrend, where a strong bearish move is followed by a doji inside its range. It’s a shift in balance hinting at a turning point. Here’s the step-by-step guide.
Start with the Big Picture
This pattern forms after a downtrend. Sellers look dominant, but the contained doji signals hesitation and weakening pressure.
Trace the Two-Candle Sequence
The structure unfolds in two steps:
- First Candle: A strong bearish candle, showing momentum firmly with the sellers.
- Second Candle: A doji (open and close nearly equal), fully contained within the first candle’s body. This marks indecision and signals a potential reversal.
Zero in on the Confirmation Level
The confirmation level is the high of the first candle. A subsequent close above this level signals that buyers are regaining control.
Watch the Breakout
The bullish trigger comes when a following candle closes above the first candle’s high, confirming the reversal. This is your entry point. (Some traders act earlier, using the doji as the cue with added confirmation.)
Check Volume for Additional Confirmation
Volume patterns often reveal conviction:
- Peaks on the first candle, showing strong selling.
- Drops on the doji, reflecting indecision.
- A surge on the confirming bullish candle strengthens the reversal’s case.
Drop Hint: Measure the height of the first candle or use nearby resistance levels to project a realistic price target upward from the confirmation close.
How to Trade the Bullish Harami Cross Pattern (Trading Example)
To illustrate how the Bullish Harami Cross pattern can be used to enter a trade, we will choose the CAKEUSD pair. This pattern appeared on the daily chart and marked a clear transition from selling pressure to bullish momentum.
Analysis
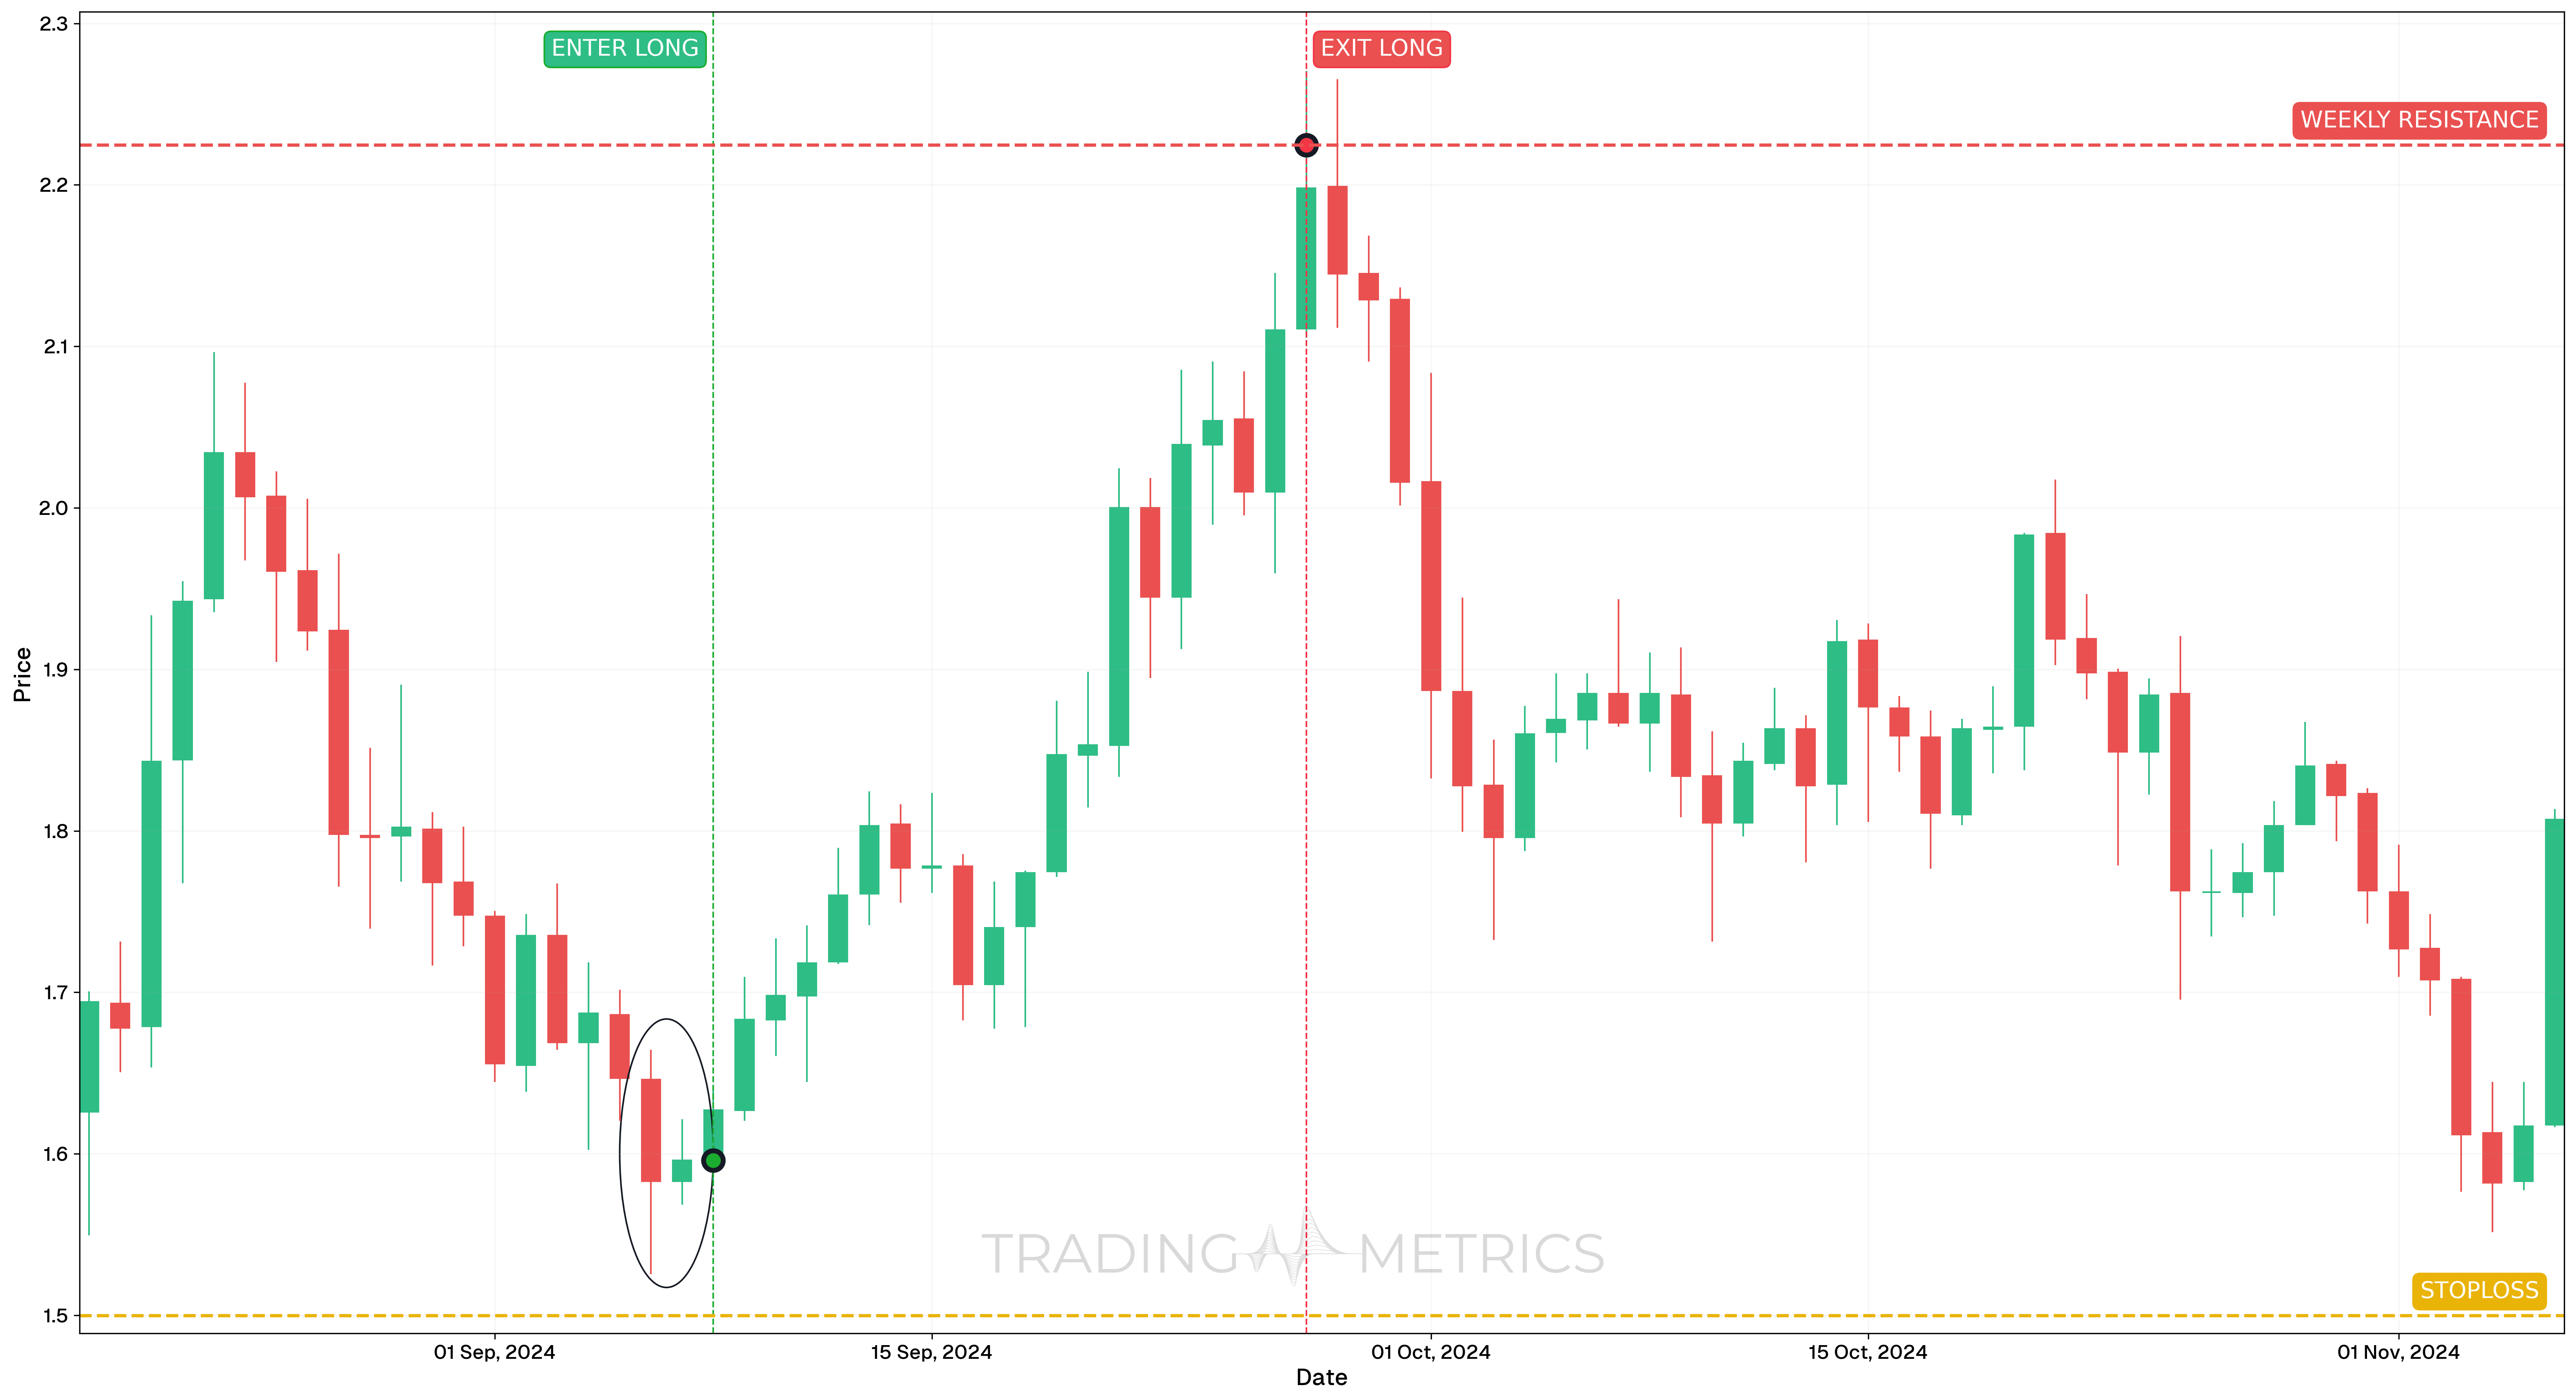
On September 8, 2024, CAKEUSD printed a textbook Bullish Harami Cross pattern. A small-bodied doji appeared after a strong bearish candle, signaling indecision and a potential reversal. This structure formed at the bottom of a local downtrend, improving its reliability.
Trade Setup
-
Entry: The trade was taken on September 8, 2024, at $1.60114, right after the breakout candle confirmed the reversal. Supporting indicators included:
-
Exit: The position was closed on September 27, 2024, at $2.2246, at a key previous support/resistance zone. This level had acted as a strong barrier in past price action and was used to lock in gains.
-
Outcome: The Bullish Harami Cross setup produced a 38.9% gain, effectively capturing the reversal with confirmation from both price action and indicators.
Risk Management
- Stop-Loss placement: The stop-loss was set at $1.4997, just below the low of the bearish candle preceding the doji, which served as the invalidation point for the pattern.
- Position sizing: Based on a 2% capital risk model, the position was sized according to the entry-to-stop range.
- Risk-Reward Ratio: The trade yielded a Risk-Reward Ratio of 1:6.15, showing high trade efficiency with tight risk and a strong trend extension.
- Volatility Consideration: The trade emerged after a contraction in Volatility, giving room for a range expansion once confirmation kicked in.
- Adaptive Exit Strategy: Alternative exit methods could include Fibonacci extensions or trailing stop below higher lows to maximize profit during strong trends.
Volume Cross: A volume spike on the confirming candle strengthens the bullish shift signaled by the pattern.
Pre-Trade Checklist
Cross the Proof: Pair the pattern with volume spikes and indicators like RSI to dodge fakes and boost your odds.
Key Points
- Candle Contrast: A large bearish candle with a tiny doji boosts reliability - mismatched sizes dilute it.
- Time Frame: Hits hardest on daily or weekly charts after downtrends.
- Combine with Indicators: Use moving averages or RSI to confirm the reversal.
- Breakout Confirmation: A close above the first candle’s high confirms the turn - don’t jump on the doji alone.
- Price Target: Measure the first candle height or use resistance levels for a target above the confirmation.
- Risk Management: Set a stop-loss below the first candle’s low to limit losses if it fails.
Wait for the Cross: Acting before confirmation risks a trap - let the reversal firm up.
Conclusion
The Bullish Harami Cross pattern is a trader’s subtle tool for catching bullish reversals. Its two-candle pause, paired with volume, RSI, and moving averages, can spark big upward moves. Whether in crypto, stocks, or forex, this pattern sharpens your edge. Stay patient, manage your risk, and let the cross form - that quiet doji could signal a strong rally.
Frequently Asked Questions
Quick answers based on this page's topic.
The 'Cross' version features a Doji as the second candle. A Doji represents perfect equilibrium and a complete halt to the trend's momentum. When it appears deep inside a previously strong bearish candle, it signals a sudden standoff that often precedes a sharp reversal.
It represents a 'Moment of Silence' at a market bottom. After aggressive selling, the market reaches a price where buyers and sellers are perfectly matched. This 1:1 balance at the lows is a high-probability signal that the 'smart money' has stopped selling and is starting to buy.
The technical stop-loss goes just below the low of the first (bearish) candle. Since the pattern's validity relies on the market's failure to reach new lows, any move below that floor invalidates the bullish thesis and protects your account capital.