Total Return: The Honest Number You Should Be Tracking
Total Return is the complete measure of an investment’s performance. It includes not only the change in the asset’s price but also any income generated from the investment, such as dividends or interest. Think of it as a full picture of how much an investment has earned you over a specific period.
In the short run, the market is a voting machine, but in the long run, it is a weighing machine.
- Benjamin Graham
How to Calculate Total Return?
You can calculate Total Return with a simple formula that includes both price changes and income.
Where:
- Ending Value is the value at the end.
- Starting Value is the value at the start.
- Income is any earnings, like dividends or interest.
This formula shows the total result of an investment.
Focus on the Big Picture: Total return isn’t just about capital gains - don’t forget the power of dividends, interest, and reinvestment. Every little piece adds to the compounding puzzle.
Importance of Total Return in Trading
When analyzing investments in trading, total return serves as a measure for determining an asset’s overall performance. It provides a full picture by accounting for all gains, including price changes and additional income like dividends or interest. This broader perspective helps investors accurately assess profitability and make smarter decisions about where to allocate their funds in the future.
Risk vs. Reward: A Balancing Act: High returns are enticing, but sustainable success in trading lies in optimizing risk-adjusted returns. Trade smart, not just bold.
Trading Examples
By reviewing trading examples, investors and traders can see how market moves affect results. These examples help improve strategies, control risk, and make clearer decisions. Here, we look at three cases: a profit, a loss, and a break-even to show different outcomes.
Profitable Trade
| Metric | Value/Result |
|---|---|
Trade Open Date | 1 Jan, 2023, 12:00 |
Trade Open Price | $16,556.66 |
Trade Close Date | 1 Mar, 2023, 00:00 |
Trade Close Price | $23,739.17 |
Trade Total Return | |
Total Return | 43.38% |
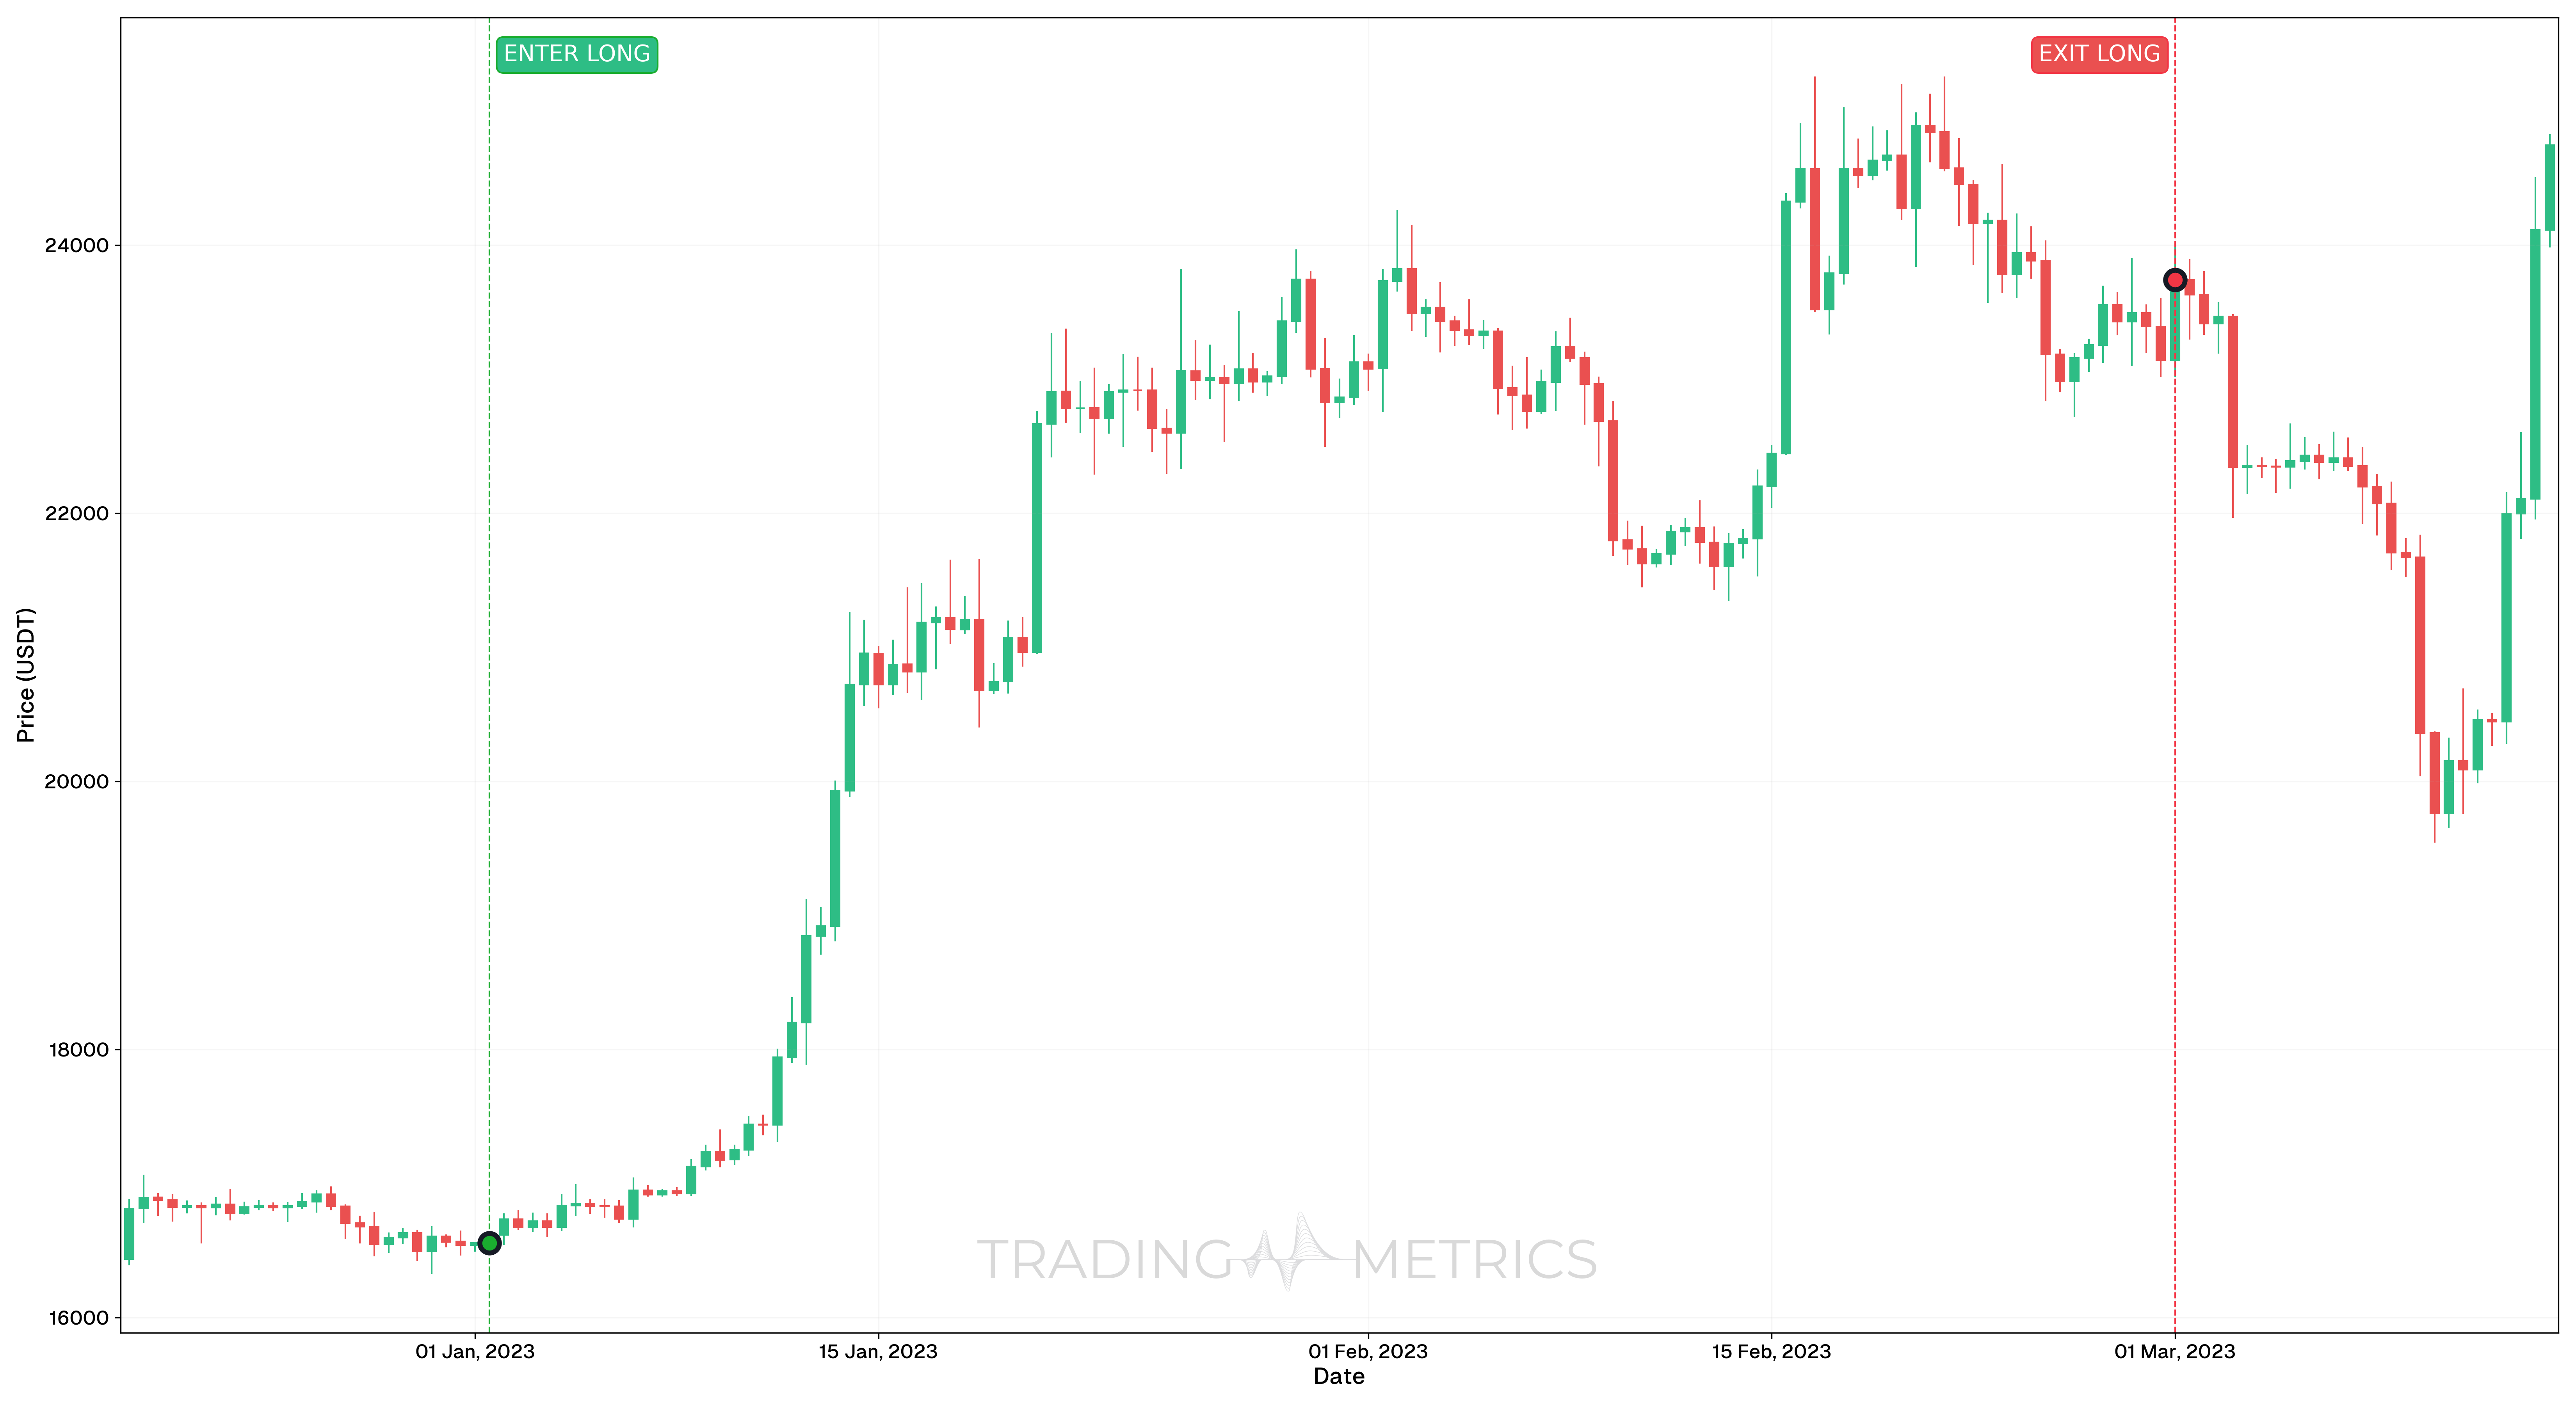
Analysis: This trade was initiated on January 1, 2023, 12:00, with an opening price of $16,556.66 and closed on March 1, 2023, 00:00, at a price of $23,739.17. The trade yielded a significant profit with a total return of 43.38%. This indicates a strong upward trend in Bitcoin’s price during this period, making it a well-timed and profitable trade.
Loss-Making Trade
| Metric | Value/Result |
|---|---|
Trade Open Date | 1 Apr, 2023, 12:00 |
Trade Open Price | $28,372.85 |
Trade Close Date | 1 Jun, 2023, 00:00 |
Trade Close Price | $26,892.96 |
Trade Total Return | |
Total Return | -5.22% |
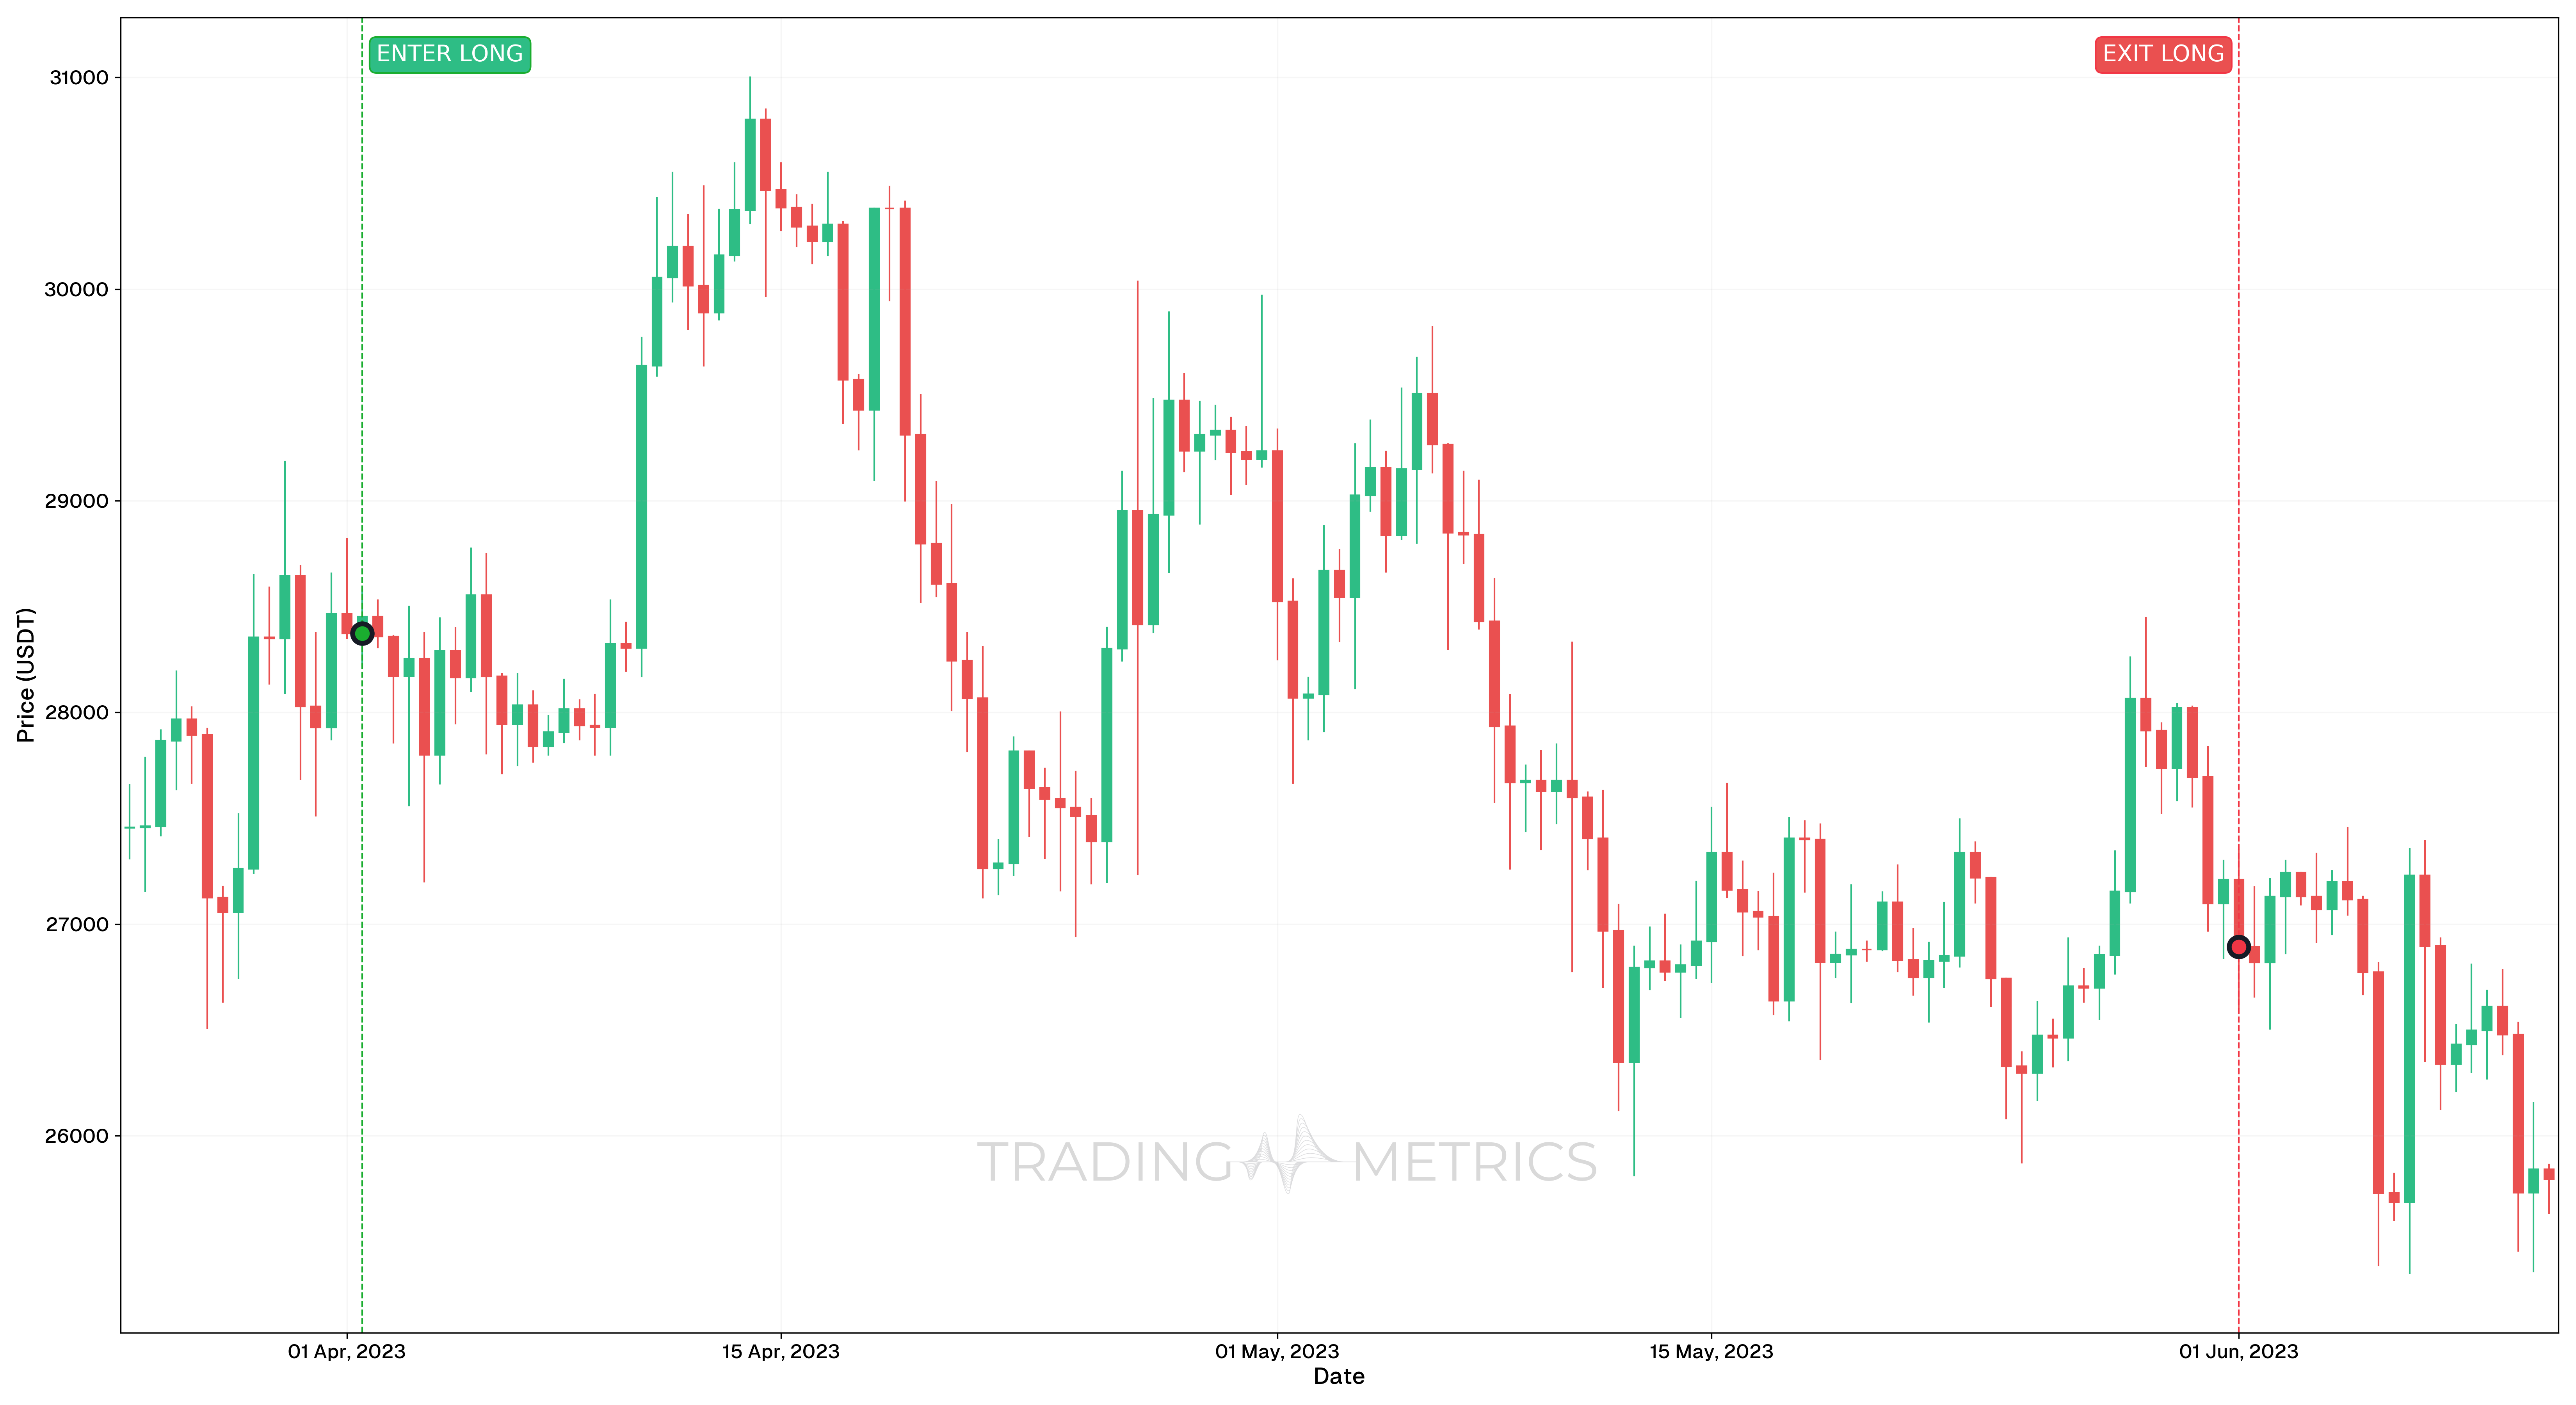
Analysis: This trade was initiated on April 1, 2023, 12:00, with an opening price of $28,372.85 and closed on June 1, 2023, 00:00, at a price of $26,892.96. The trade resulted in a loss with a total return of -5.22%. This indicates a downward trend in Bitcoin’s price during this period, suggesting that the trade was poorly timed or the market conditions turned unfavorable after the trade was initiated.
Break-Even Trade
| Metric | Value/Result |
|---|---|
Trade Open Date | 11 May, 2023, 12:00:00 |
Trade Open Price | $27,405.61 |
Trade Close Date | 17 May, 2023, 12:00:00 |
Trade Close Price | $27,405.61 |
Trade Total Return | |
Total Return (%) | 0.00% |
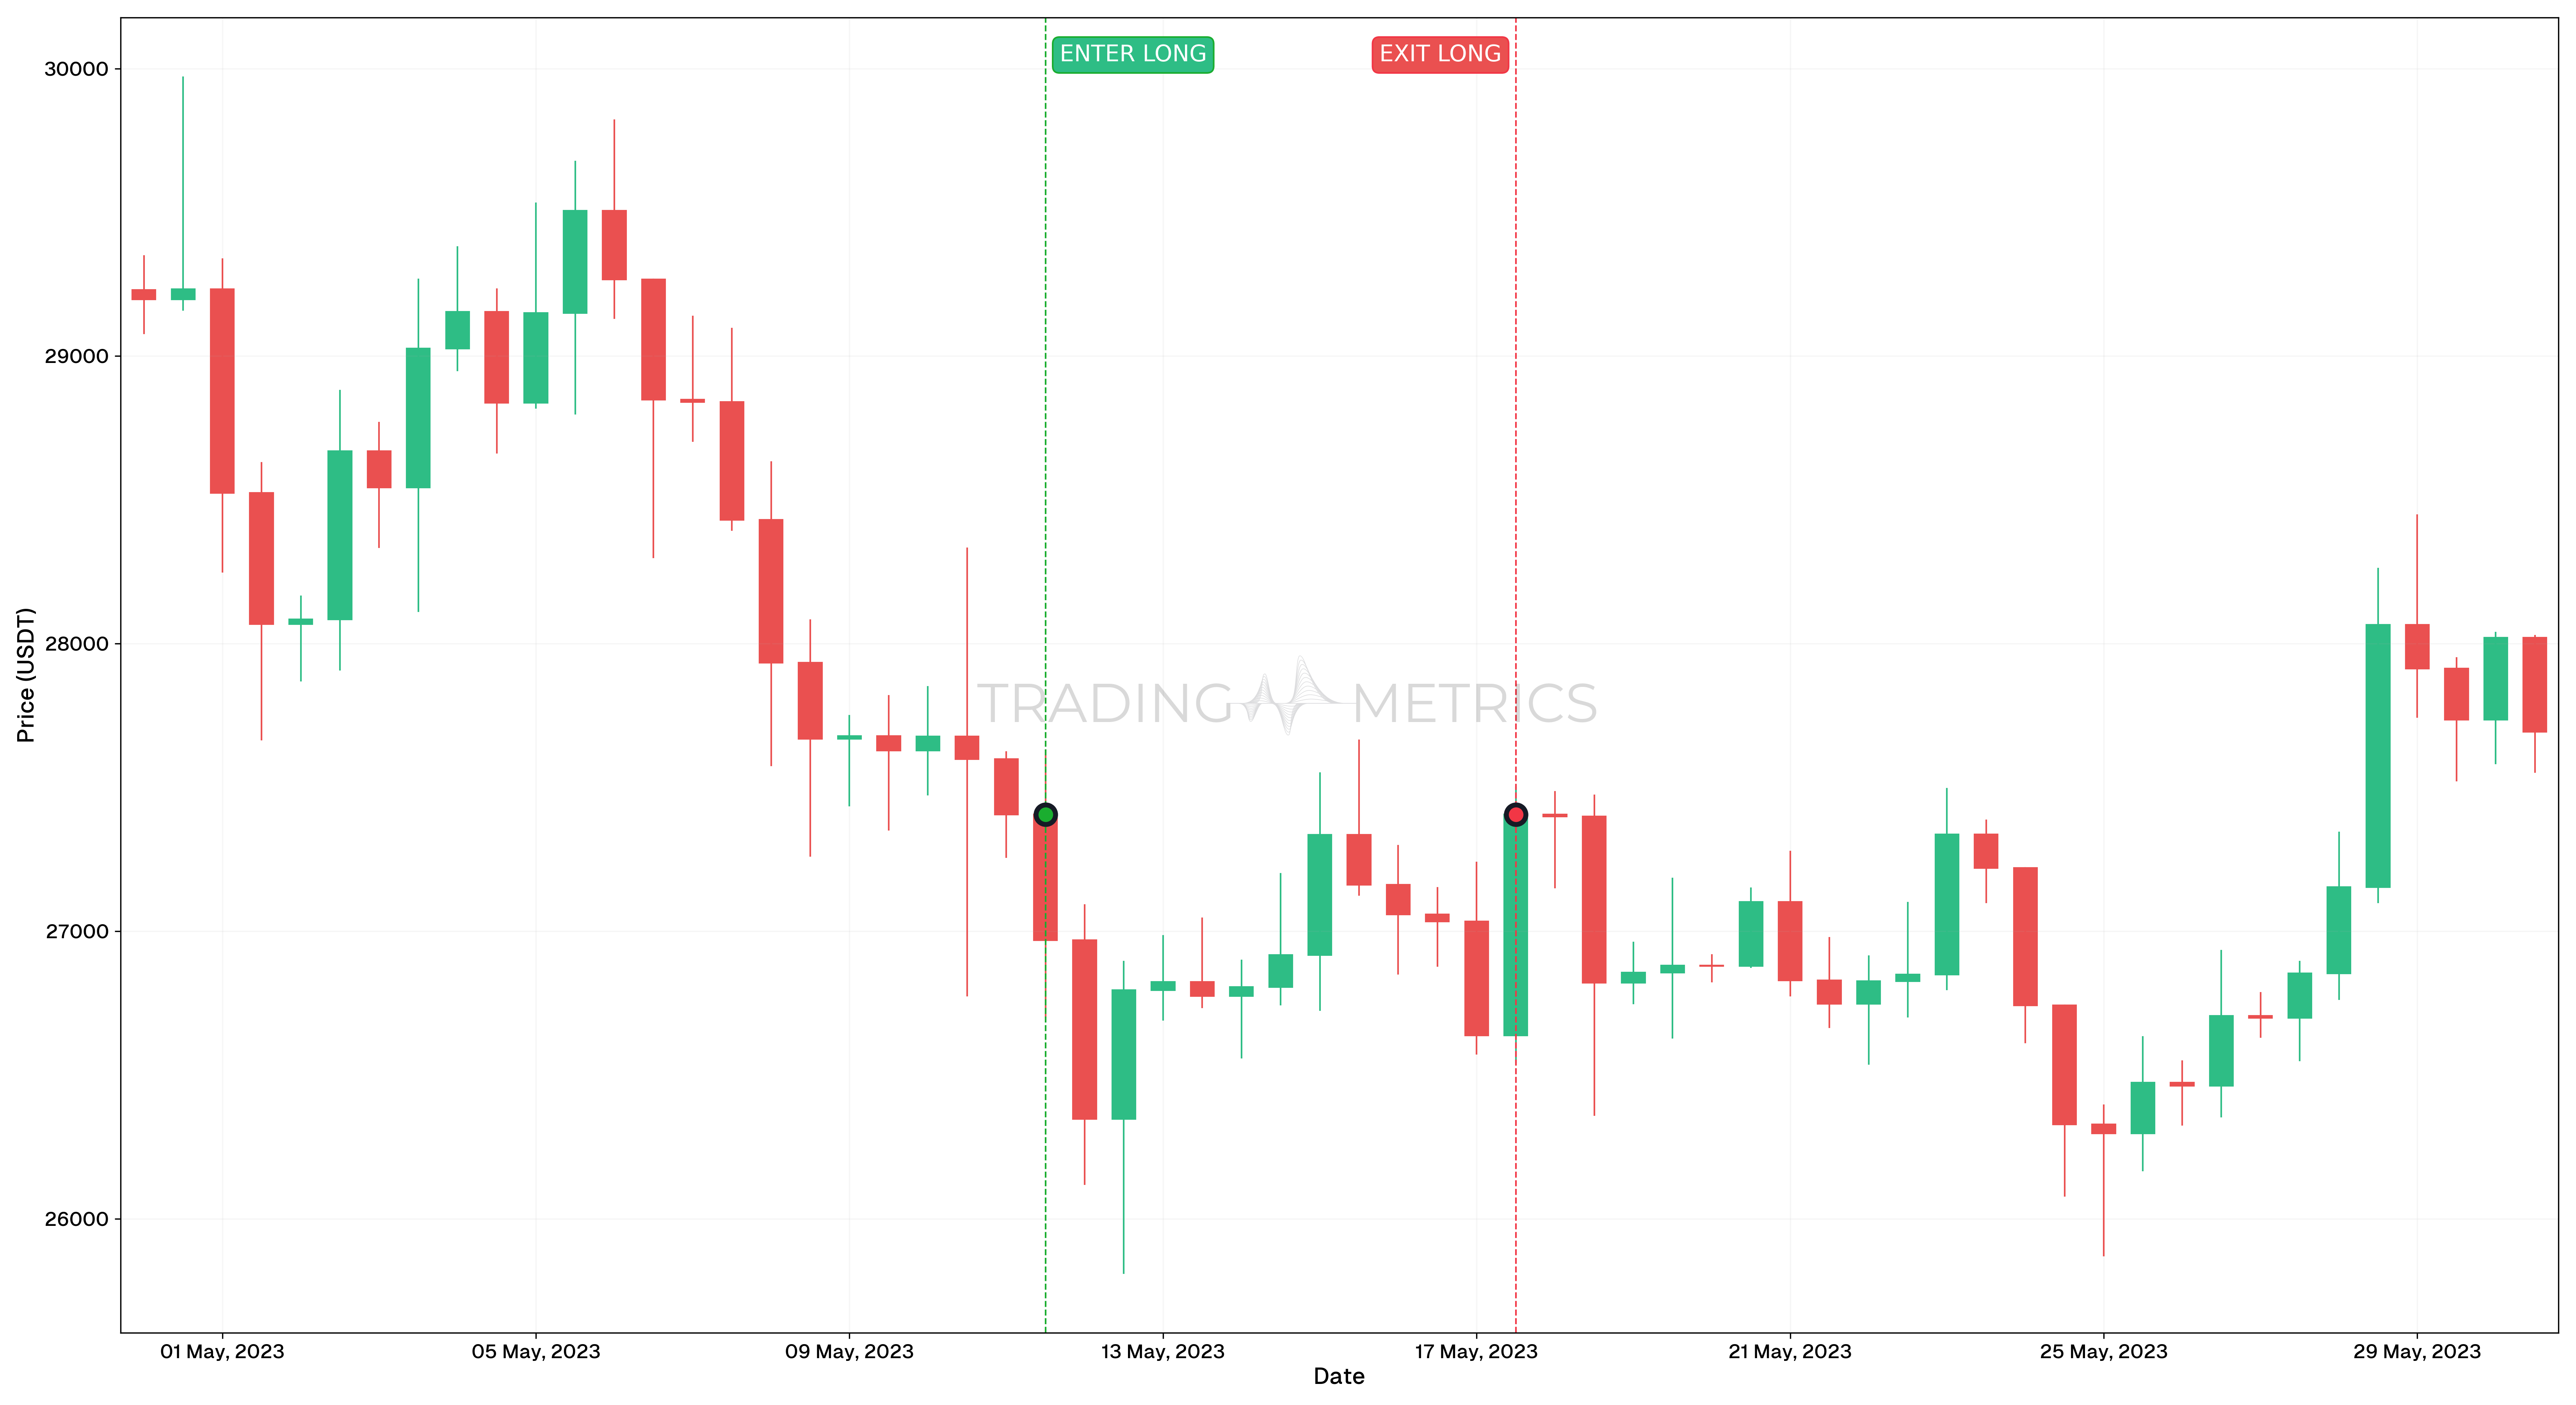
Analysis: This trade was initiated on May 11, 2023, 12:00, with an opening price of $27,405.61 and closed on May 17, 2023, 12:00, at the same price of $27,405.61. The trade resulted in a break-even scenario with no profit or loss, reflecting market stability during this period. This can be a strategic exit to avoid potential losses if no upward trend is anticipated.
Time is Your Greatest Ally: Total return rewards the patient. Longer horizons often amplify the benefits of reinvestment and compounding growth.
Combining Total Return with Other Tools
To gain deeper insights, Total Return can be combined with other financial metrics and tools:
- Volatility Metrics: Understand the risk associated with the investment.
- Sharpe ratio: Assess the risk-adjusted return.
- Benchmark Comparisons: Compare the Total Return of your investment against market benchmarks or other assets.
- Technical Analysis: Examine price charts and market patterns to identify potential future trends
- Fundamental Analysis: Look at the intrinsic value based on economic indicators and the financial health of the underlying asset.
Key Points
- Holistic Performance Indicator: Total return captures both income and capital appreciation, making it a comprehensive measure of investment success.
- Reinvestment Matters: Reinvesting dividends or interest amplifies long-term growth through compounding, a critical factor for maximizing returns.
- Comparison Across Investments: Total return allows investors to objectively compare different asset classes, funds, or strategies over the same time horizon.
- Time Sensitivity: Evaluate total return within the appropriate time frame to align with investment goals and market conditions.
- Inflation Adjustment: Always consider real total return to assess the true growth of your investment after accounting for inflation.
- Risk Considerations: Analyze total return in conjunction with risk metrics to ensure returns are consistent with your risk tolerance.
- Benchmarking for Insights: Use total return as a key metric to evaluate performance relative to industry benchmarks or peers.
- Strategic Reviews: Regularly review total return to identify underperforming assets and rebalance your portfolio when necessary.
Conclusion
Total Return is a vital metric for understanding the full performance of your investments. It gives you a complete picture that includes both capital gains and any income generated. Understanding and leveraging Total Return can significantly enhance your trading and investment strategies, helping you achieve your financial goals more effectively.
Frequently Asked Questions
Quick answers based on this page's topic.
Total return accounts for both capital appreciation (price changes) and any income generated, such as dividends, interest, or staking rewards. In long-term investing, this income often makes up a significant portion of the total profit due to the power of reinvestment.
Price alone is deceptive. An asset might look flat over a year, but if it paid a 10% dividend, your actual wealth increased. Total return captures the 'real' growth of your purchasing power, making it the essential metric for evaluating the success of a portfolio.
Standard Total Return does not account for inflation. To find your 'Real' Total Return, you must subtract the inflation rate from your nominal total return. This calculation reveals whether you are actually gaining wealth or just keeping pace with rising costs.