Three Outside Down Pattern: How Engulfing Sellers Take Control
The Three Outside Down pattern is a bearish reversal signal that typically forms at the top of an uptrend. It represents a clear shift in control from buyers to sellers and often signals the beginning of a potential downtrend.
The pattern develops when a bullish candle is followed by a larger bearish candle that completely engulfs the first one. This engulfing move shows that selling pressure has overtaken buying momentum. A third bearish candle then follows, closing below the second candle and confirming the reversal.
When this sequence appears, it suggests that bullish momentum has weakened while bearish momentum has strengthened. Traders often view the Three Outside Down as an opportunity to sell or short the asset in anticipation of further downward movement.
How to Identify the Three Outside Down Pattern in Trading
The Three Outside Down is a bearish reversal candlestick formation. It develops over three candles at the peak of an uptrend, starting with bullish momentum, followed by a powerful bearish engulfing move, and sealed with further downside. The setup shows bulls being overrun. Here’s how to spot it:
Start with the Big Picture
This pattern forms after an uptrend. Bulls attempt to extend higher, but are overwhelmed by sellers, who reverse momentum sharply.
Trace the Three-Candle Sequence
The structure unfolds in three steps:
- First Candle: A bullish candle, extending the uptrend, often modest in size.
- Second Candle: A long bearish candle, fully engulfing the first candle’s body, signaling that sellers have taken full control.
- Third Candle: Another bearish candle, closing below the second candle’s low, confirming the shift with follow-through selling.
Zero in on the Confirmation Level
The critical confirmation level is the low of the second candle. A close below this point validates the reversal. If the third candle also closes below the first candle’s low, it adds extra strength to the bearish signal.
Watch the Breakdown
The bearish trigger comes when the third candle closes below the second candle’s low.
- This confirms sellers are fully in charge.
- Aggressive traders may act on the engulfing second candle, while conservative ones wait for the third candle’s confirmation.
Check Volume for Additional Confirmation
Volume strengthens the case.
- Rises sharply on the second candle, showing the engulfing move’s force.
- Spikes or holds high on the third candle, reinforcing the continuation of bearish dominance.
Drop Surge: Measure the second candle’s body or use nearby support levels to project a realistic price target downward from the third candle’s close.
How to Trade the Three Outside Down Pattern (Trading Example)
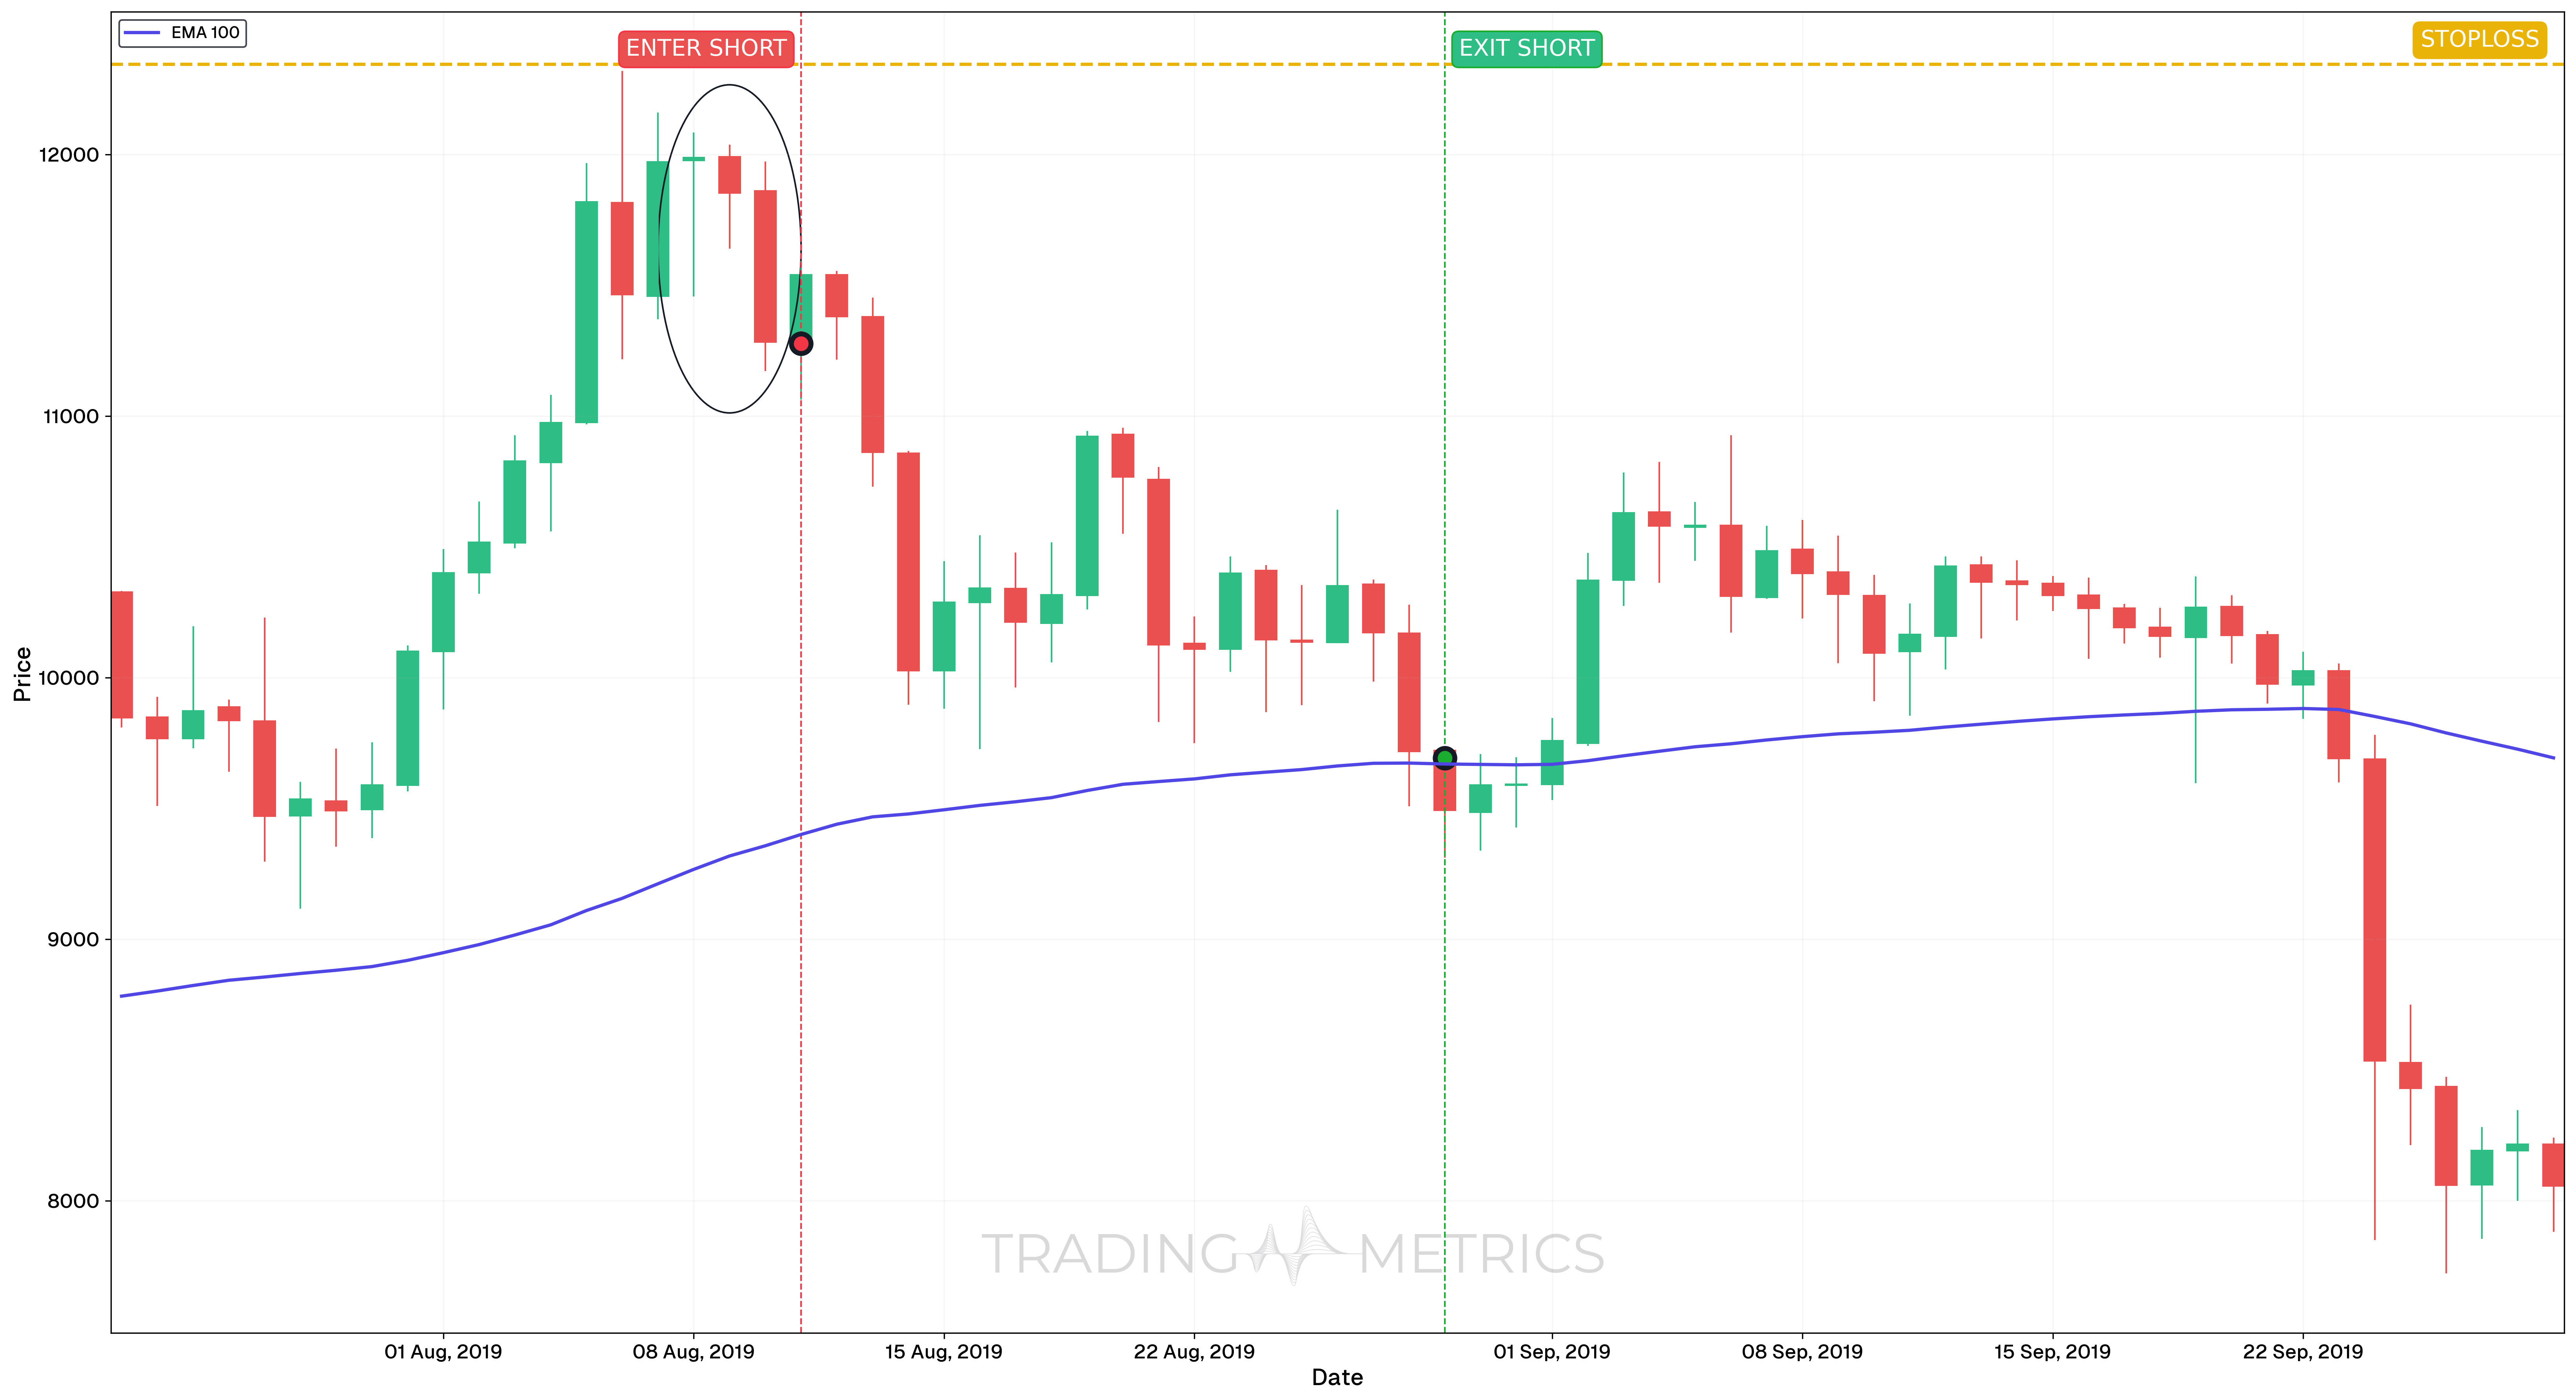
To illustrate how the Three Outside Down pattern can be applied in real trading, we’ll look at BTCUSDC on the daily chart. This bearish reversal setup occurred after a local uptrend and signaled a shift in market sentiment.
Analysis
In August 2019, BTCUSDC formed a clear Three Outside Down pattern. The structure appeared after an uptrend, with the bearish engulfing candle and confirmation close marking a momentum shift. Momentum Indicators such as RSI and StochRSI were also turning down at the time of entry.
Trade Setup
-
Entry: The short trade was entered on August 11, 2019, at $11,276.29, after the three-candle pattern completed with confirmation.
-
Exit: The trade was closed on August 29, 2019, at $9,692.57, as price touched the EMA(100) and showed signs of stabilization.
Risk Management
- Stop-Loss placement: The stop-loss was set at $12,343.59, just above the swing high and invalidation point of the pattern.
- Position sizing: Position size was determined using a 2% capital risk model, calculated based on stop-loss distance.
- Risk-Reward Ratio: 1:1.48 - a conservative risk-reward but backed by strong reversal structure.
- Volatility Consideration: Momentum weakened during a moderate Volatility compression, increasing the probability of follow-through after breakdown.
- Indicator-Based Exit: The EMA(100) was used as a dynamic target for mean reversion and acted as a natural profit-taking point.
Volume Crush: A volume spike on the second and third candles surges the pattern into a bearish drop, sealing the reversal’s might.
Pre-Trade Checklist
Surge the Proof: Pair the pattern with volume surges and indicators like RSI to dodge fakes and boost your odds.
Key Points
- Engulfing Strength: A modest first candle, engulfed by a large second, and a deep third boost reliability - weak engulfing dilutes it.
- Time Frame: Drops deepest on daily or weekly charts after uptrends.
- Combine with Indicators: Use moving averages or RSI to confirm the reversal.
- Breakout Confirmation: A close below the second candle’s low sets the drop - third candle strength is crucial.
- Price Target: Measure the second candle’s body or use support levels for a target below the close.
- Risk Management: Set a stop-loss above the second candle’s high to limit losses if it fails.
Wait for the Surge: Acting before the third candle confirms risks an outside trap - let the reversal overpower.
Conclusion
The Three Outside Down pattern is a trader’s commanding tool for catching bearish reversals. Its engulfing surge, paired with volume, RSI, and moving averages, can overpower into big gains. Whether in crypto, stocks, or forex, this pattern sharpens your edge. Stay vigilant, manage your risk, and let the outside close - that forceful drop could surge into a winning trade.
Frequently Asked Questions
Quick answers based on this page's topic.
The difference lies in the second candle. In Three Outside Down, the second candle is a large 'Engulfing' candle that completely swallows the first. This shows immediate and forceful price rejection, making the overall reversal structurally more violent and high-momentum.
The third candle provides proof of follow-through. It ensures that the 'Engulfing' move wasn't just a temporary volatility spike. By closing below the second candle's low, it validates a total regime change where sellers have successfully taken structural control of the trend.
It is most reliable on the 4-hour and Daily charts. On lower timeframes, 'engulfing' moves can be triggered by minor news noise. On higher timeframes, the pattern represents a significant shift in institutional sentiment, leading to more sustainable trend reversals.