On-Balance Volume (OBV): How Smart Money Telegraphs Its Moves
On-Balance Volume (OBV) is a technical analysis indicator that measures buying and selling pressure by using volume changes to predict price movements. Developed by Joe Granville in the 1960s, OBV is based on the idea that volume precedes price: if a stock or cryptocurrency is experiencing an increase in volume without a significant change in its price, it’s likely that the price will eventually follow the volume trend.
When price and OBV diverge, the truth is in the volume
- Anonymous
How to Use On-Balance Volume (OBV)?
Using OBV involves tracking the cumulative total of volume that adds or subtracts the volume of trading days depending on whether the price closed higher or lower than the previous day. The OBV line is plotted, and analysts look for trends, divergences, and confirmations with the price movement.
-
Trend Identification: When OBV is trending upwards, it suggests that buying pressure is prevailing, and the price is likely to go up. Conversely, a downward-trending OBV indicates selling pressure and potential price declines.
-
Divergence: If the OBV is rising while the price is falling or moving sideways, it may indicate that the price will soon follow the volume trend upwards. Similarly, if the OBV is falling while the price is rising, it could signal a coming price decline.
Volume Confirms Price: OBV tracks volume flow to confirm price trends - rising OBV aligns with bullish trends, while falling OBV supports bearish trends.
How to Calculate On-Balance Volume (OBV)?
The OBV is calculated by adding or subtracting the volume of each period, depending on whether the price closed higher or lower compared to the previous period. The formula can be broken down as follows:
- If today’s closing price is higher than yesterday’s closing price:
- If today’s closing price is lower than yesterday’s closing price:
- If today’s closing price is the same as yesterday’s closing price:
Importance of On-Balance Volume (OBV) in Trading
On-Balance Volume (OBV) is an important indicator in technical analysis because it combines price and volume to measure buying and selling pressure. By tracking whether volume flows into or out of a stock, OBV helps identify important trends before price movements become apparent. Traders use OBV to confirm price trends or anticipate reversals, making it an important tool for identifying potential breakout or breakdown points. Additionally, divergences between OBV and price can signal important shifts in market sentiment.
Divergence Detection: Spot divergences between OBV and price to anticipate potential trend reversals or weakening momentum.
OBV Periods
In the world of On-Balance Volume (OBV), periods refer to the specific time frames used to calculate and analyze the OBV indicator. These periods can vary, including daily, weekly, monthly, or even intraday intervals like 5-minute or hourly charts. The chosen period directly impacts how OBV data is interpreted and used in trading decisions.
The period value you select for OBV analysis determines the granularity and sensitivity of the indicator. Let’s break down different period values and their implications:
Short Periods (e.g., 5-minute, 15-minute, 1-hour charts)
Medium Periods (e.g., daily charts)
Long Periods (e.g., weekly, monthly charts)
Making OBV Periods Work for You
Choosing the right OBV period depends on your trading style and objectives. Here are some tips to make the most out of OBV periods:
- Match Your Strategy: Align the OBV period with your trading strategy. Day traders should use shorter periods, while swing traders and long-term investors should opt for medium to long periods.
- Combine Periods: Use multiple OBV periods to get a comprehensive view. For instance, a day trader might analyze both 5-minute and hourly OBV charts to validate short-term moves against broader trends.
- Backtesting: Test different OBV periods on historical data to see which period offers the best signals for your chosen asset. This helps in refining your strategy and improving accuracy.
Bearish Divergence
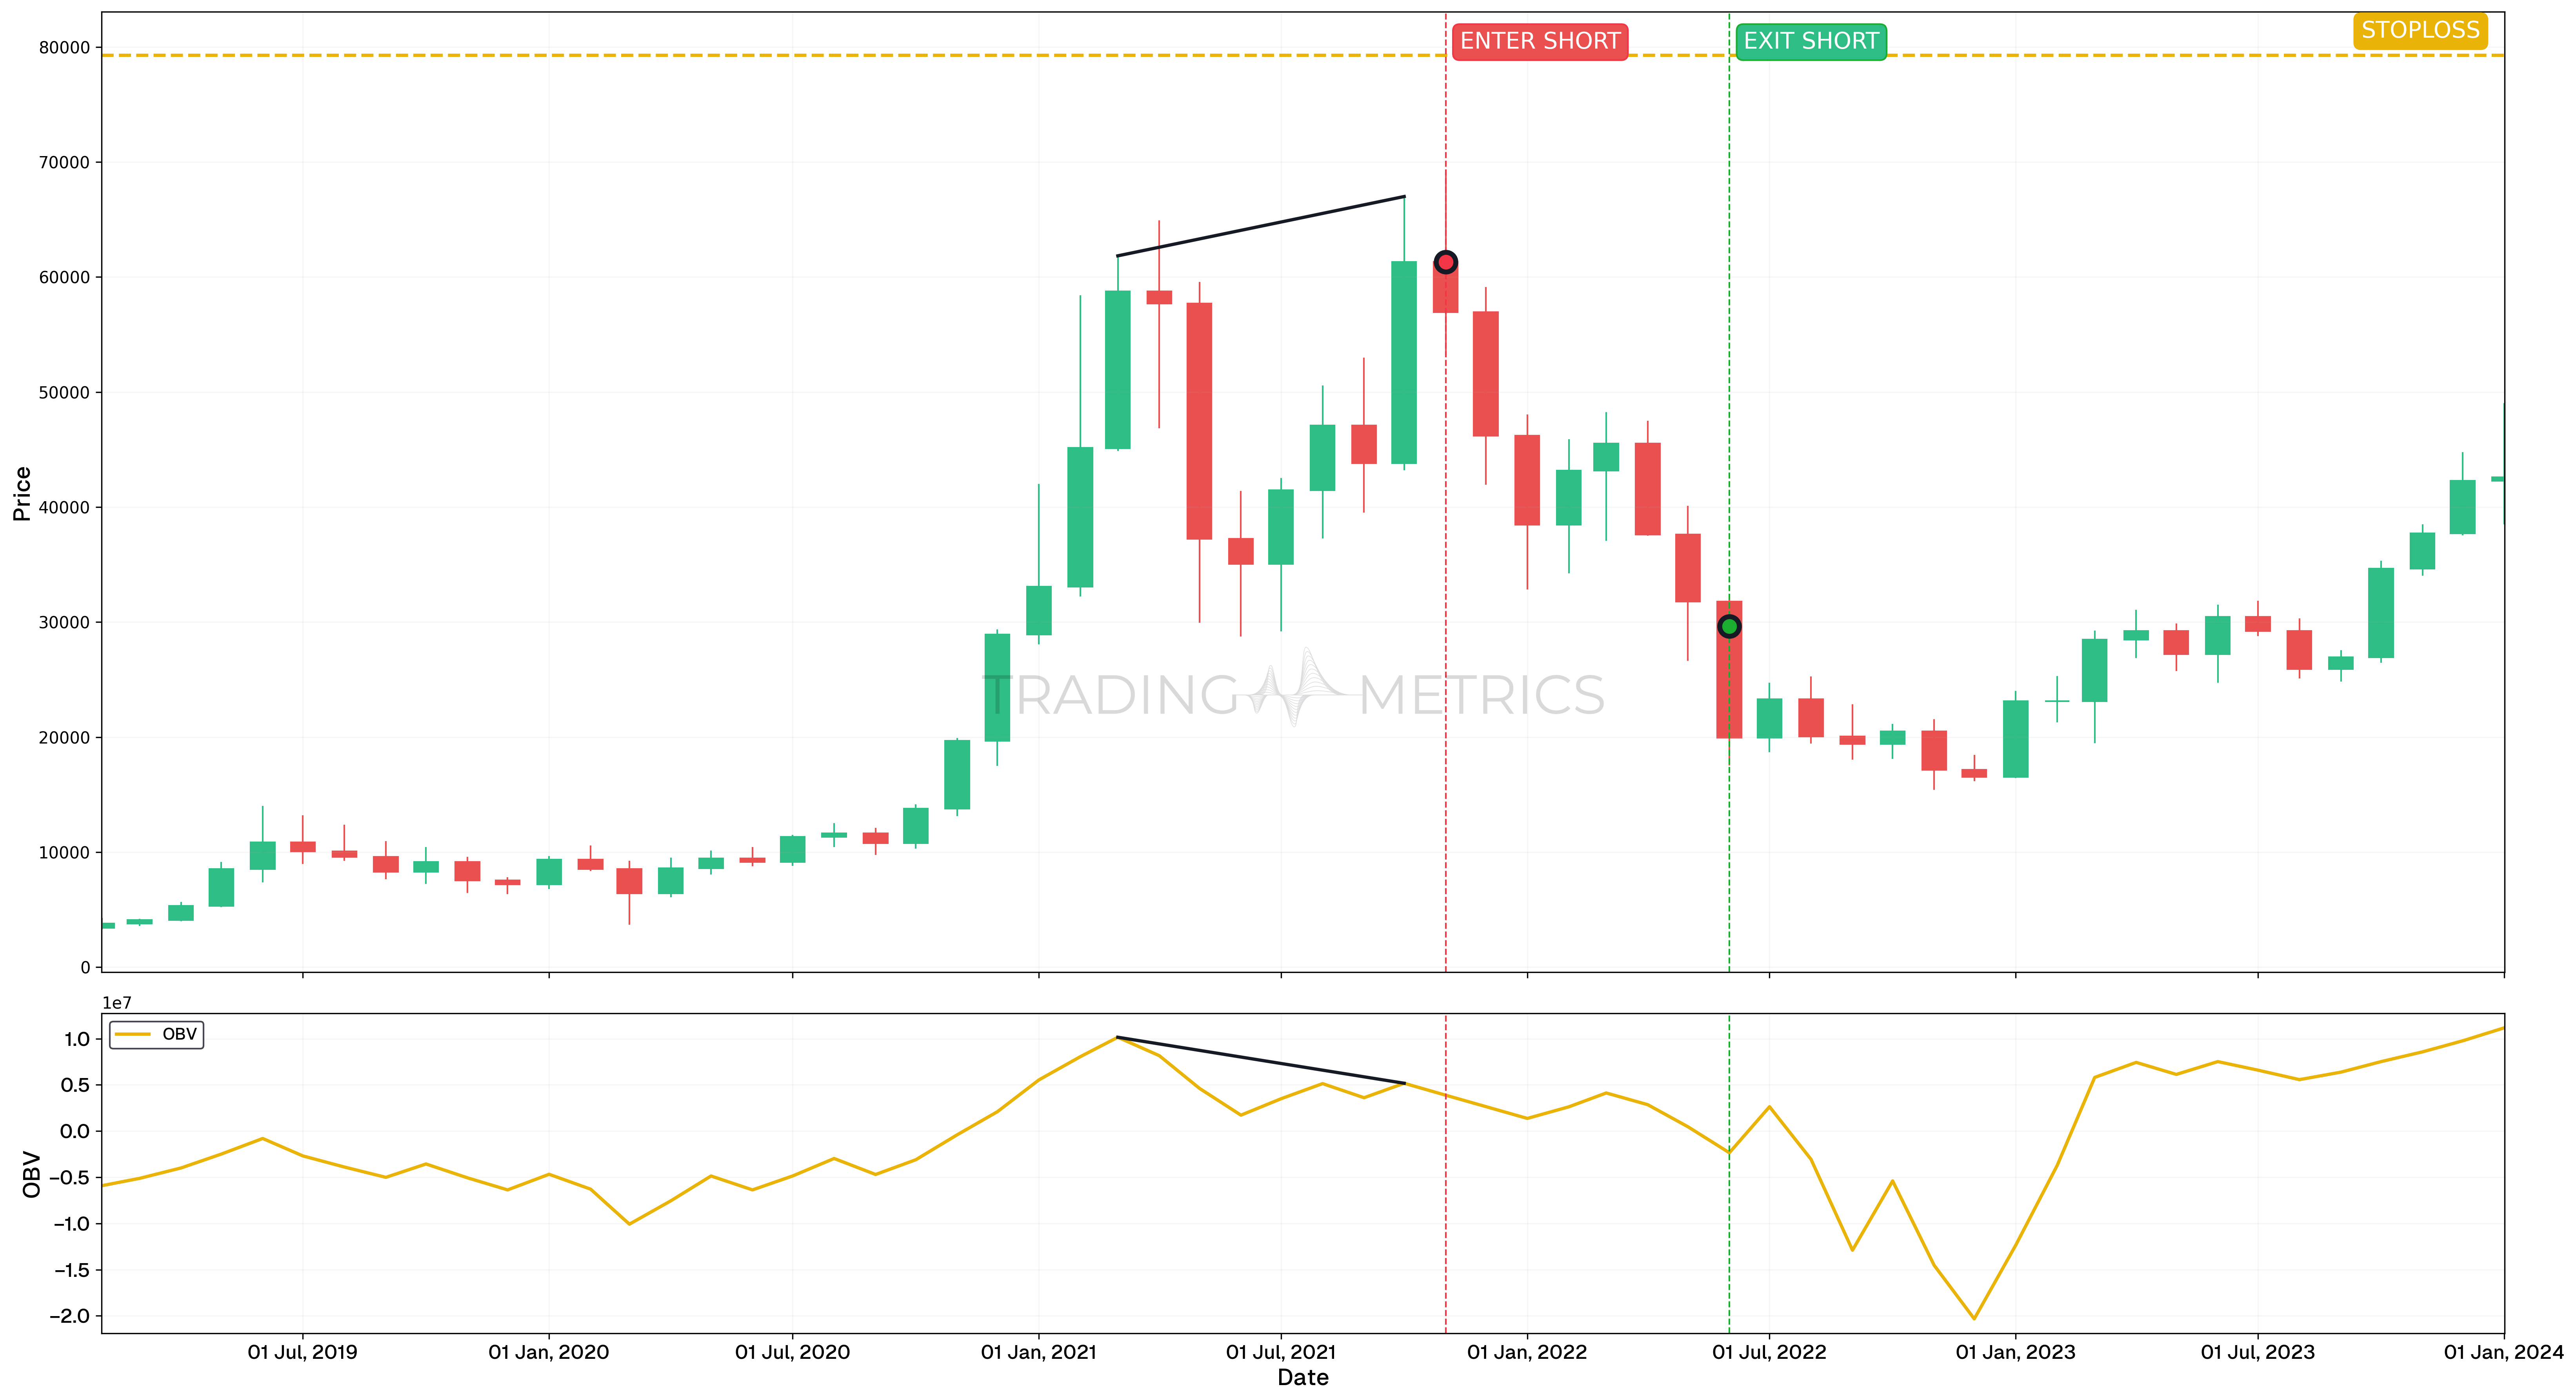
In this analysis, we observe a bearish divergence on the BTCUSDT 1-Month chart. A bearish divergence occurs when the price of an asset continues to make higher highs, while an indicator - in this case, the On-Balance Volume (OBV) - begins to form lower highs, signaling a weakening underlying trend and potential reversal.
Key Dates
-
Short Position Entry Signal: November 1, 2021
This marks the entry for a short position, following the completion of a bearish divergence between March 1, 2021, and October 1, 2021. While the price continued rising, the OBV showed declining strength, signaling a loss of momentum. -
Short Position Exit Signal: June 1, 2022
The exit occurs near a strong weekly support level at 29,645.80, where price reacts after a significant decline. This confirms the divergence-based setup and completes a well-timed short trade.
Analysis
The bearish divergence observed from March 1, 2021, to October 1, 2021, provided a reliable signal for a trend reversal. The price action created higher highs, but the OBV failed to confirm this momentum, creating lower highs instead. This imbalance highlighted a weakening trend, giving a signal to enter a short trade on November 1, 2021. The trade was exited on June 1, 2022, as price reached a previously identified support zone. This divergence led to a high-probability trade setup and reinforces the importance of combining price action with Volume indicators for better trade timing.
Risk Management
- Stop-Loss Placement: The stop-loss was strategically set at $79,266, aligning with the -23.6% Fibonacci Retracement level, providing a logical buffer against potential pullbacks while maintaining a controlled risk profile.
- Position sizing: Position size was calculated to ensure a maximum risk exposure of 2% of trading capital, adhering to disciplined risk management practices.
- Risk-Reward Analysis: The trade setup maintained a 1:76 Risk-Reward Ratio, optimizing the potential reward relative to the defined risk, especially given the high-probability divergence setup.
- Managing Volatility: With divergence setups involving OBV, increased volatility can occur. Monitoring price action around key Fibonacci levels can help adjust the stop-loss to secure gains while protecting against reversals.
- Exit Strategy: Implementing a partial exit strategy as price approaches significant support levels can lock in gains while maintaining exposure for further downside momentum, aligning with the bearish divergence setup.
Beware of False Signals: OBV works best when paired with other indicators like moving averages or RSI to confirm trends and avoid noise.
Bullish Divergence
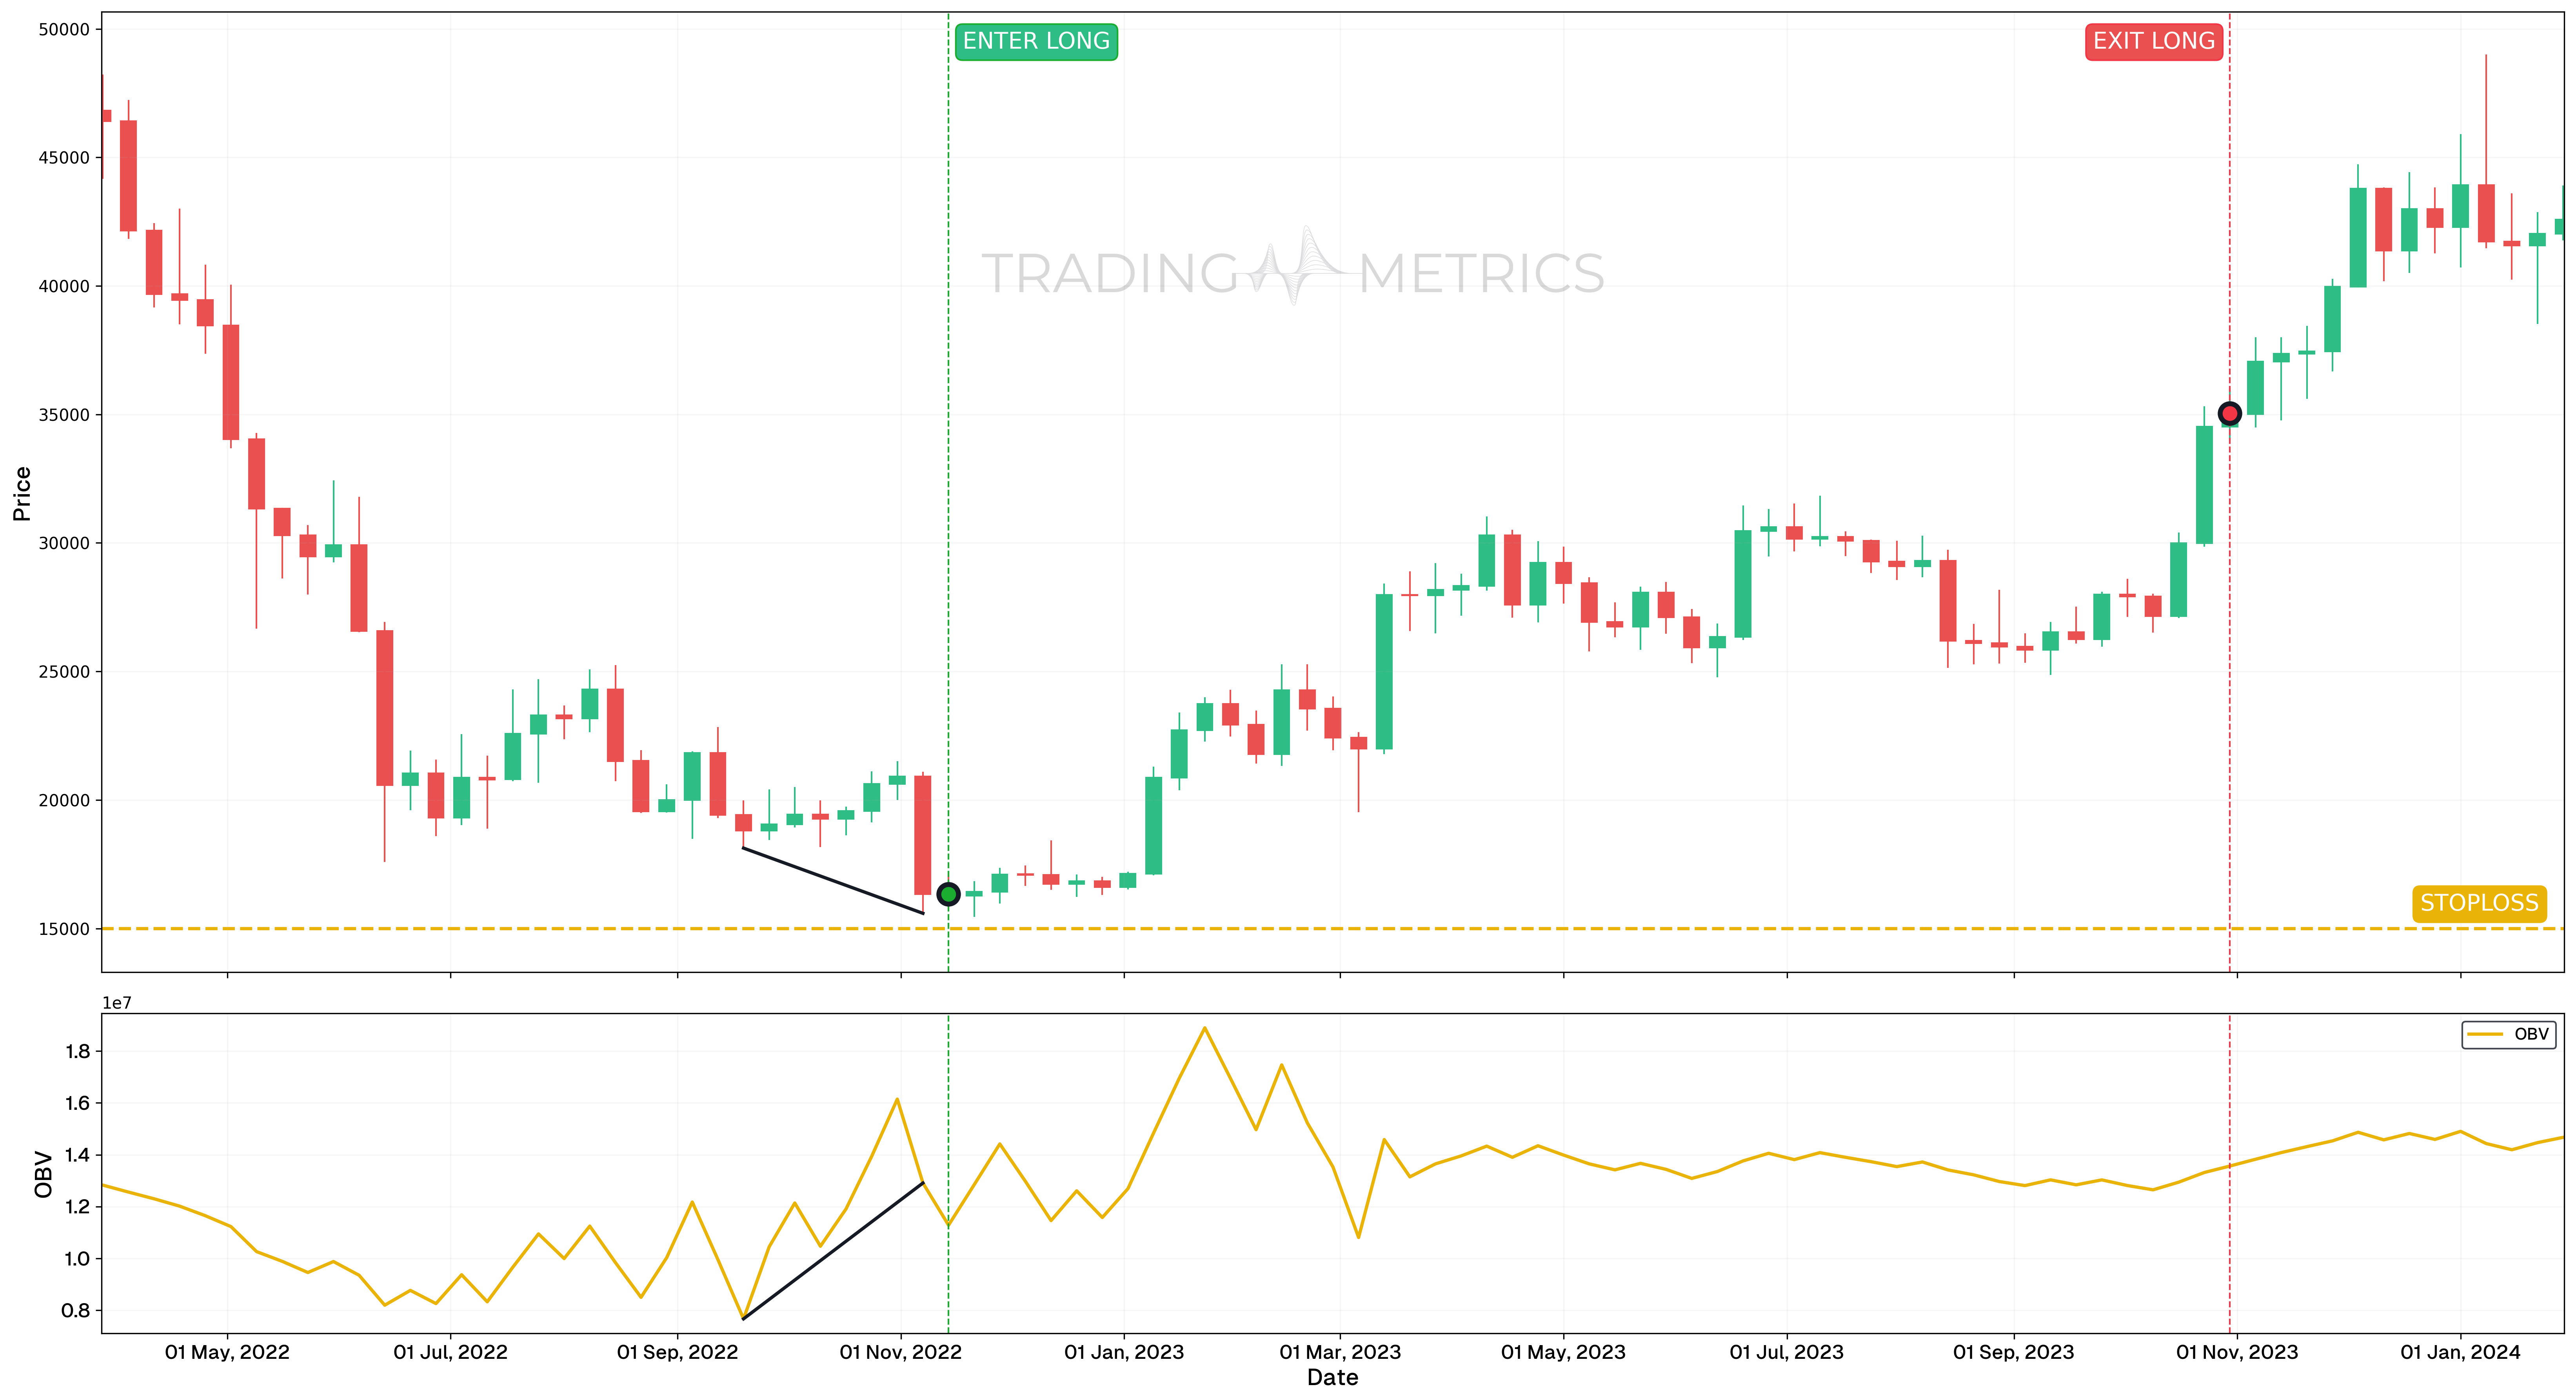
In this analysis, we observe a bullish divergence in the BTCUSDT weekly chart. A bullish divergence is a technical analysis pattern where the price of an asset is moving downward, but the underlying volume indicator, in this case, the On-Balance Volume (OBV), is showing signs of a potential upturn.
Key Dates
-
Buy Signal: November 14, 2022
This marks the entry point for a long position, following the completion of the bullish divergence between September 19, 2022 and November 7, 2022. During this time, the price formed lower lows while the OBV formed higher lows, suggesting growing buying pressure and a potential reversal. -
Sell Signal: October 30, 2023
This marks the exit point for the long position, right at the $35,045.00 level, which was a clear resistance zone on the monthly timeframe. The trade captured a substantial move from the bottom of the range to a key resistance.
Analysis
The bullish divergence highlighted in this setup provided a strong basis for a long trade entry. From September 19, 2022, to November 7, 2022, we observed a divergence between price and OBV, signaling accumulation even as the price declined. The trade was entered on the next candle, November 14, 2022, and exited on October 30, 2023, at the key resistance of $35,045.00. This trade capitalized on early reversal signals and respected historical levels, illustrating the effectiveness of divergence-based strategies when combined with monthly timeframe context.
Risk Management
- Stop-Loss Placement: The stop-loss was strategically set at $15,000, aligning with a key support/resistance level identified from previous price action. This placement ensures a logical protective barrier against potential reversals while maintaining a controlled risk profile.
- Position sizing: Position size was calculated to maintain a maximum risk exposure of 2% of trading capital, adhering to a disciplined risk management approach.
- Risk-Reward Analysis: The trade setup maintained a 1:14.03 Risk-Reward Ratio, optimizing the potential for profit relative to the defined risk, especially given the strong bullish divergence signal.
- Managing Volatility: Given the OBV divergence setup, volatility can increase significantly. Monitoring price action at key levels, especially near the $15,000 support, is essential to adjusting the stop-loss and securing gains.
- Exit Strategy: Implementing a partial exit strategy as the price approaches critical resistance levels can help secure gains while allowing for** continued upward momentum**, aligning with the bullish divergence structure.
Bearish trend confirmation
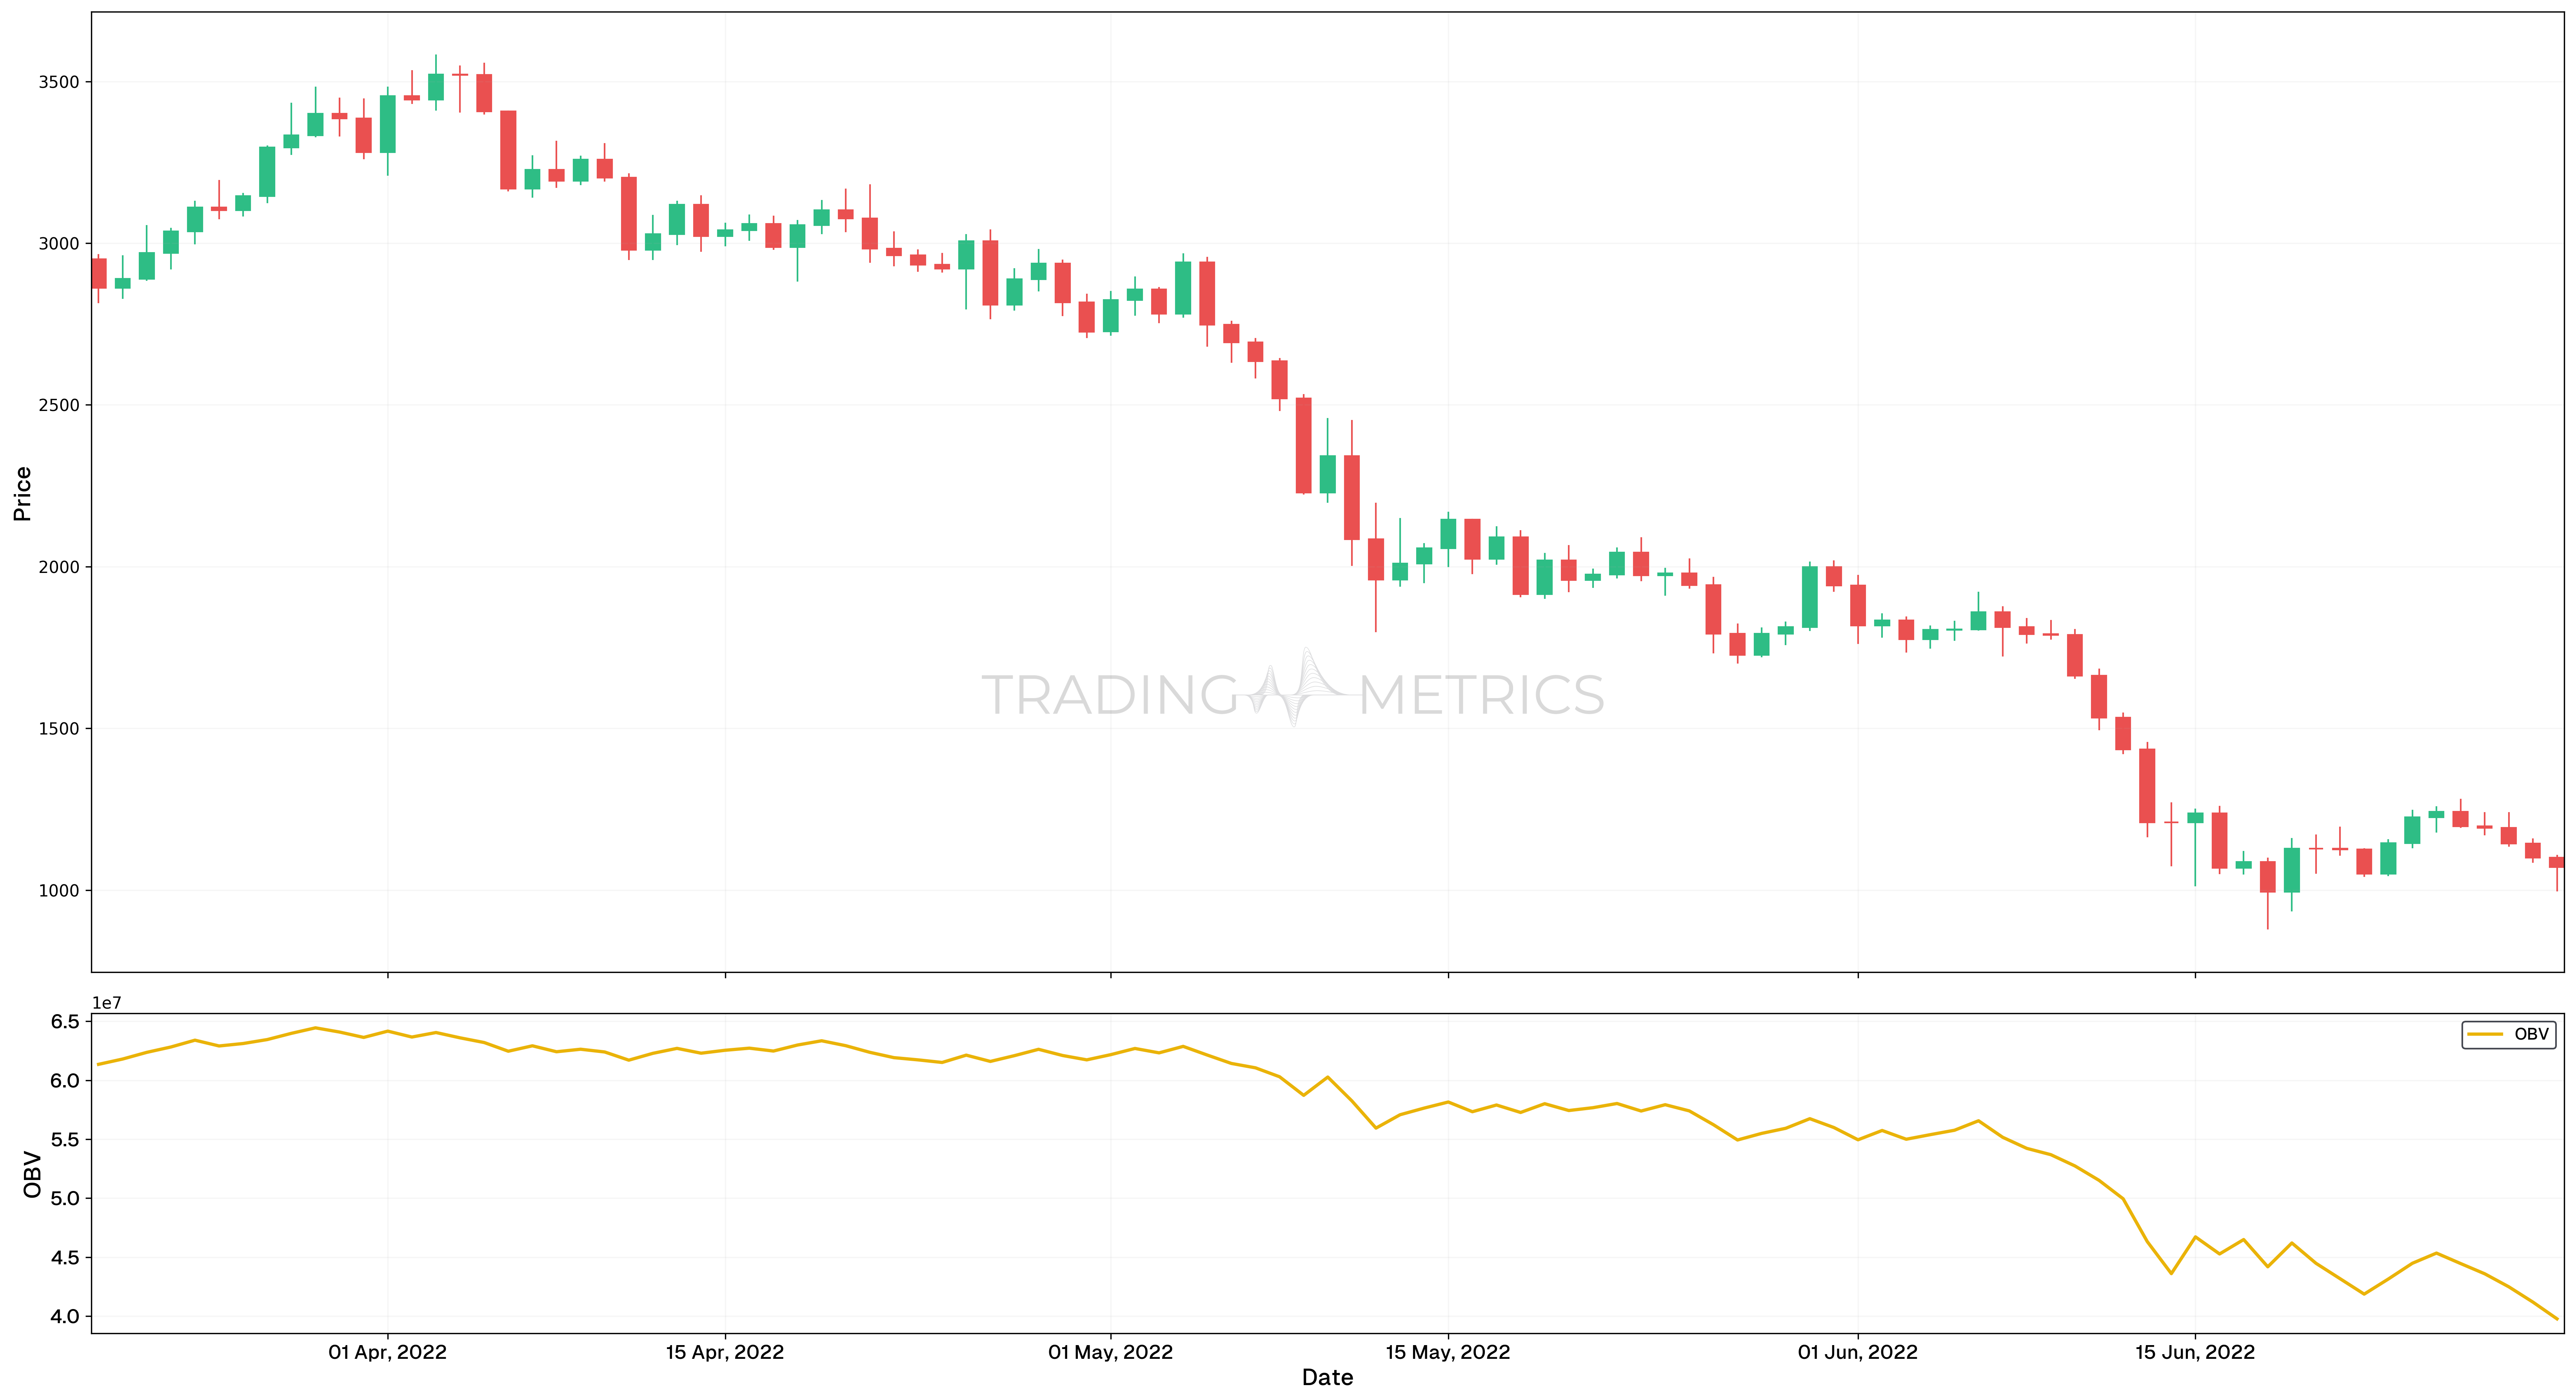
In the given candlestick chart, the price of the asset is observed to be declining from March 20, 2022 to June 30, 2022. This downward trend is clearly depicted by the decreasing candlesticks over the specified period.
Simultaneously, the On-Balance Volume (OBV) indicator, plotted below the candlestick chart, is also showing a decreasing trend during the same period. OBV is a Volume indicator that uses volume flow to predict changes in stock price. The fact that OBV is decreasing alongside the price suggests that the selling pressure is strong, confirming the downtrend.
In this chart, OBV is effectively used as a trend confirmation tool. As both the price and OBV are moving in the same downward direction, it reinforces the bearish trend, indicating that the downtrend is likely to continue as long as OBV does not reverse its direction.
Bullish trend confirmation
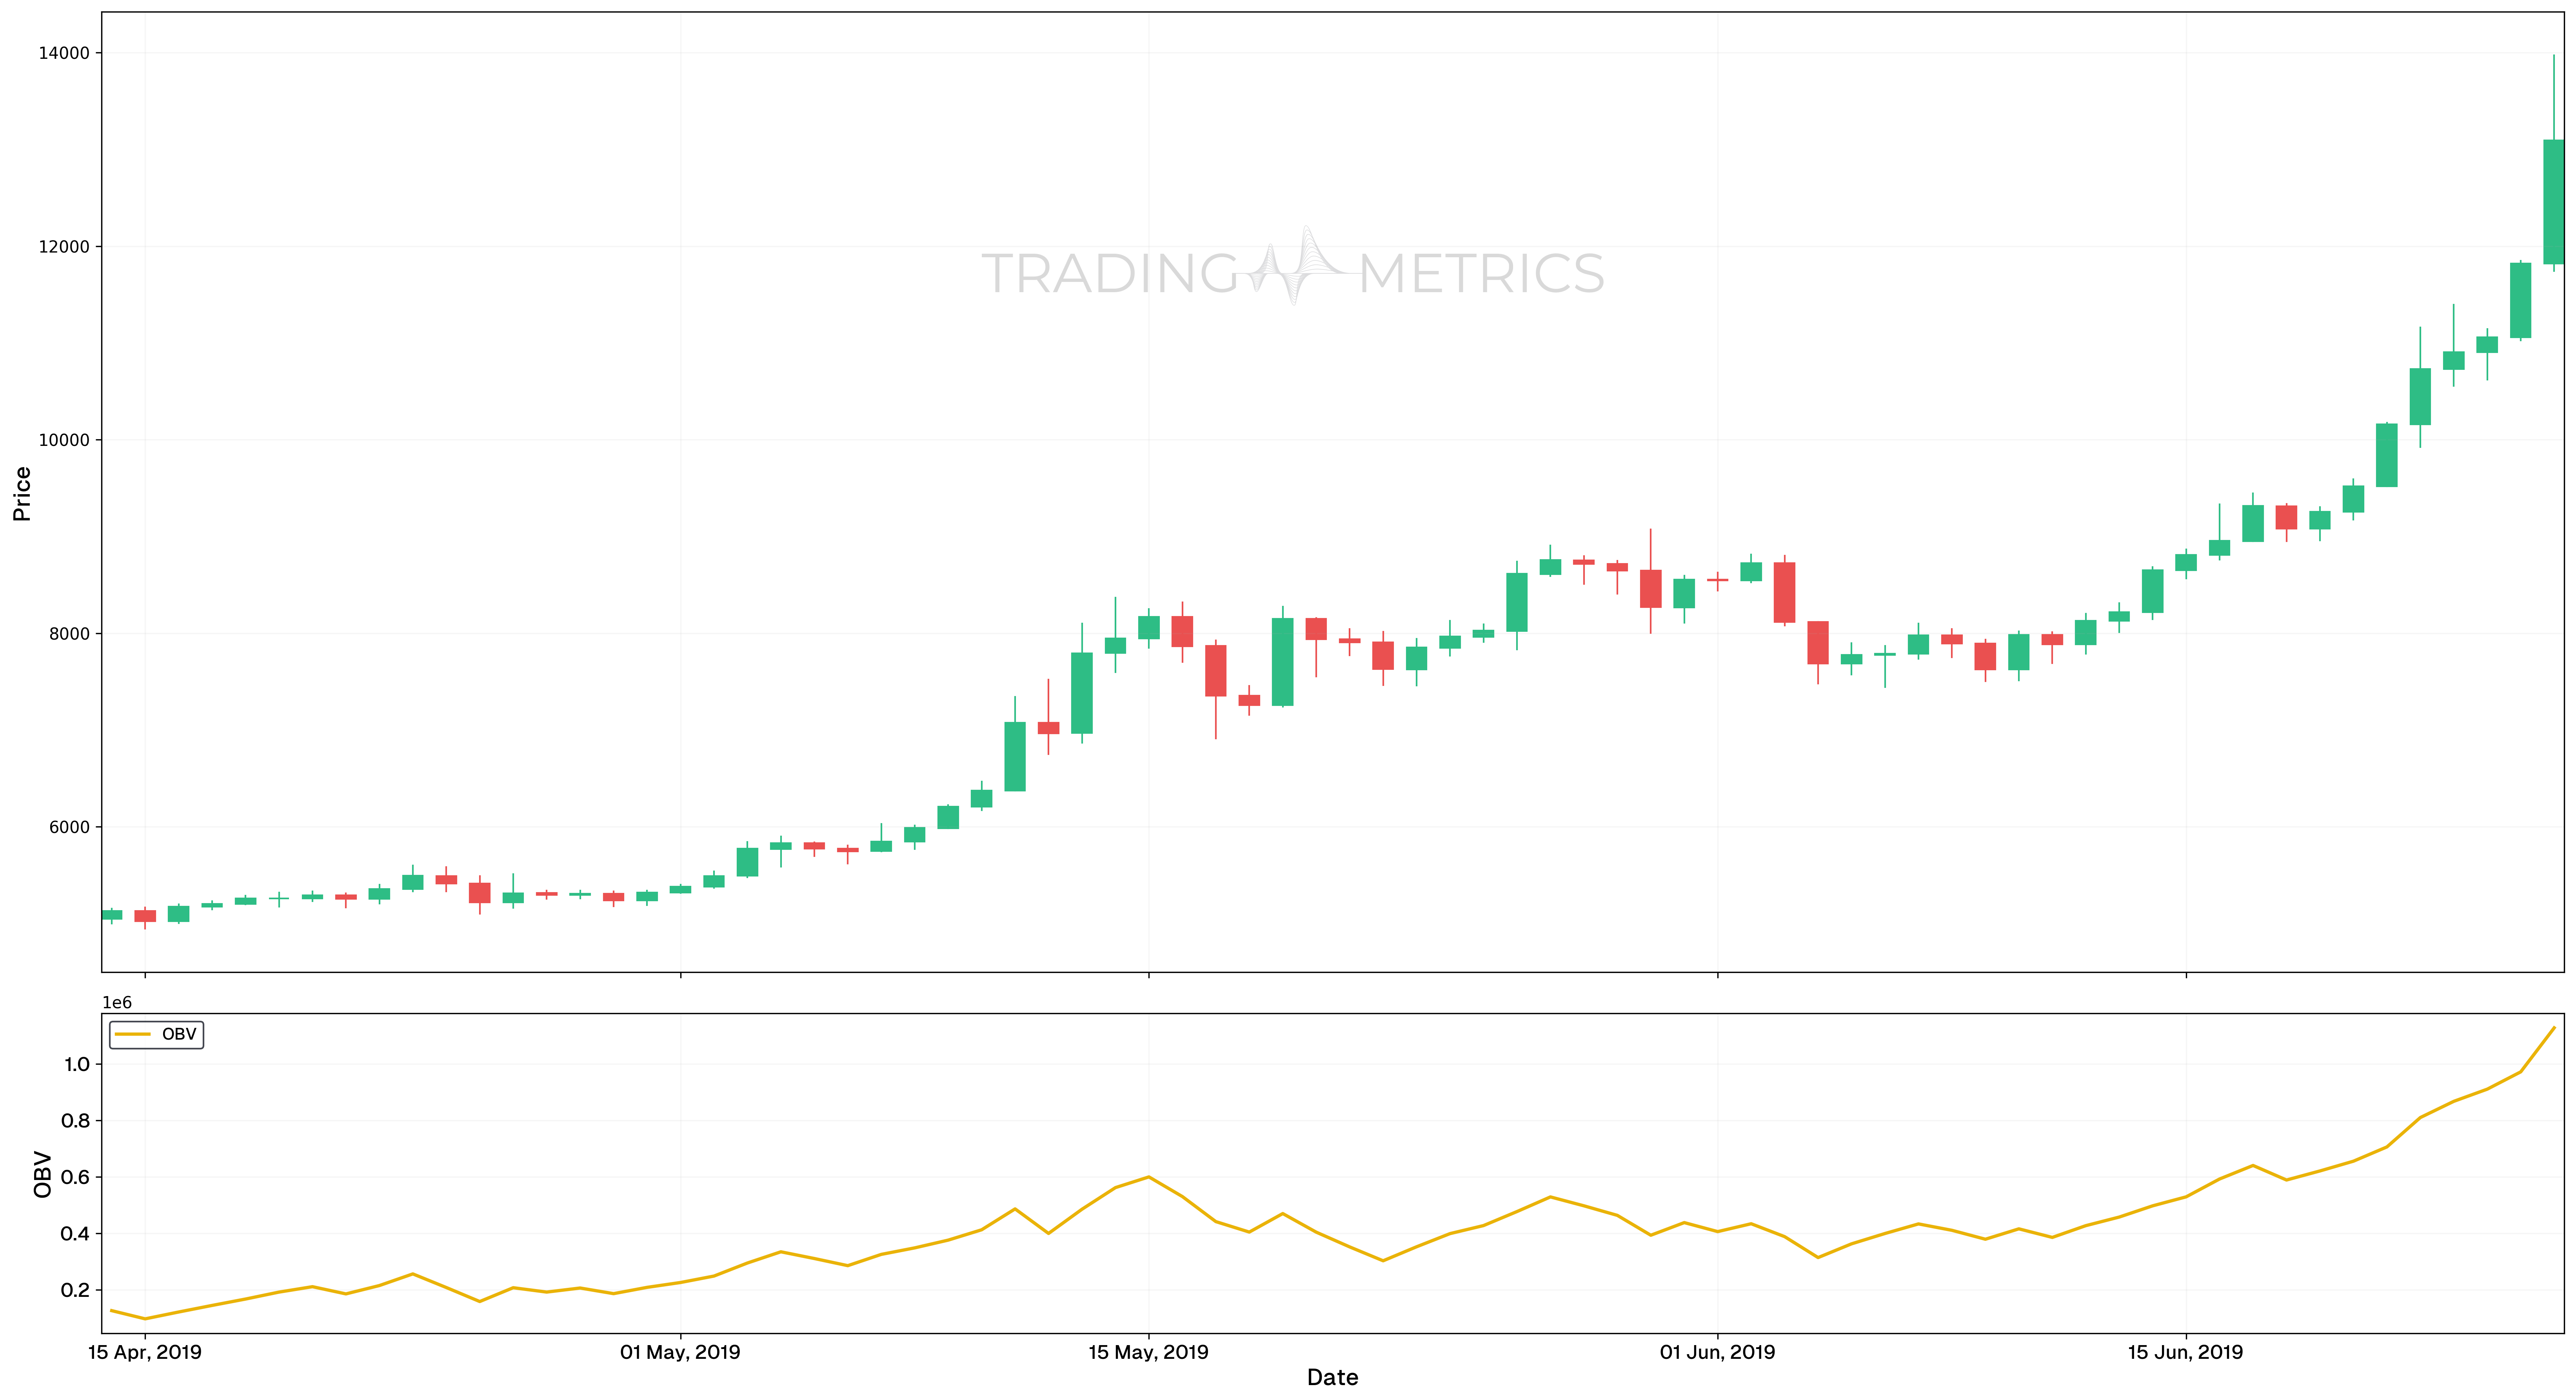
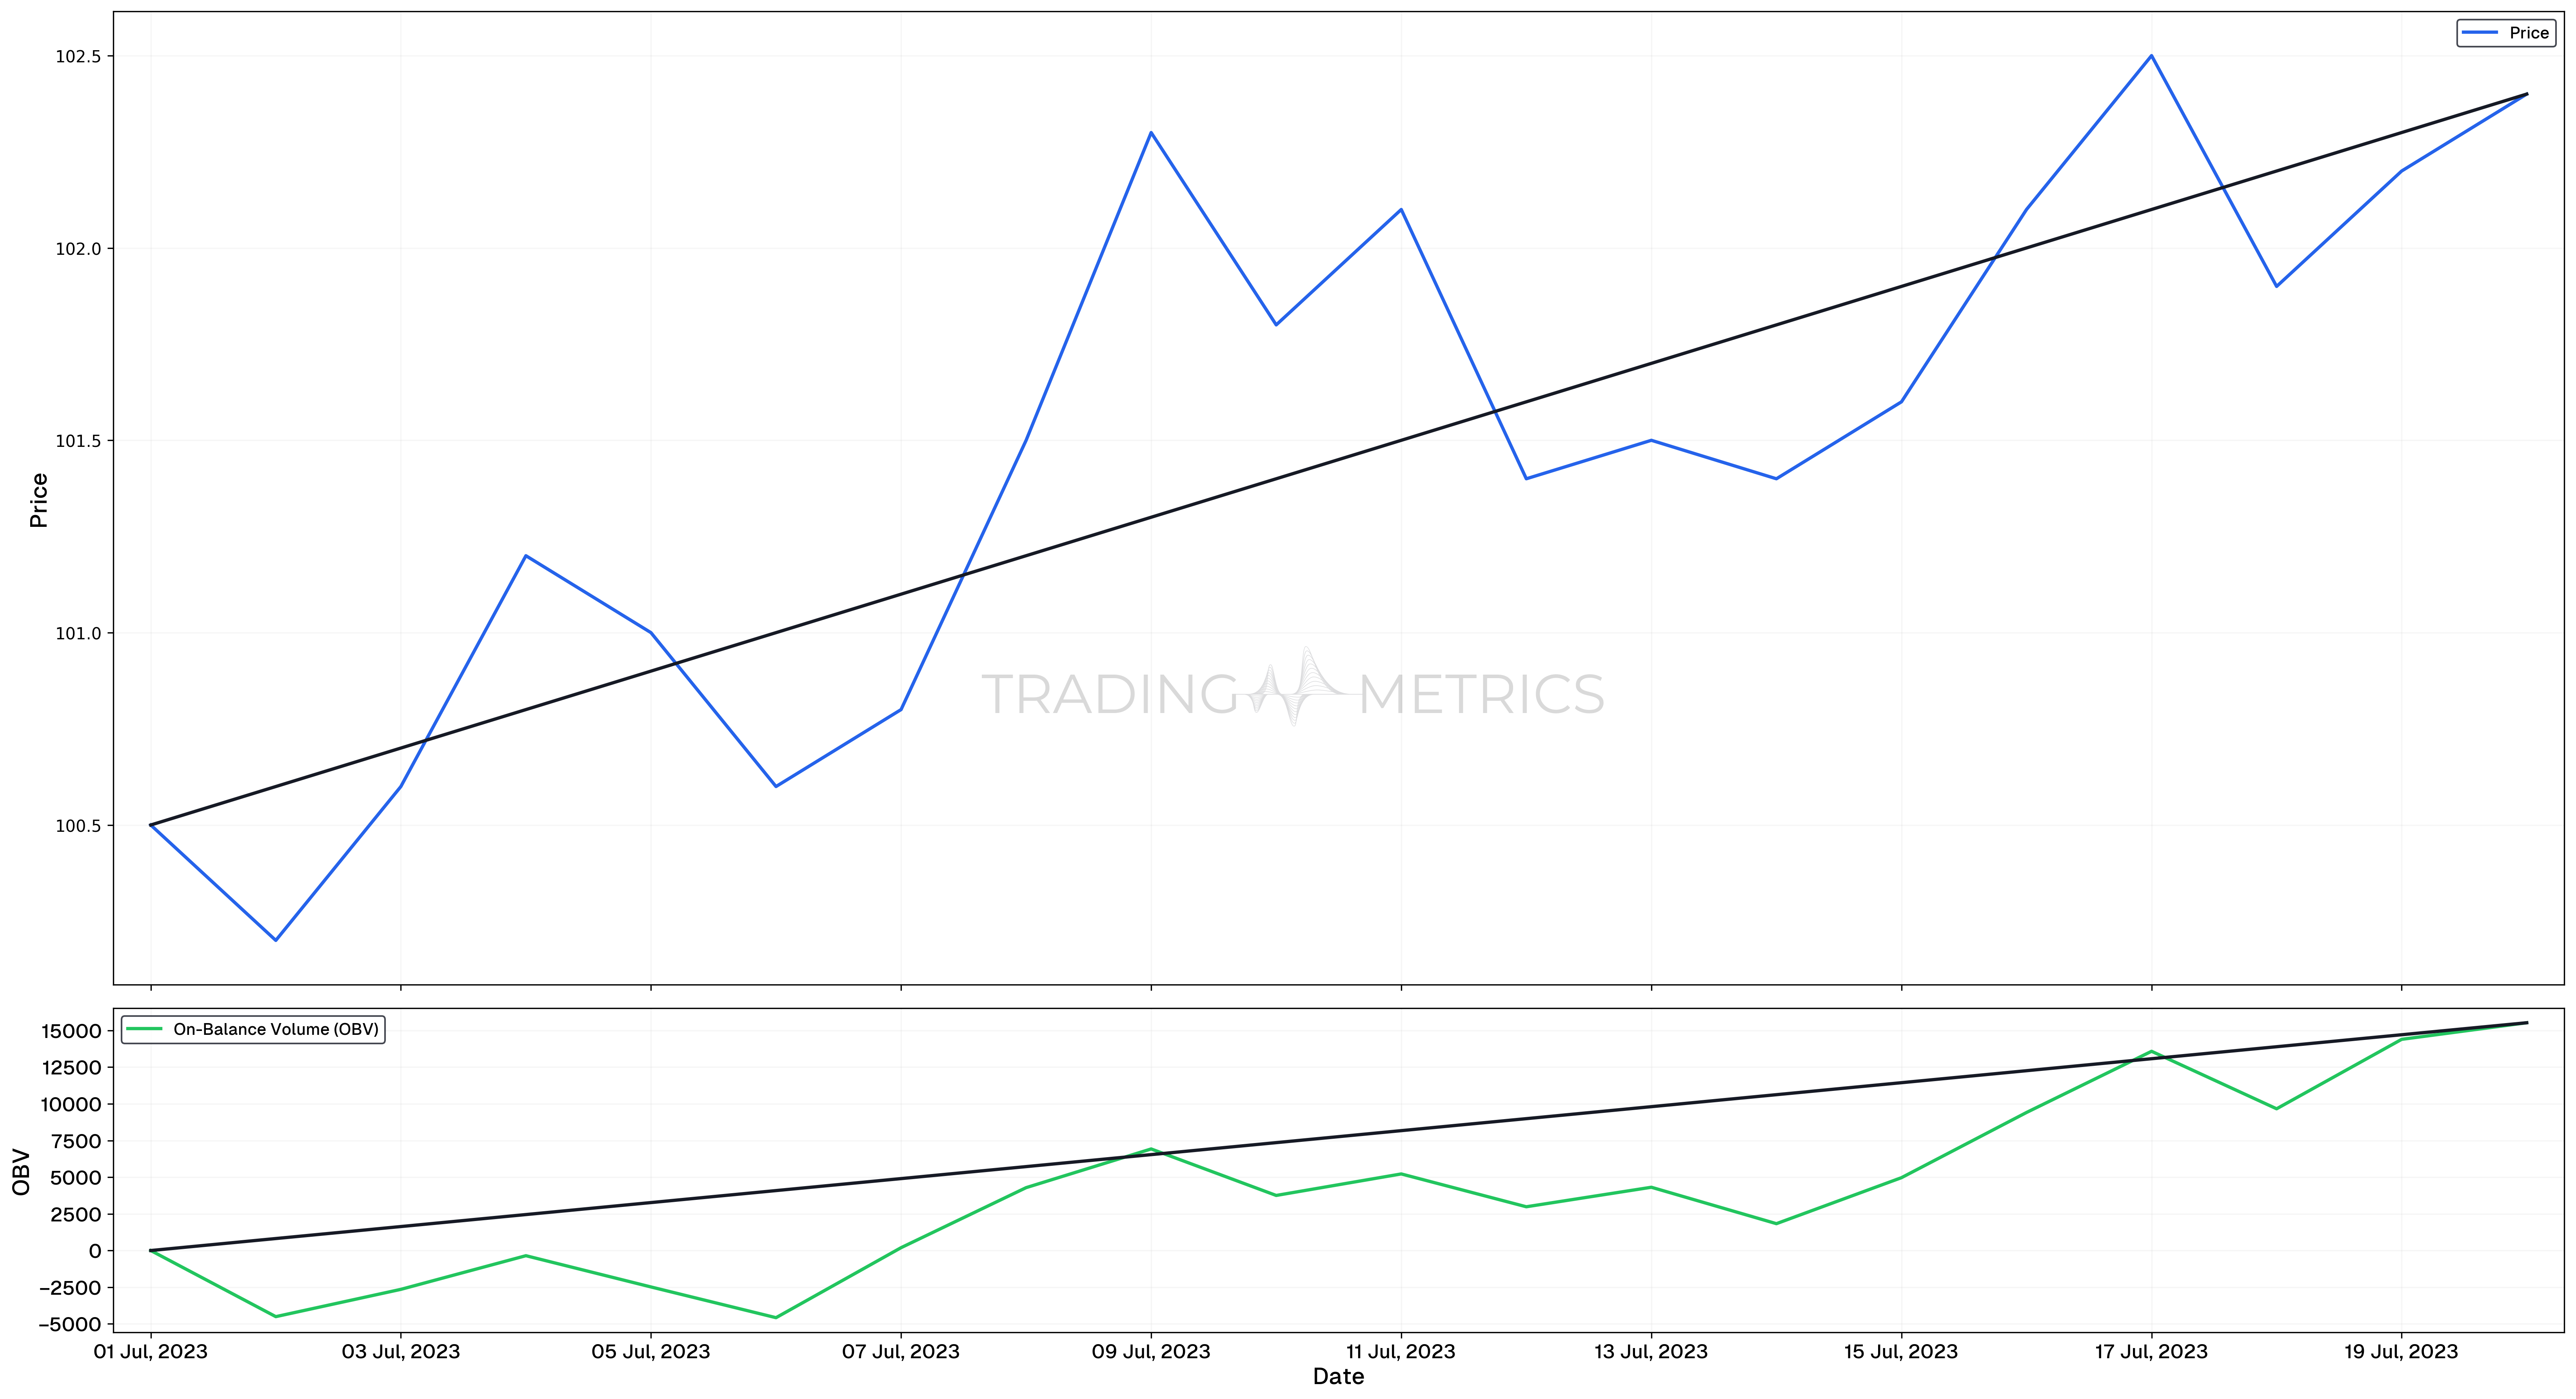
In the chart above, we observe a period where the price is moving upwards, specifically from 14.04.2019 to 26.06.2019. During this time, the price shows a series of higher highs and higher lows, indicating a bullish trend.
Alongside this, the On-Balance Volume (OBV) is also increasing, which serves as a confirmation of the trend. OBV is a volume-based indicator that measures buying and selling pressure. When the OBV is rising, it suggests that more volume is being driven by buyers, which supports the upward price movement.
In this scenario, the rising OBV reinforces the price action, indicating that the uptrend is likely to continue as long as the OBV maintains its upward trajectory. This makes OBV a valuable tool for trend confirmation, as it helps traders identify whether a price trend is supported by strong volume.
Combining OBV with Other Tools
OBV is often used in conjunction with other technical indicators to improve the accuracy of predictions. Some commonly used tools include:
- Moving Averages: Combining OBV with moving averages can help smooth out the OBV line and provide clearer trend signals.
- Relative Strength Index (RSI): Using RSI along with OBV can help confirm overbought or oversold conditions, enhancing the prediction of potential reversals.
- Support and Resistance Levels: OBV can be used to confirm breakouts or breakdowns through these levels.
Long-Term Trends: OBV is particularly effective for identifying long-term accumulation or distribution phases by institutions.
Key Points
- Volume-Based Momentum Indicator: On-Balance Volume (OBV) tracks cumulative buying and selling pressure by combining volume with price movements.
- Directional Signals: OBV increases when prices close higher, indicating buying pressure. OBV decreases when prices close lower, indicating selling pressure.
- Trend Confirmation: Rising OBV supports an uptrend. Falling OBV supports a downtrend.
- Divergence Signals: Bullish divergence means that price makes lower lows, but OBV makes higher lows. Bearish divergence means that price makes higher highs, but OBV makes lower highs.
- Volume Precedes Price: OBV can provide early signals of potential price moves as volume changes often lead price action.
- Works Across Time Frames: OBV is effective for both short-term and long-term analysis, making it versatile for various trading styles.
- Combine with Other Indicators: Use OBV with trend or Momentum Indicators, such as moving averages or RSI, for confirmation and better decision-making.
- Simple Calculation: OBV relies on straightforward calculations, making it easy to integrate into trading strategies.
- Effective in Trending Markets: OBV performs best in trending markets, where volume can significantly influence price movements.
- Backtesting and Monitoring: Include OBV in backtesting to evaluate its performance in different market conditions and adjust strategies for live trading.
Conclusion
OBV is a powerful indicator for understanding market sentiment and potential future price movements. By integrating OBV into a comprehensive analysis framework that includes other technical indicators and market context, traders can enhance their decision-making process. Always consider the volume trends and use OBV to validate or question the price movements you observe. OBV is also a valuable tool for gauging market sentiment and predicting price movements. However, it’s important to use it as part of a broader analysis strategy, combining it with other indicators and considering the overall market context.
Frequently Asked Questions
Quick answers based on this page's topic.
OBV adds volume on up-days and subtracts it on down-days to create a running total. A rising OBV confirms an uptrend by showing that volume is heavier on buying days, signaling that the move has strong participation from market participants.
Because volume often precedes price, an OBV breakout above a previous peak can be a leading indicator of an upcoming price rally. It signals that smart money is accumulating the asset before the technical breakout becomes obvious to the general market.
Yes, OBV divergence is a powerful warning sign at market tops. When price hits a new high but OBV fails to surpass its previous peak, it indicates that the move is driven by lower volume, suggesting that institutional interest is fading.