Gann Fan: Reading Trend Strength Through Geometric Angles
The Gann Fan is an intriguing trading tool created by William Delbert Gann, a legendary trader known for his unique approach to market analysis. At its core, the Gann Fan is a series of angled lines that help traders identify potential support and resistance levels based on the idea that time and price move in harmony. By examining these angles, traders can forecast future price movements and determine potential turning points in the market.
Precision in Placement: The accuracy of Gann Fan lines depends on the correct placement of the starting point, so pick a significant pivot high or low.
What is the Gann Fan?
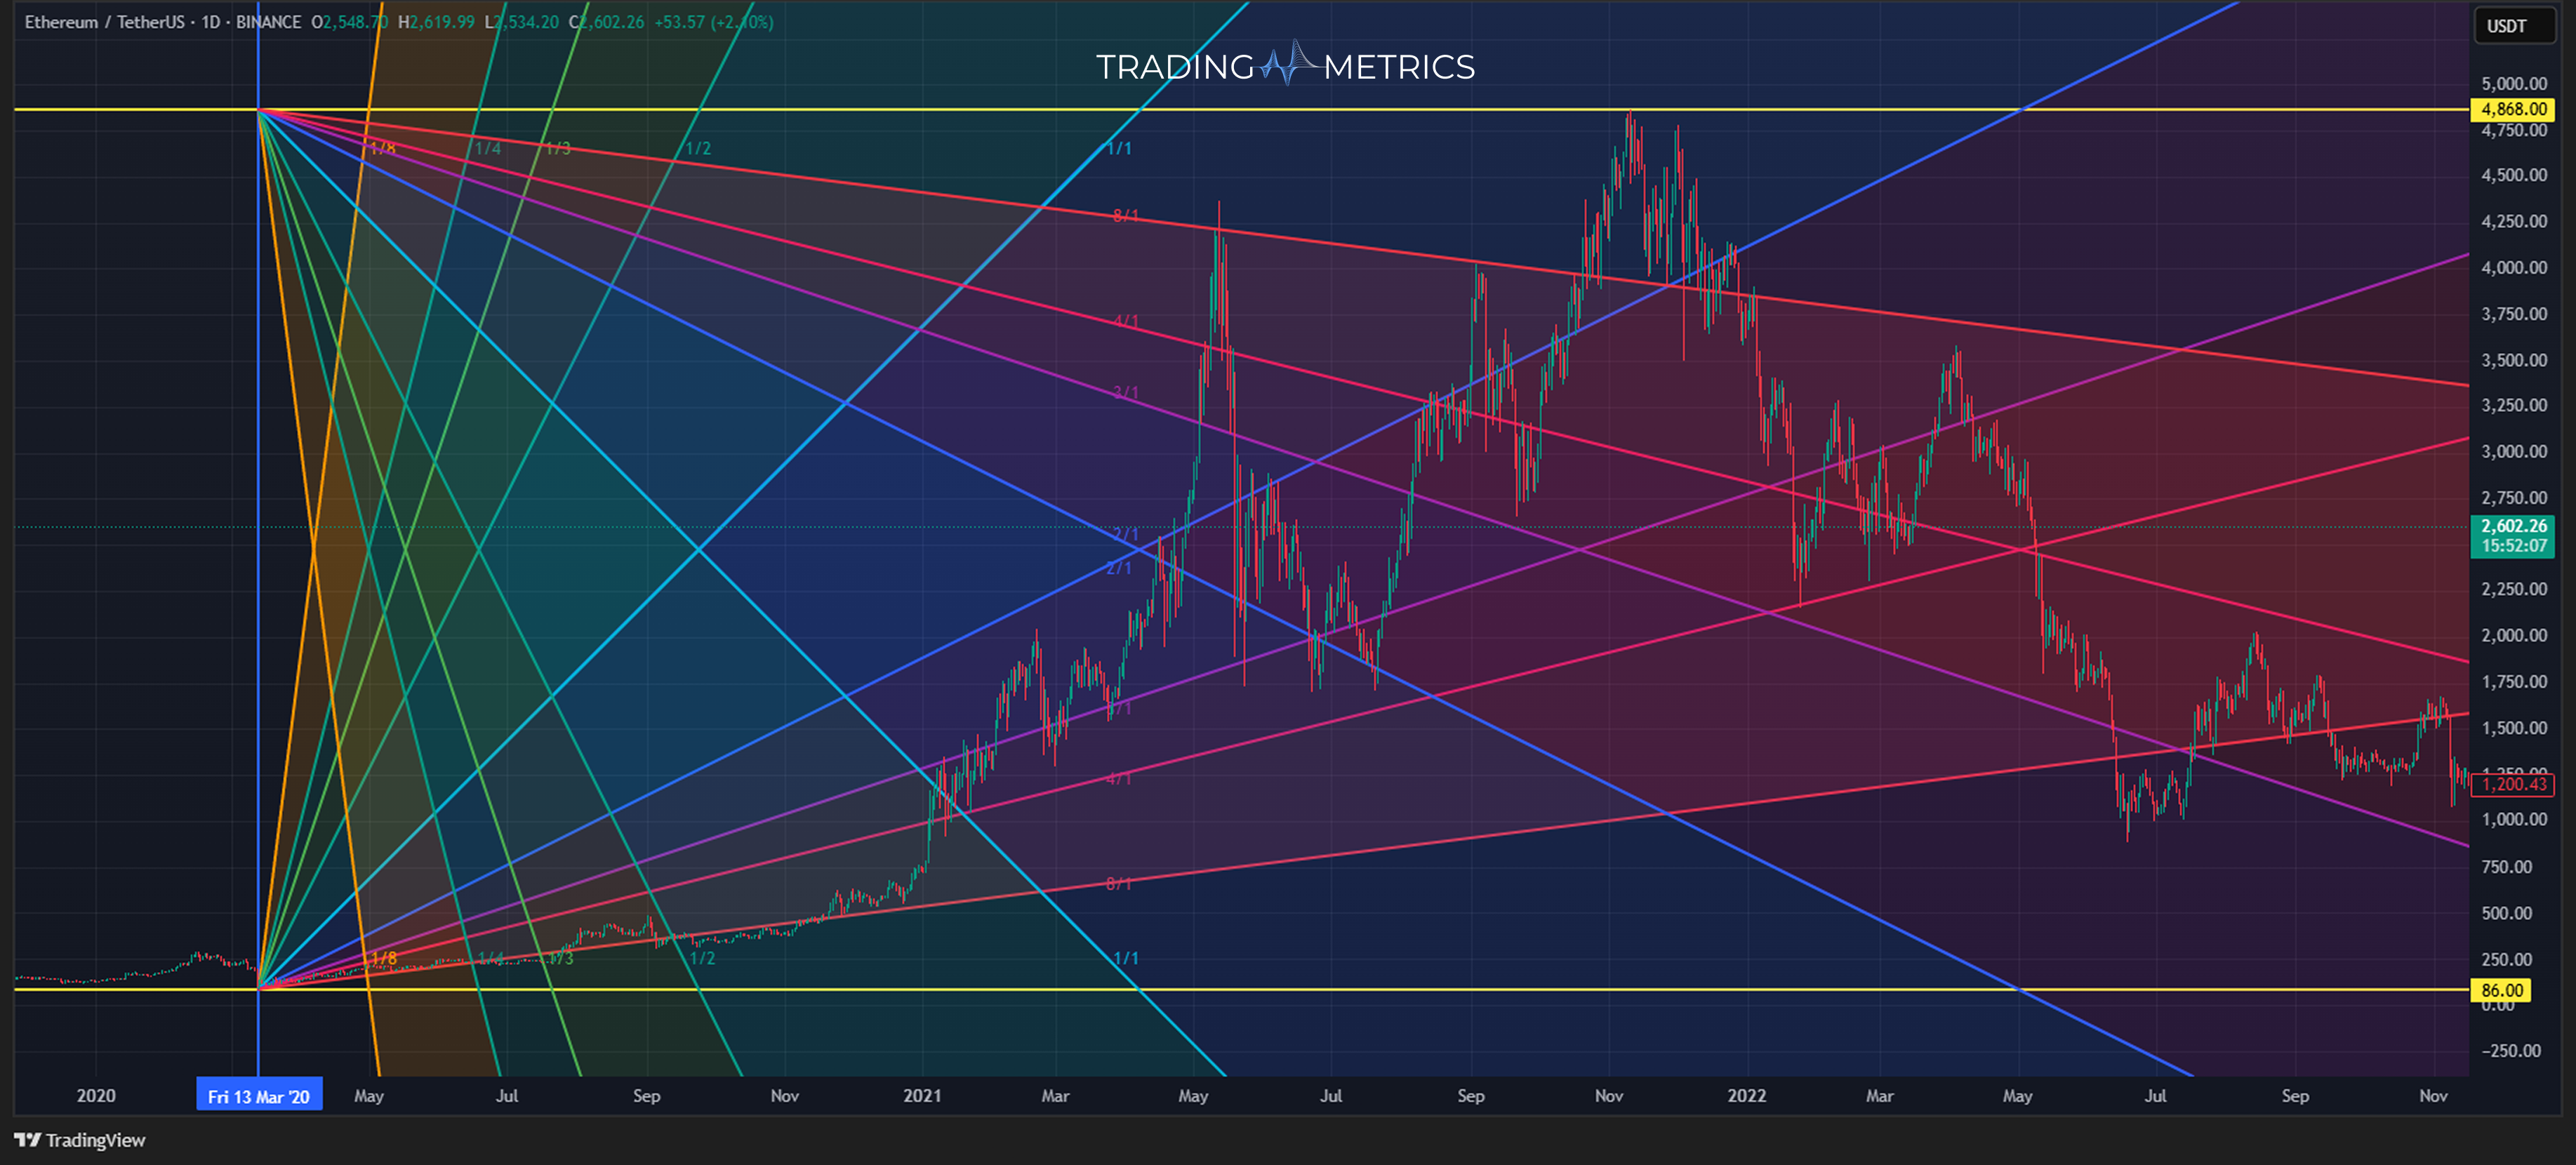
The Gann Fan is a set of lines radiating out from a central point at different angles (often 45°, 26.25°, and 63.75°). These lines are based on a one-to-one relationship between time and price. For instance, a 1x1 line (45°) represents one unit of price movement for one unit of time essentially a balanced trend. Other angles, like 2x1 or 1x2, signify stronger or weaker trends, respectively. The fan provides a framework for understanding the strength and direction of price action as time progresses.
The Gann Fan offers an analytical edge by allowing traders to understand market structure over time. Its importance lies in identifying critical points where the price may encounter resistance or support, helping traders position themselves accordingly. In fast-moving assets like cryptocurrencies, the Gann Fan can help traders stay on top of trends or anticipate key levels for buying or selling.
- Identifies Key Levels: The Gann Fan helps highlight important support and resistance levels, assisting traders in spotting potential reversal points.
- Works Across Markets: It’s versatile and can be applied to various assets, including stocks, commodities, and cryptocurrencies.
- Time and Price Harmony: Gann Fans integrate time and price, offering a structured approach to anticipate where and when trends may shift.
How to Use the Gann Fan
The Gann Fan is a powerful tool for traders who want to understand trend dynamics, anticipate key price levels, and spot potential turning points. By utilizing the angles and support/resistance lines created by this tool, you can assess the market’s direction and potential shifts in trend strength.
Here is a step-by-step guide for drawing the Gann Fan with precision:
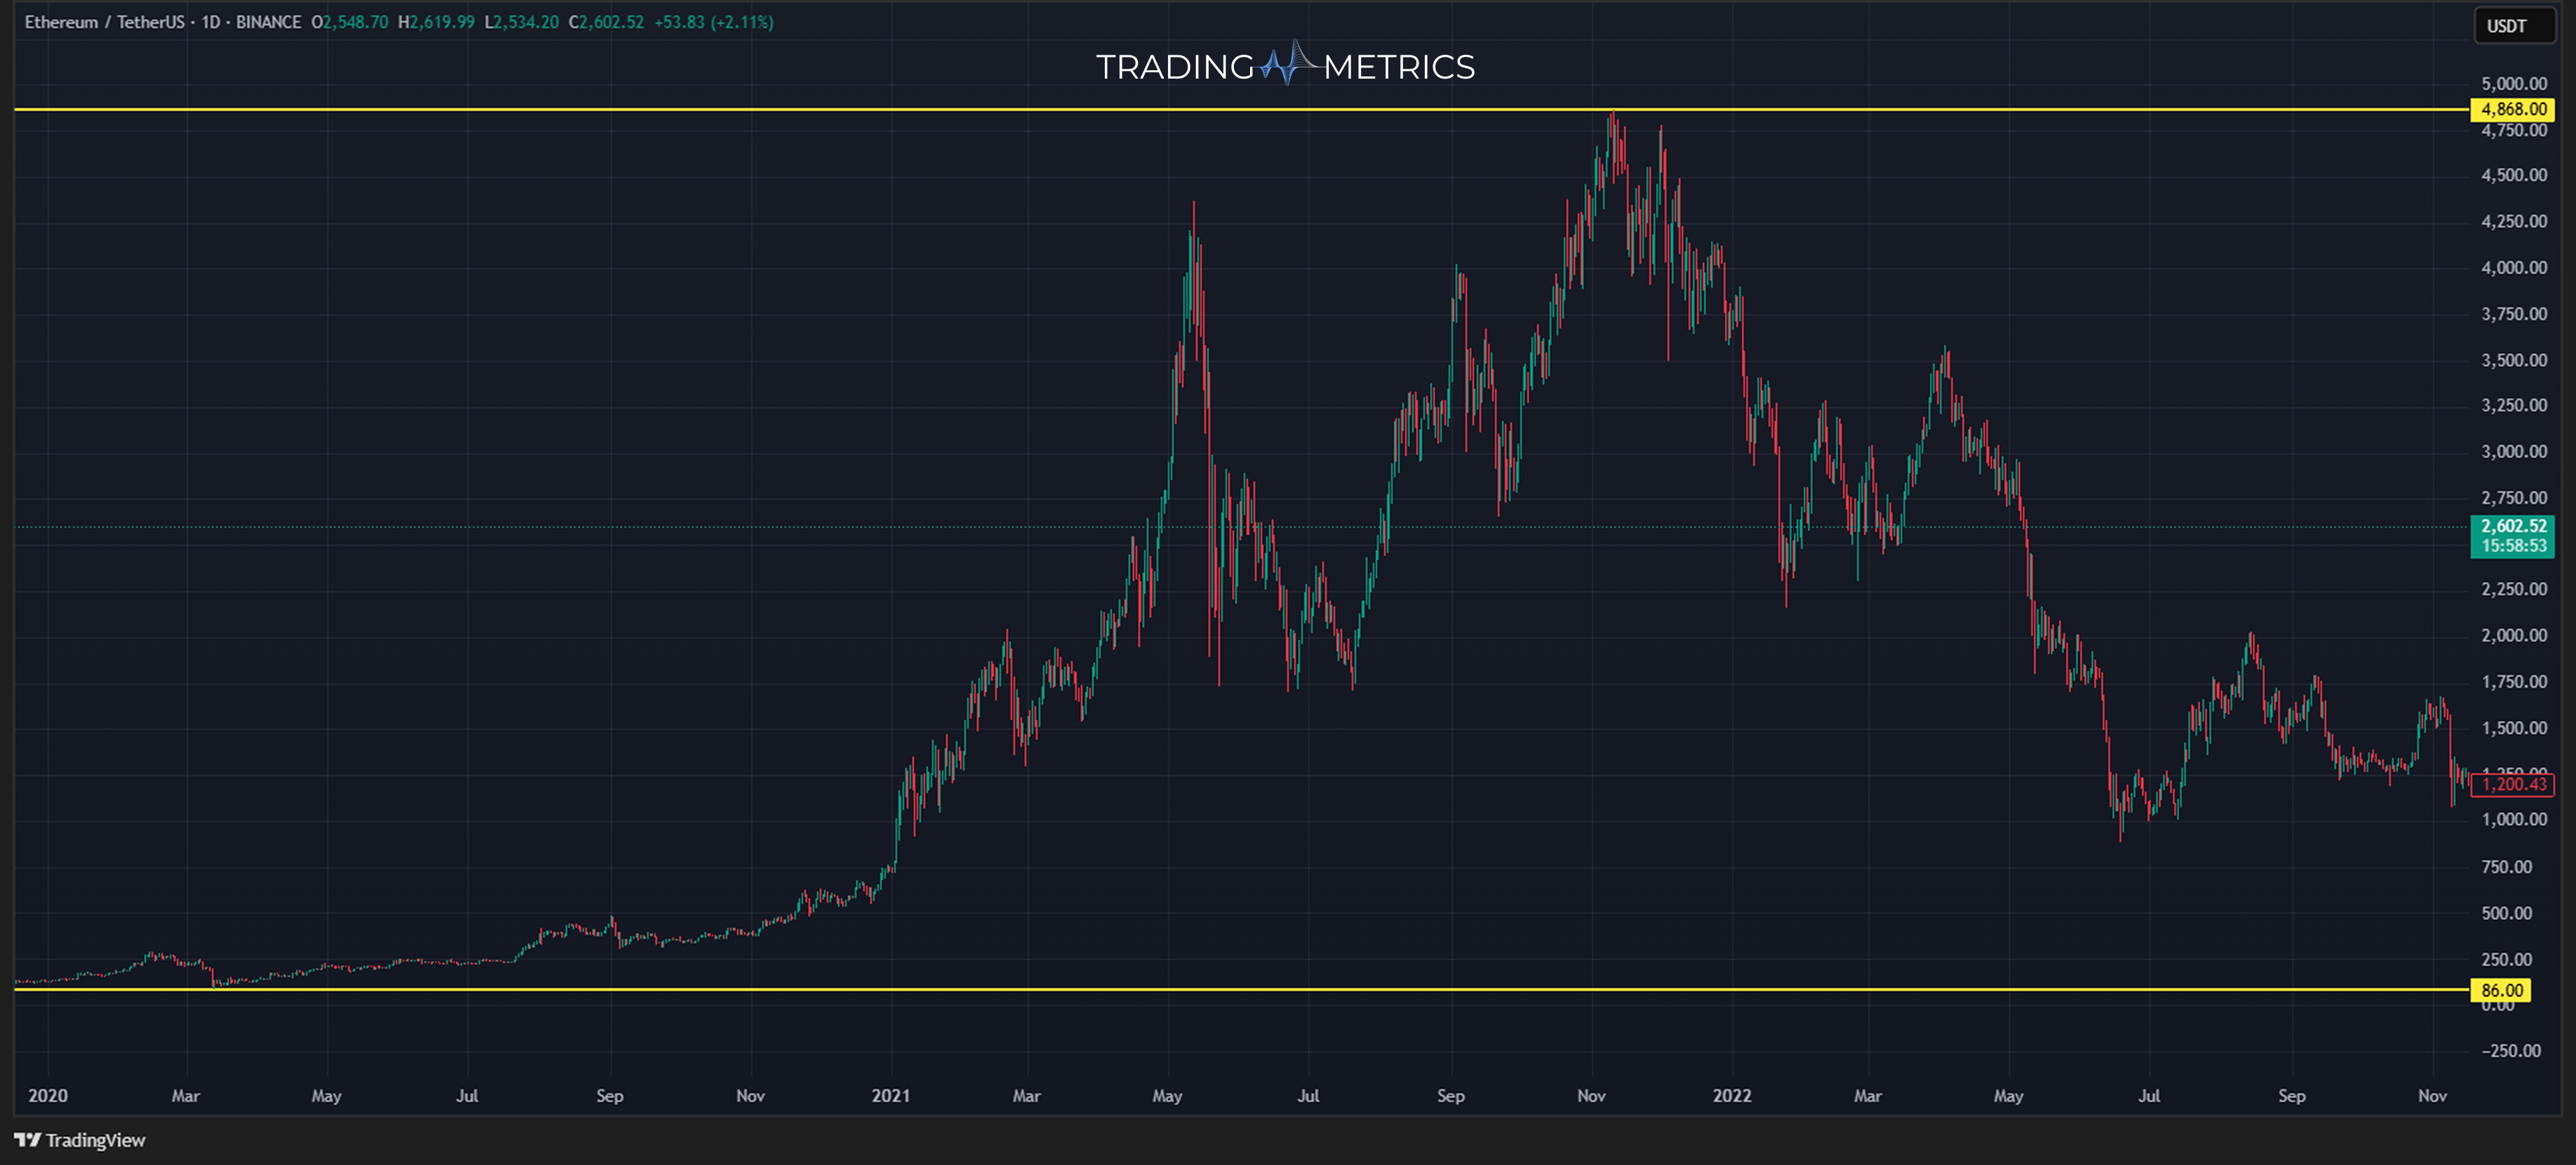
Identify the Key Pivot Point
Begin by spotting a prominent high or low on your chart. This will be your starting point. Use a low-to-high fan if the market is in an uptrend and a high-to-low fan if it’s in a downtrend.
Draw the Initial Reference Lines
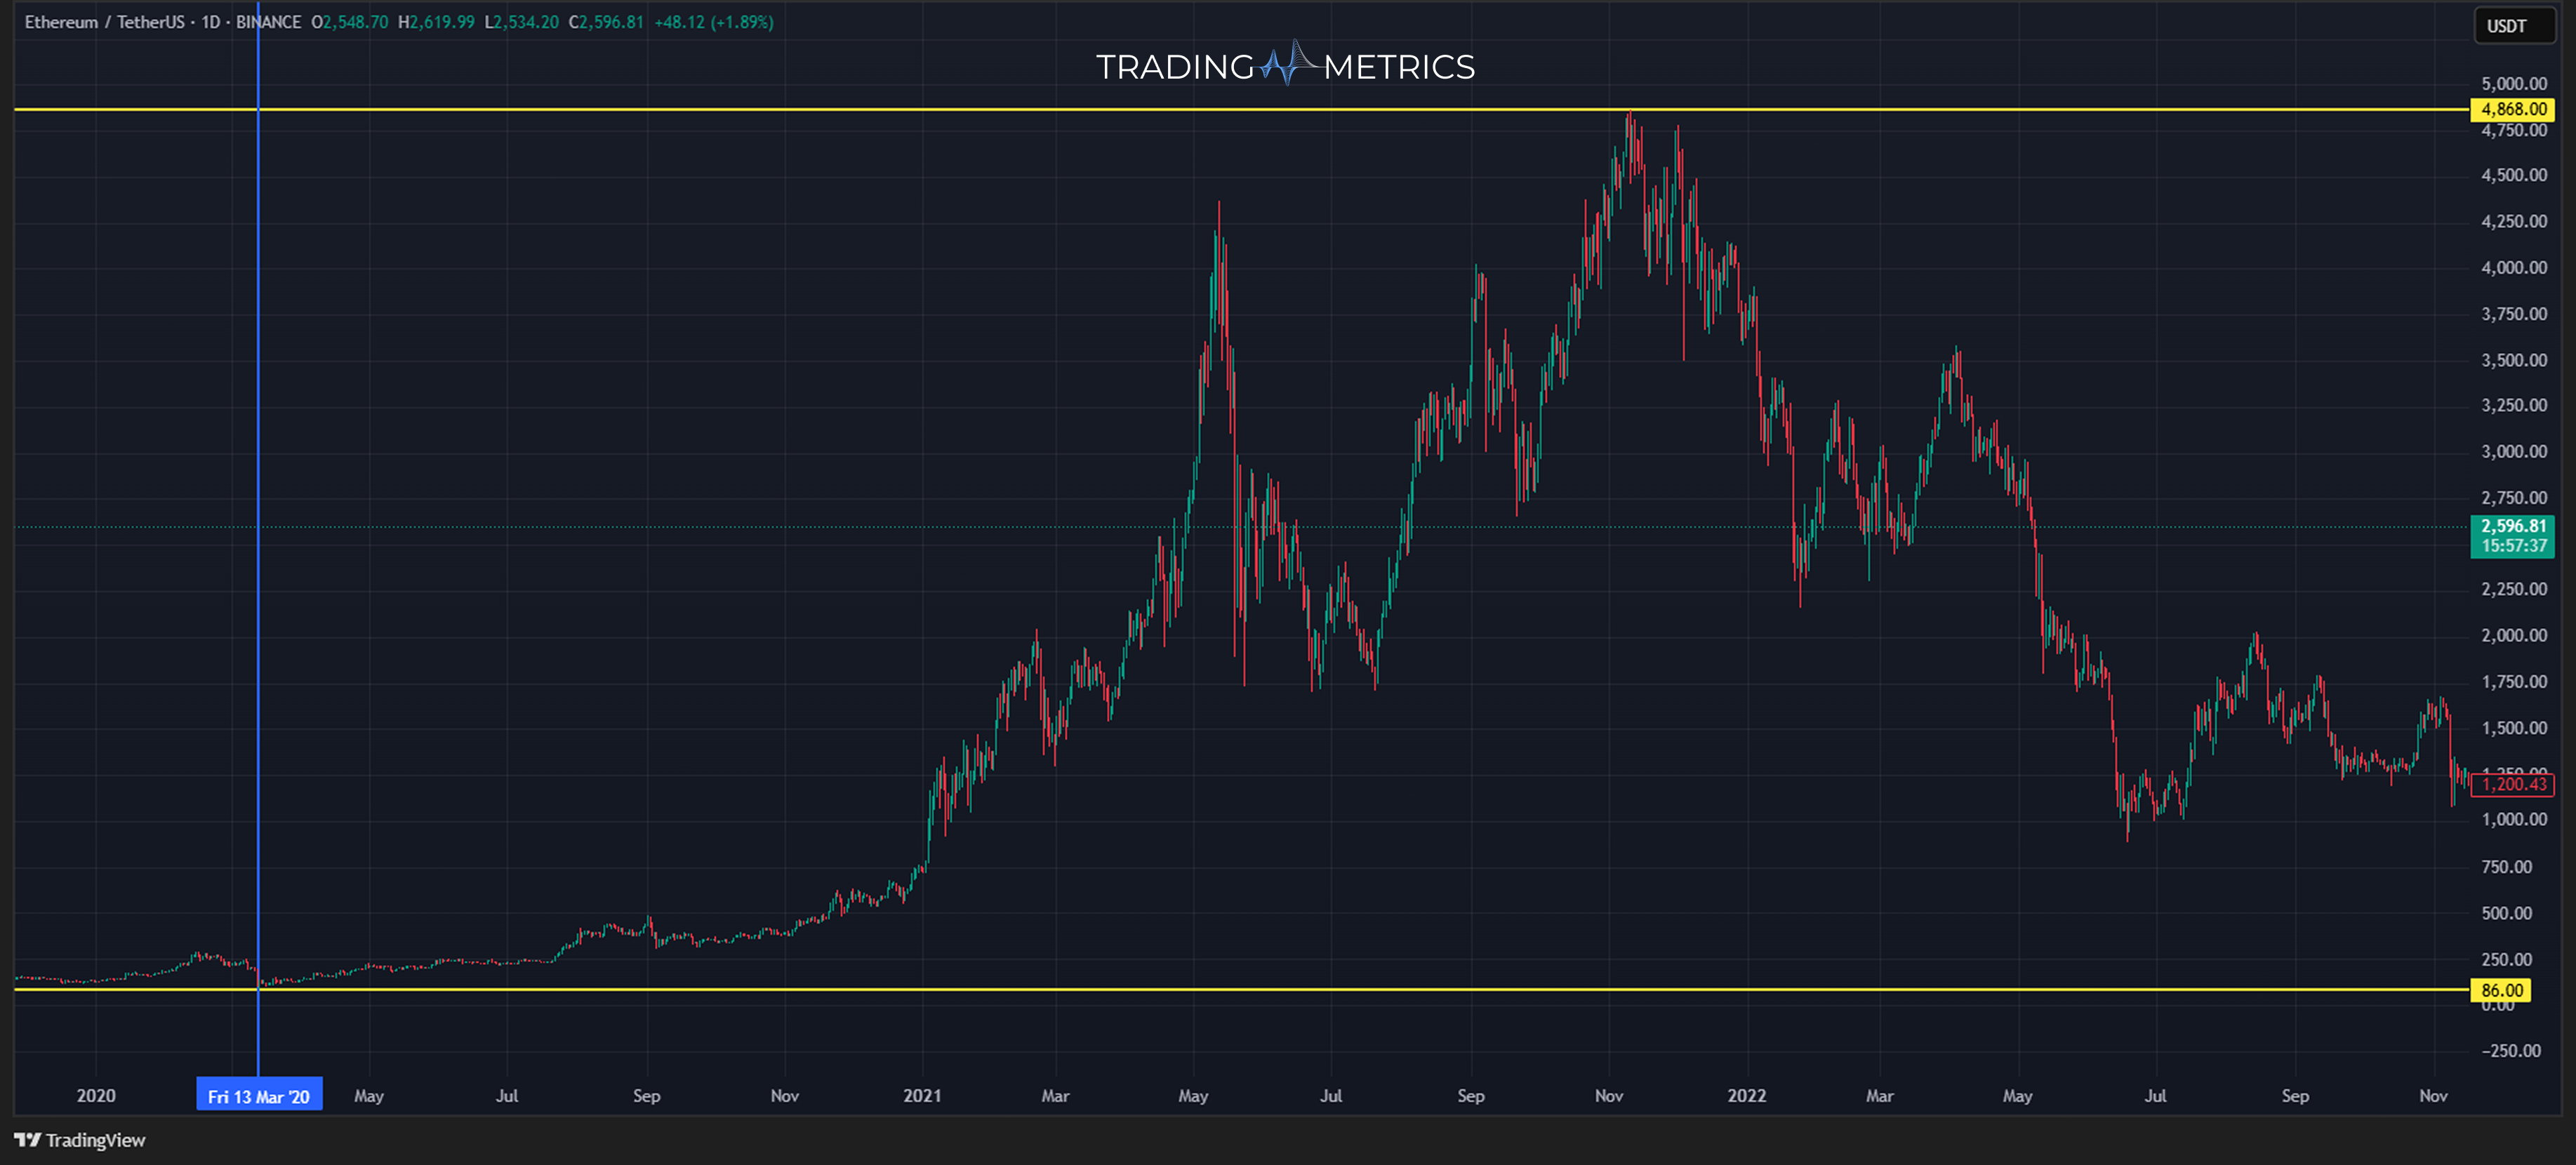
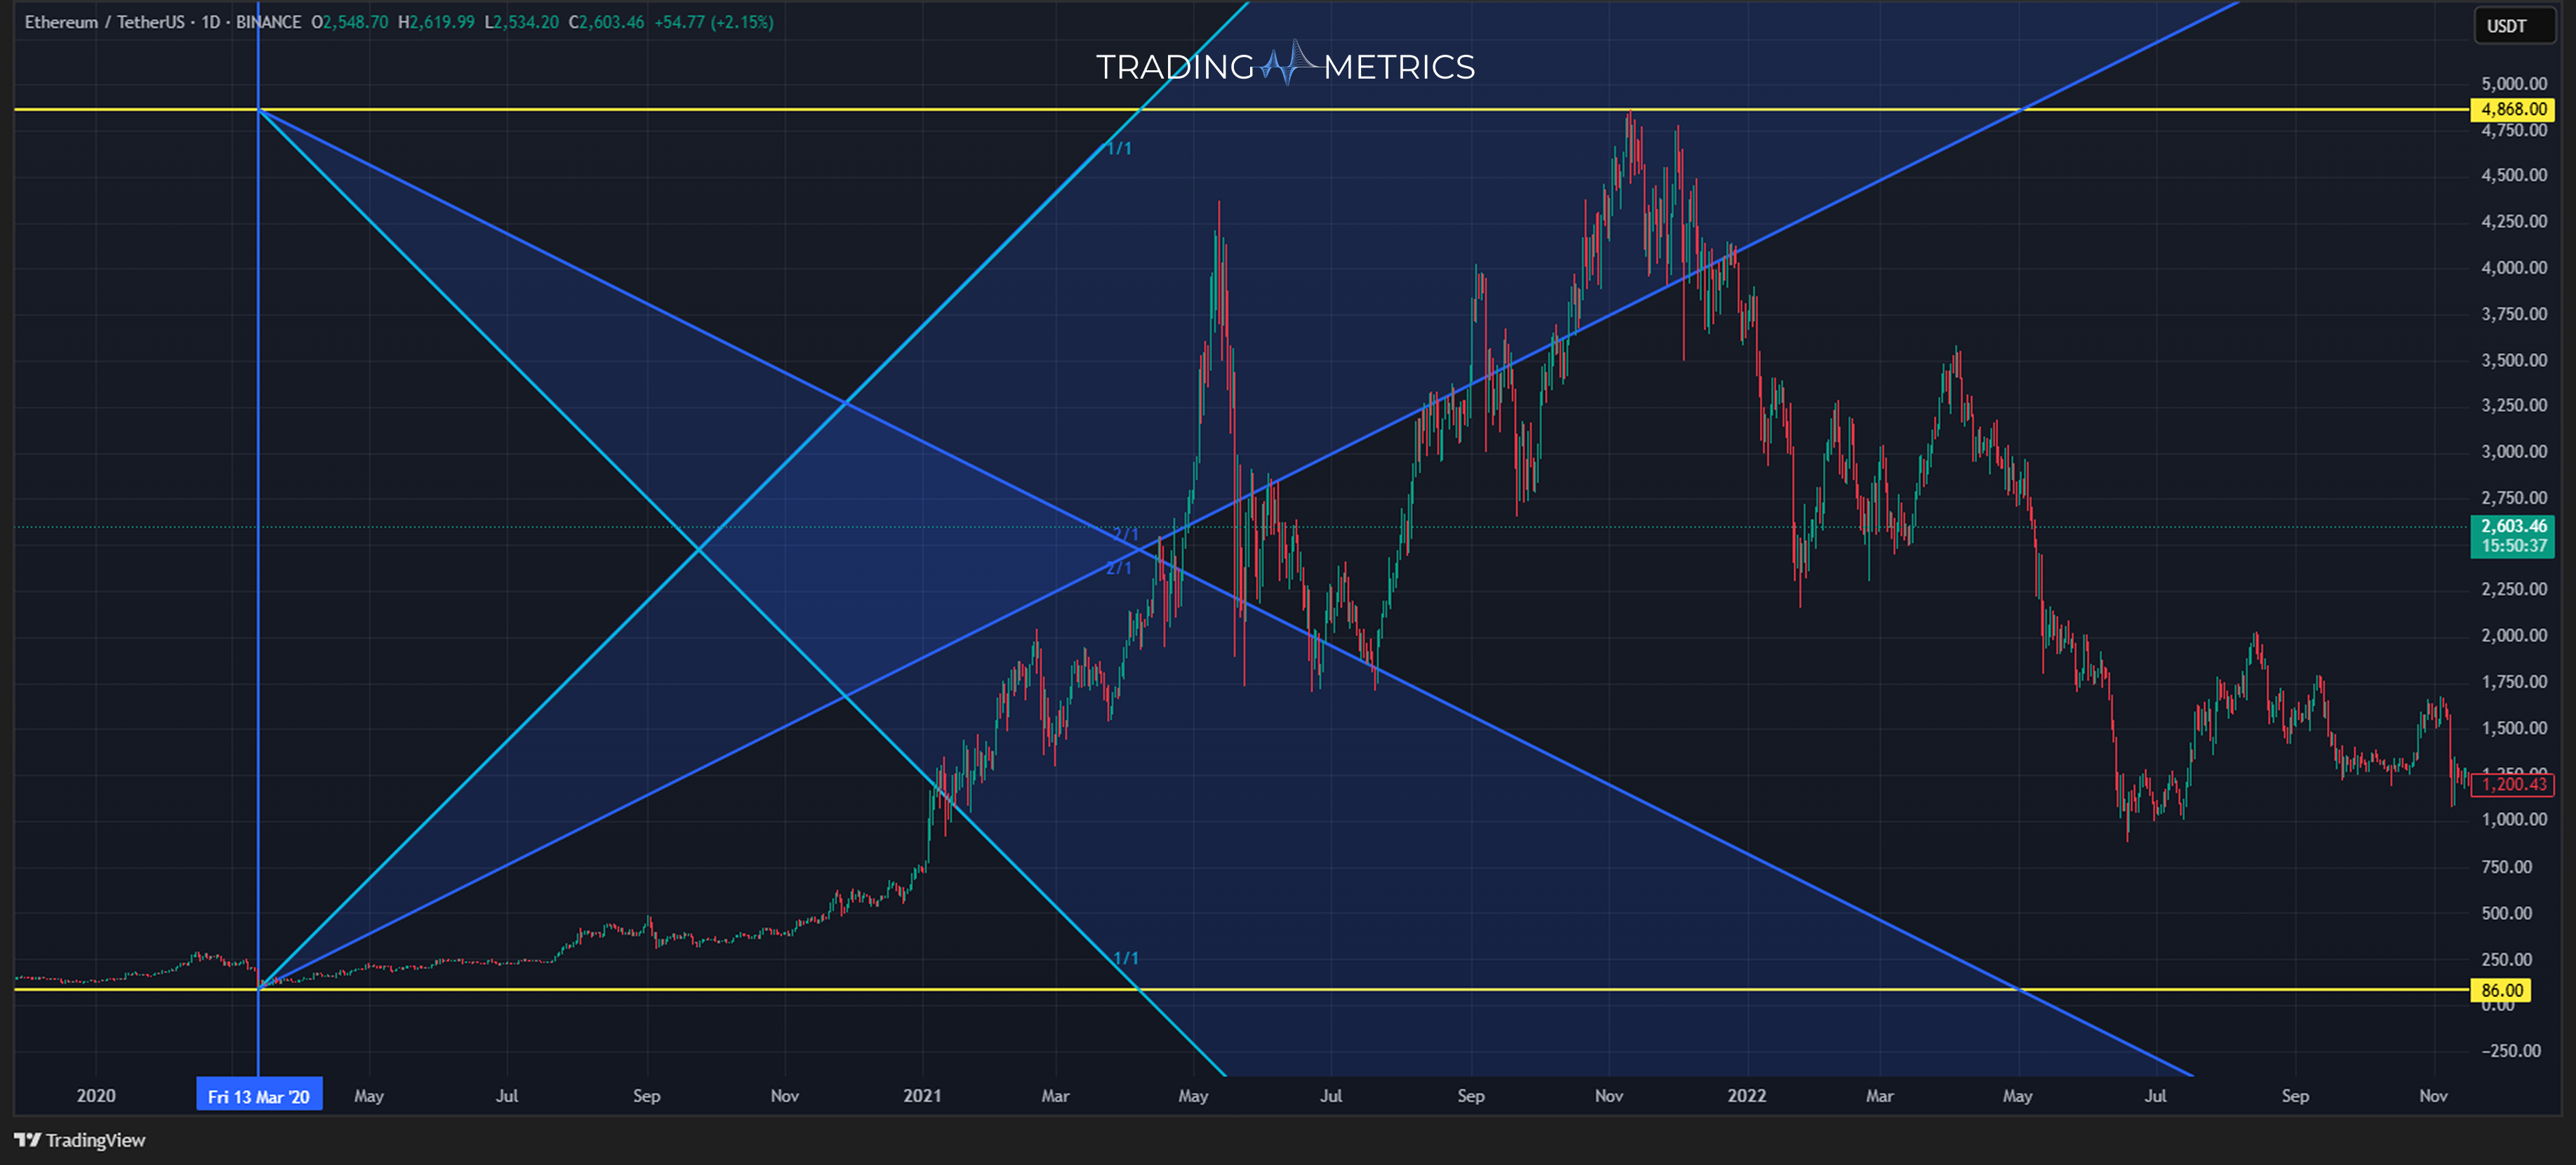
Vertical Line
Draw a vertical line from the key pivot point - from the high if you’re drawing in a downtrend, or from the low if you’re drawing in an uptrend. This line will set the reference for the time-based angle of your Gann Fan.
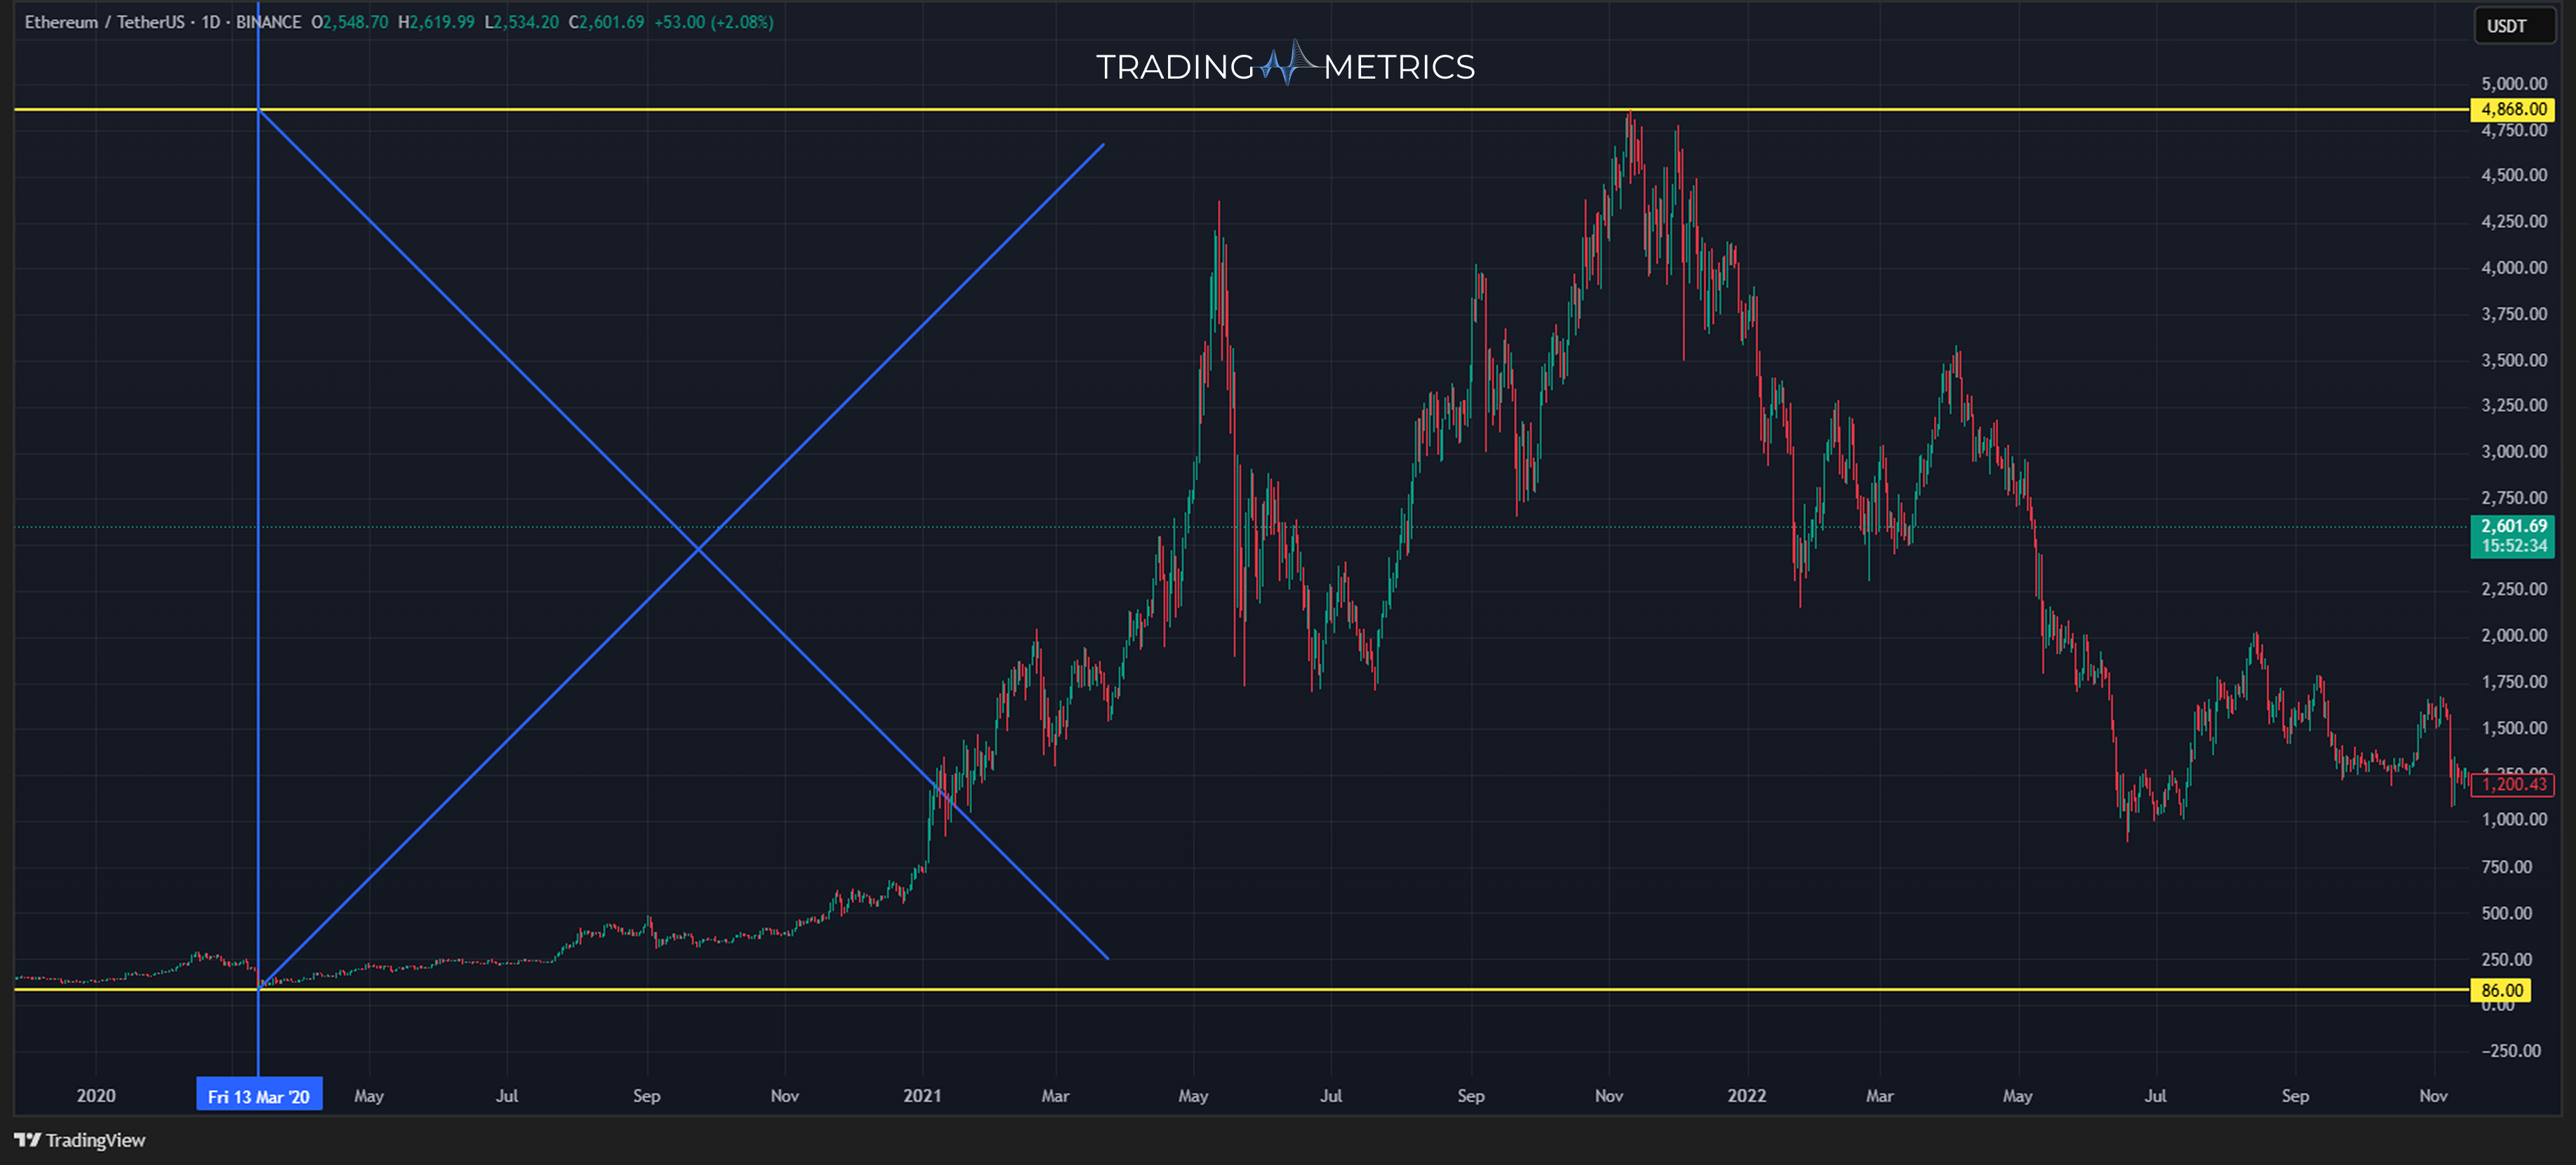
45° Angle Line
Now, create a 45° angle line from the pivot point that connects the horizontal and vertical reference lines. This 1x1 line represents the balanced rate of price movement over time, which is central to Gann analysis.
Add the Gann Fan Tool
Align the Gann Fan
Place the Gann Fan on your chart, aligning the 1x1 line to match the 45° angle line you drew. This ensures that the fan’s 1x1 line perfectly reflects the balance between time and price movement on your chart.
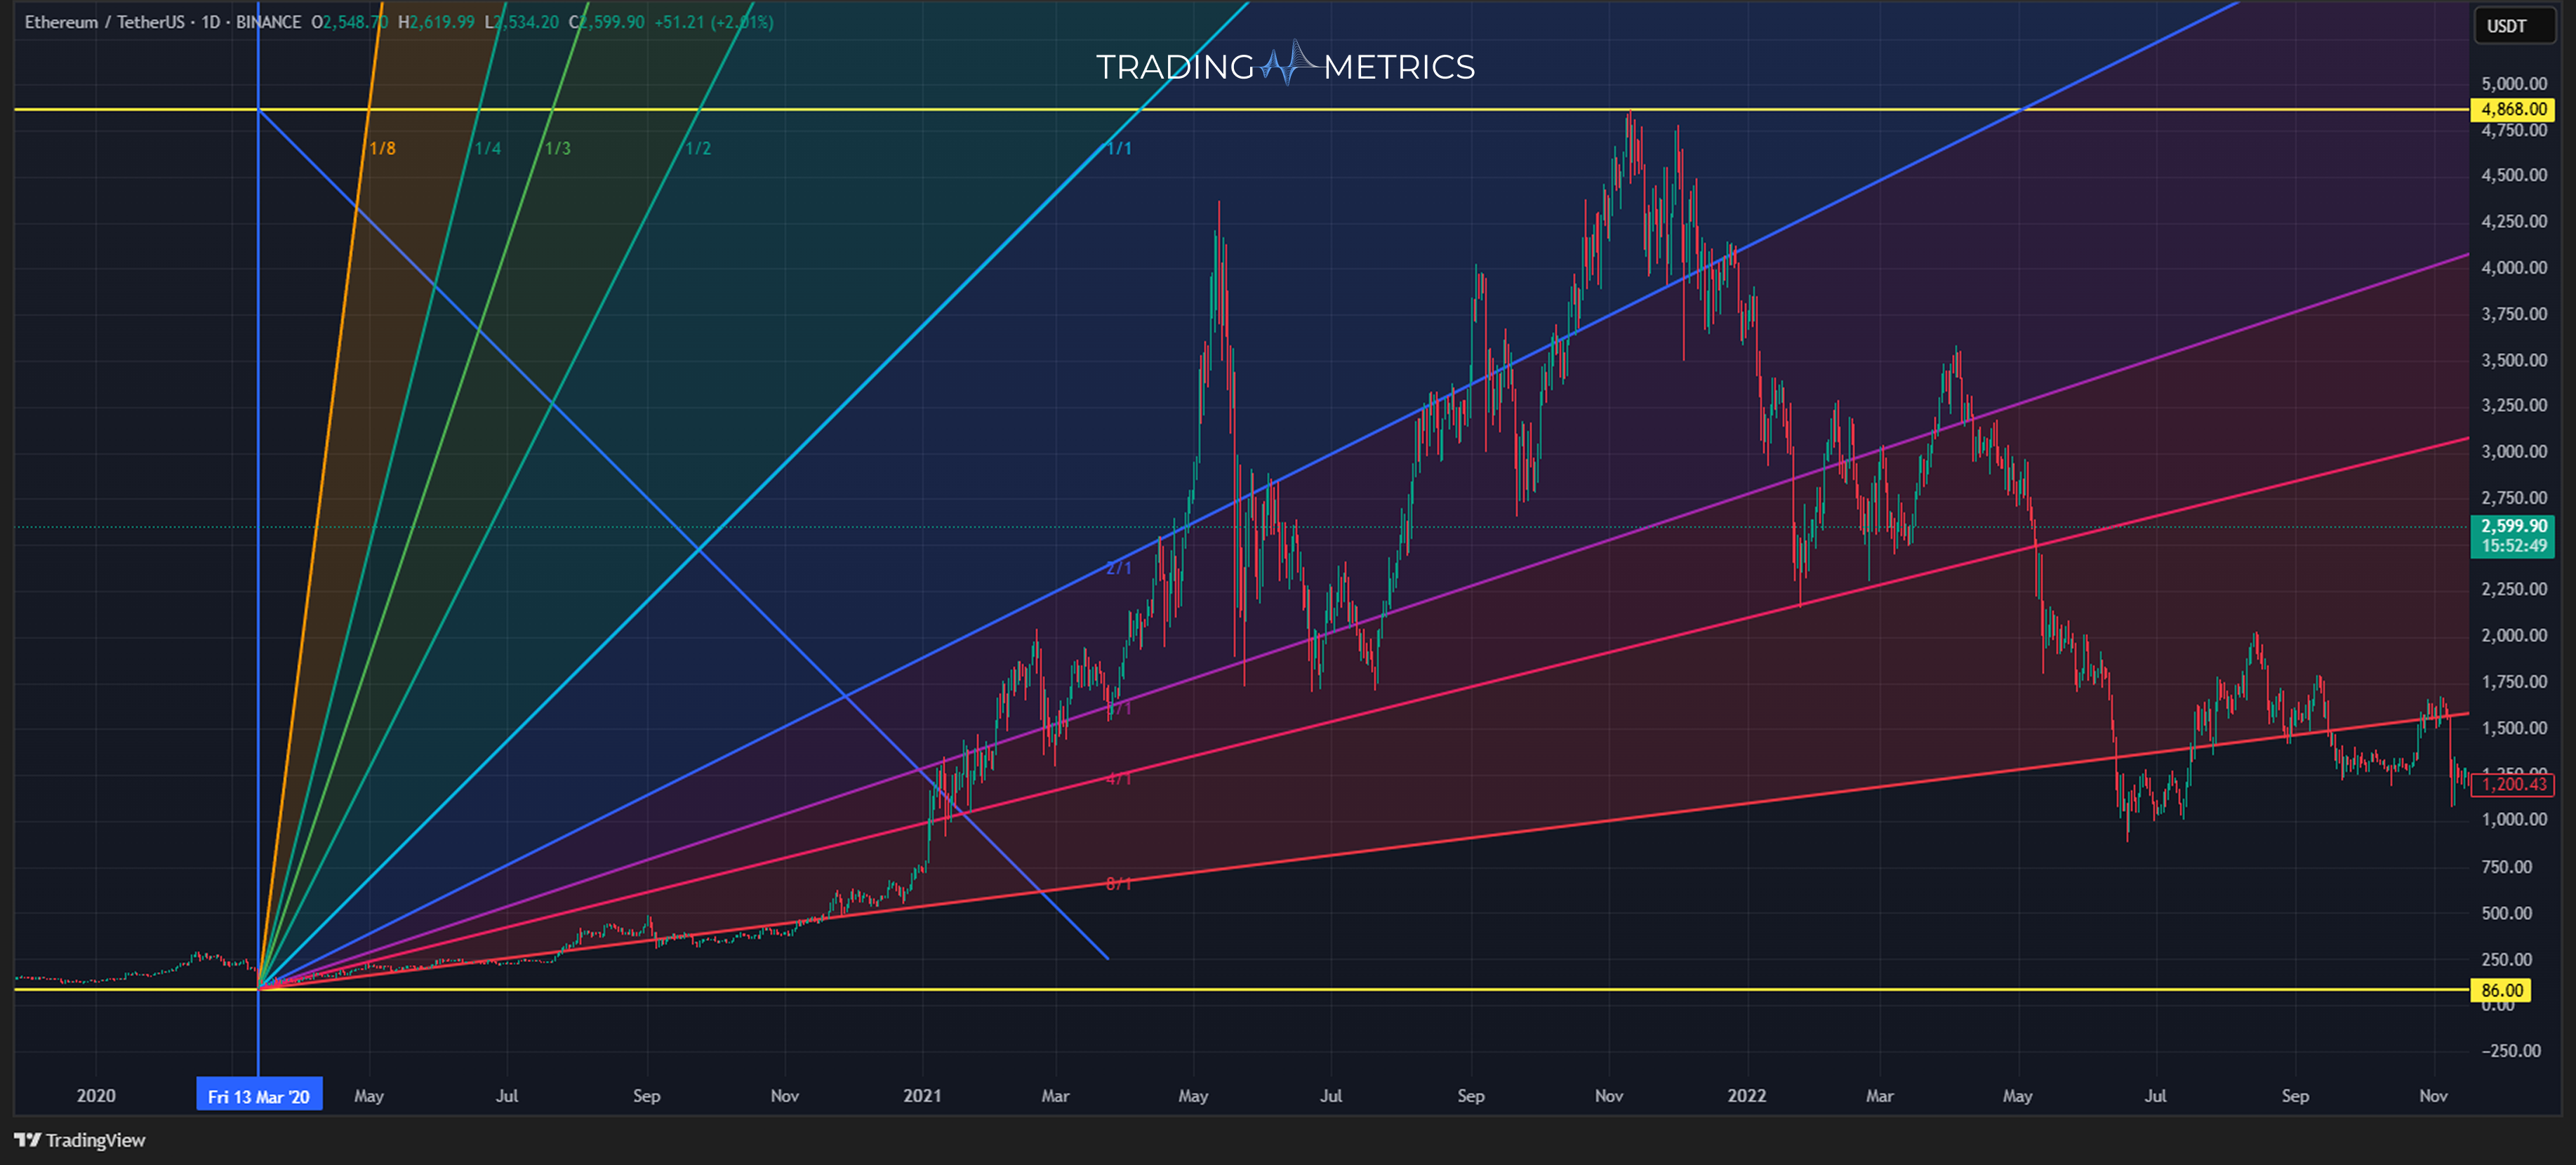
Additional Gann Fan
The additional angles in the fan (such as 2x1, 3x1, 1x2) will now automatically extend from your pivot point, creating potential support and resistance levels.
Observe Price and Fan Line Interactions
Watch Key Levels
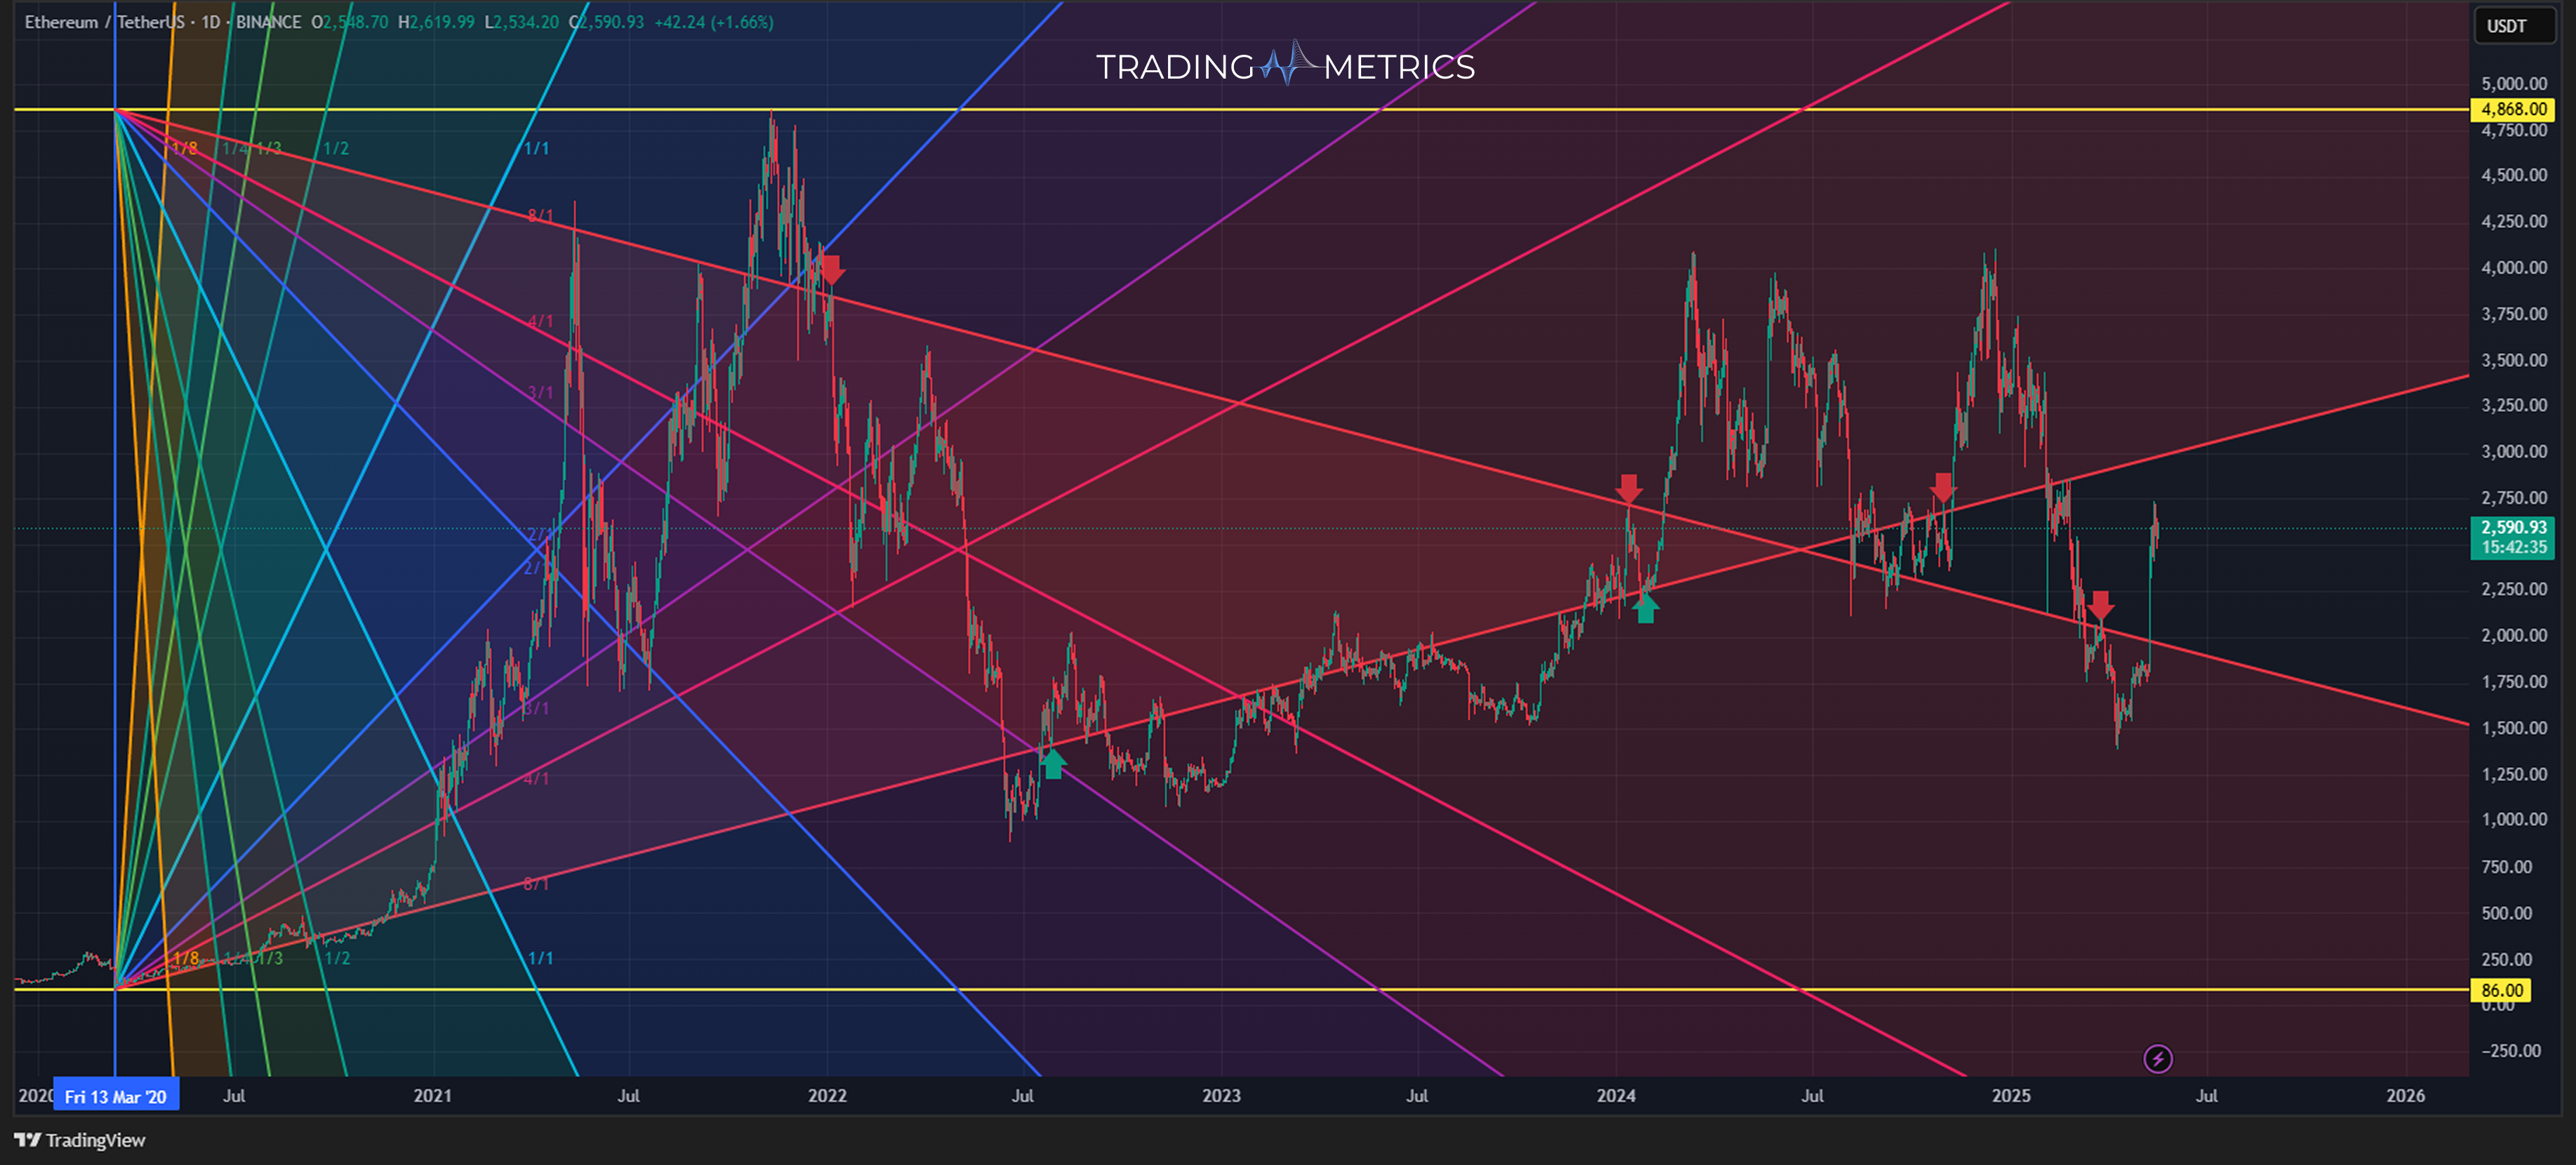
Now that the fan is in place, observe how price interacts with each angle. Lines like the 1x1 or 2x1 often act as strong support or resistance levels, where price may bounce or reverse.
Interpret Breaks and Bounces
When price respects a fan line and bounces, it reinforces the trend. However, if price breaks through a line, it can signal a shift in trend strength or even a reversal.
The Gann Fan offers unique insights into time-price relationships, helping traders anticipate trend shifts and strategically place trades.
- Subject to Interpretation: Placing the Gann Fan accurately requires skill, and slight misalignment can impact the reliability of the levels.
- Complexity for Beginners: Gann Fans can be difficult to understand and apply correctly without experience, limiting accessibility for new traders.
- Requires Other Confirmation Tools: The Gann Fan is often most effective when combined with other indicators, as it may generate false signals in isolation.
Combine with Confirmation: Always confirm Gann Fan signals with other indicators, such as Fibonacci levels or volume.
Combining Gann Fan with Other Tools for More Insight
The Gann Fan can be even more effective when combined with other trading tools, such as:
- Fibonacci Retracement: Fibonacci levels add extra confirmation. When a Gann Fan line aligns with a Fibonacci Retracement level, that area often holds strong support or resistance.
- Volume Analysis: Volume spikes at Gann Fan lines can indicate the validity of support or resistance.
- Moving Averages: A crossover of a moving average and a Gann Fan line can confirm trend direction.
- Trendlines: Overlaying trendlines with the Gann Fan offers a stronger context for where price action may face pressure or support.
Use Multiple Timeframes: Try applying Gann Fans on different timeframes for a comprehensive view of potential support and resistance.
Key Points
- Trend and Time Analysis Tool: Gann Fan uses a series of angled lines based on price and time ratios to identify potential support and resistance levels.
- Geometric Approach: Built on the concept that price and time move in predictable geometric proportions, with the most notable line being the 1x1 angle (45 degrees).
- Multiple Angles: Common angles include 1x8, 1x4, 1x3, 1x2, 1x1, 2x1, 3x1, 4x1, and 8x1, each representing a specific slope that can influence price behavior.
- Support and Resistance: Price often reacts at Gann Fan lines, with breaks signaling potential trend changes and bounces indicating continuation.
- Trend Strength Measurement: Steeper angles (e.g., 2x1) suggest stronger trends, while shallower angles (e.g., 1x2) indicate slower momentum.
- Confluence Zones: When Gann Fan lines align with horizontal support/resistance or other technical tools, the significance of the level increases.
- Adaptable Across Timeframes: Works on intraday, daily, and weekly charts, allowing traders to analyze short-term and long-term market structures.
- Combination with Other Tools: Often used with EMA, Fibonacci Retracements, and price patterns to confirm setups.
- Scaling Matters: Correct scaling of price and time is critical; incorrect chart scaling can distort the accuracy of Gann angles.
- Backtesting and Fine-Tuning: Apply historical testing to validate how well Gann Fan lines have predicted support/resistance in the chosen market and timeframe.
Conclusion
The Gann Fan is a fantastic tool for forecasting price action over time. It not only offers insight into trend strength but also helps pinpoint potential reversal points. Whether trading BTC, stocks, or any other asset, the Gann Fan remains a powerful addition to any trader’s toolkit.
Frequently Asked Questions
Quick answers based on this page's topic.
The Gann Fan consists of nine angles, with the 1x1 (45-degree) angle being the most significant. An asset trading above the 1x1 line is considered in a strong bull market, while trading below it indicates sustained bearish sentiment and potential further downside.
To draw a Gann Fan, you must anchor it to a significant pivot high or low. The key is ensuring the 1x1 angle aligns with the market's natural rhythm; if the angle is too steep or shallow, the support and resistance projections will be inaccurate.
Traders use the Gann Fan because it provides a dynamic view of trend strength. As price moves between the different 'fan blades,' it offers clear signals for when a trend is accelerating, slowing down, or nearing a major breakdown of support.