Max Drawdown (MDD): Peak-to-Trough Loss and Resilience
Max Drawdown (MDD) is a crucial metric in the world of trading and investment, often used to assess the risk of an investment strategy. It measures the largest peak-to-trough decline in the value of a portfolio, providing insight into potential losses an investor might face. Let’s delve into the details with a touch of real-world relevance, specifically focusing on trading Bitcoin.
Drawdowns test your discipline more than any other aspect of trading. Staying rational during a drawdown is what separates professionals from amateurs.
- Brett N. Steenbarger
How to Calculate Max Drawdown?
Mathematically, Maximum Drawdown (MDD) is defined as:
Where:
- Peak Value is the highest value of the portfolio before the drawdown begins.
- Trough Value is the lowest value of the portfolio during the drawdown.
- The result is typically expressed as a percentage.
Tip: A high max drawdown often signals excessive risk-taking. Use it as a reality check for your strategy’s risk tolerance.
Importance of Max Drawdown in Trading
Max drawdown is a important metric for evaluating the risk associated with a trading strategy or portfolio. It measures the largest peak-to-trough decline, highlighting the worst-case loss an investor could face before a recovery. Understanding max drawdown helps traders assess whether a strategy aligns with their risk tolerance and capital preservation goals. It is a key factor in comparing strategies, as a lower drawdown often indicates more consistent performance and reduced risk. Incorporating max drawdown analysis into risk management ensures traders are prepared for adverse market conditions and can maintain discipline during challenging periods.
Case Studies
The following case studies provide real-world insights into max drawdown during periods of significant market volatility. These examples highlight how adverse market conditions can affect portfolios, emphasizing the importance of understanding and managing drawdown risk. Each scenario illustrates the practical application of max drawdown calculations, offering valuable lessons for traders and investors navigating similar challenges.
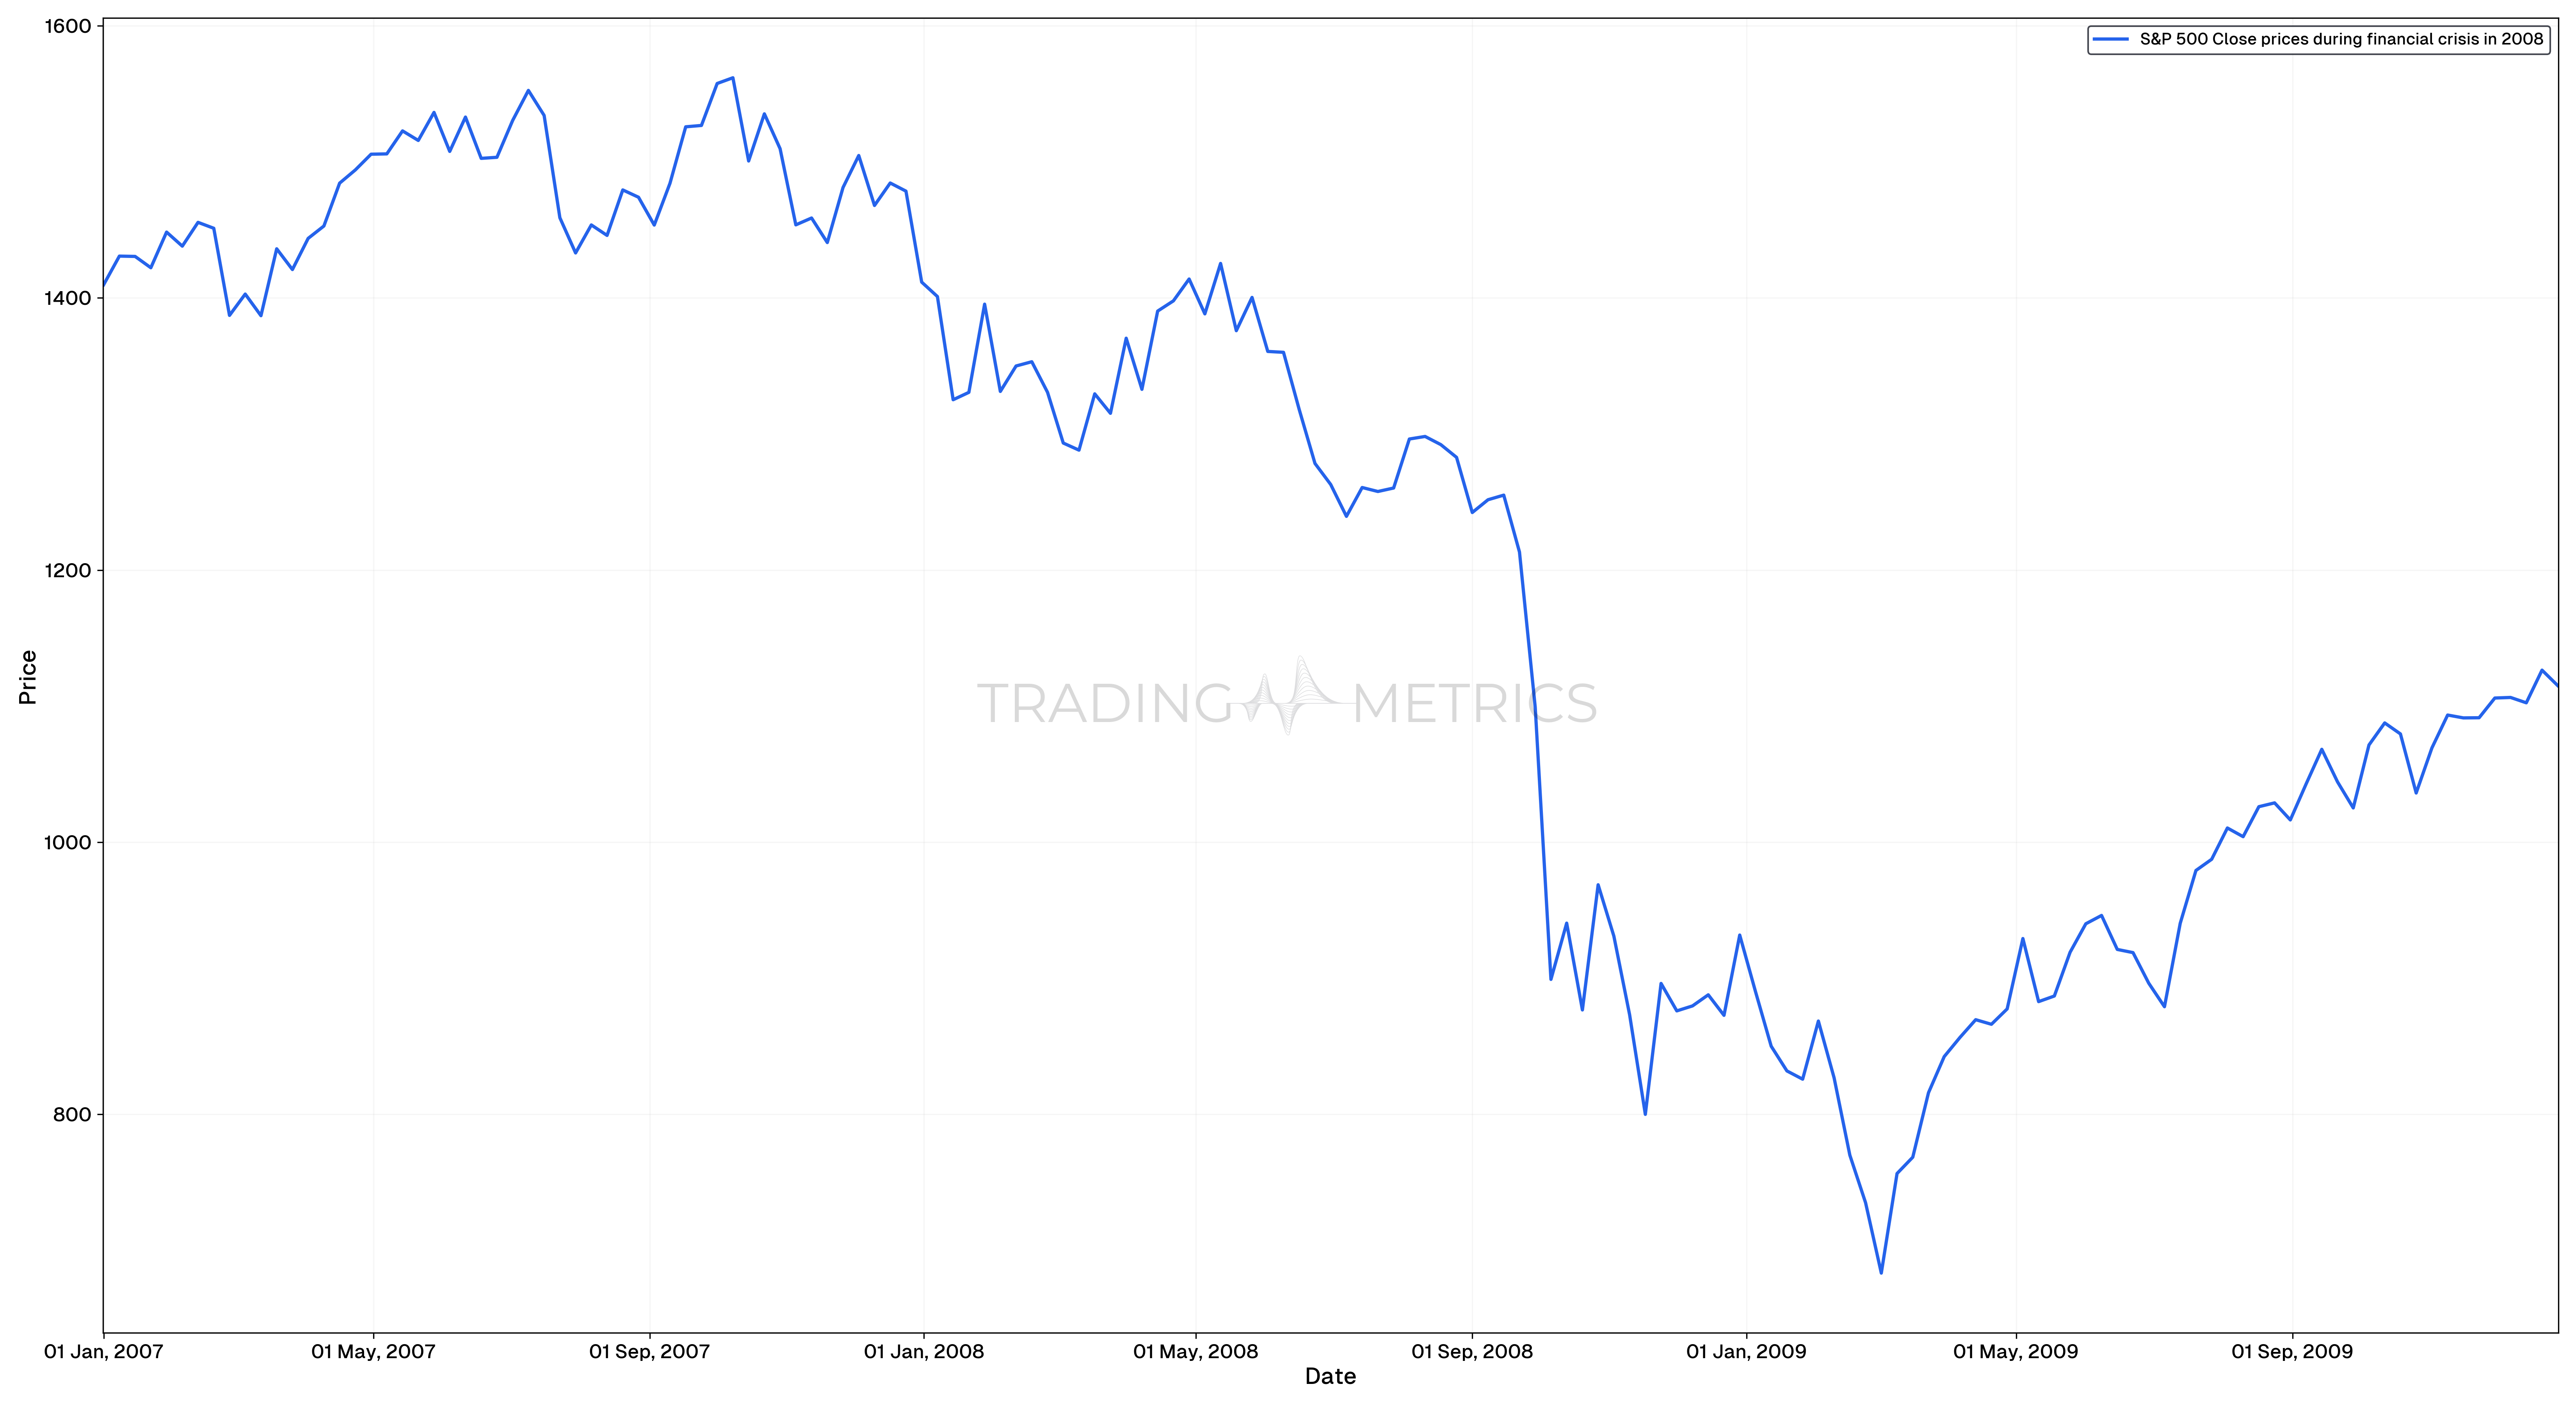
The 2008 Financial Crisis
The 2008 financial crisis is an excellent case study for understanding max drawdown. During this period, major indices like the S&P 500 experienced severe declines. Let’s consider a hypothetical portfolio invested in the S&P 500 at the peak of the market.
At its peak in October 2007, the value of the S&P 500 was 1561.80. However, by March 2009, it had dropped to 683.38.
This 56.3% drawdown highlights the significant risk investors faced during the crisis.
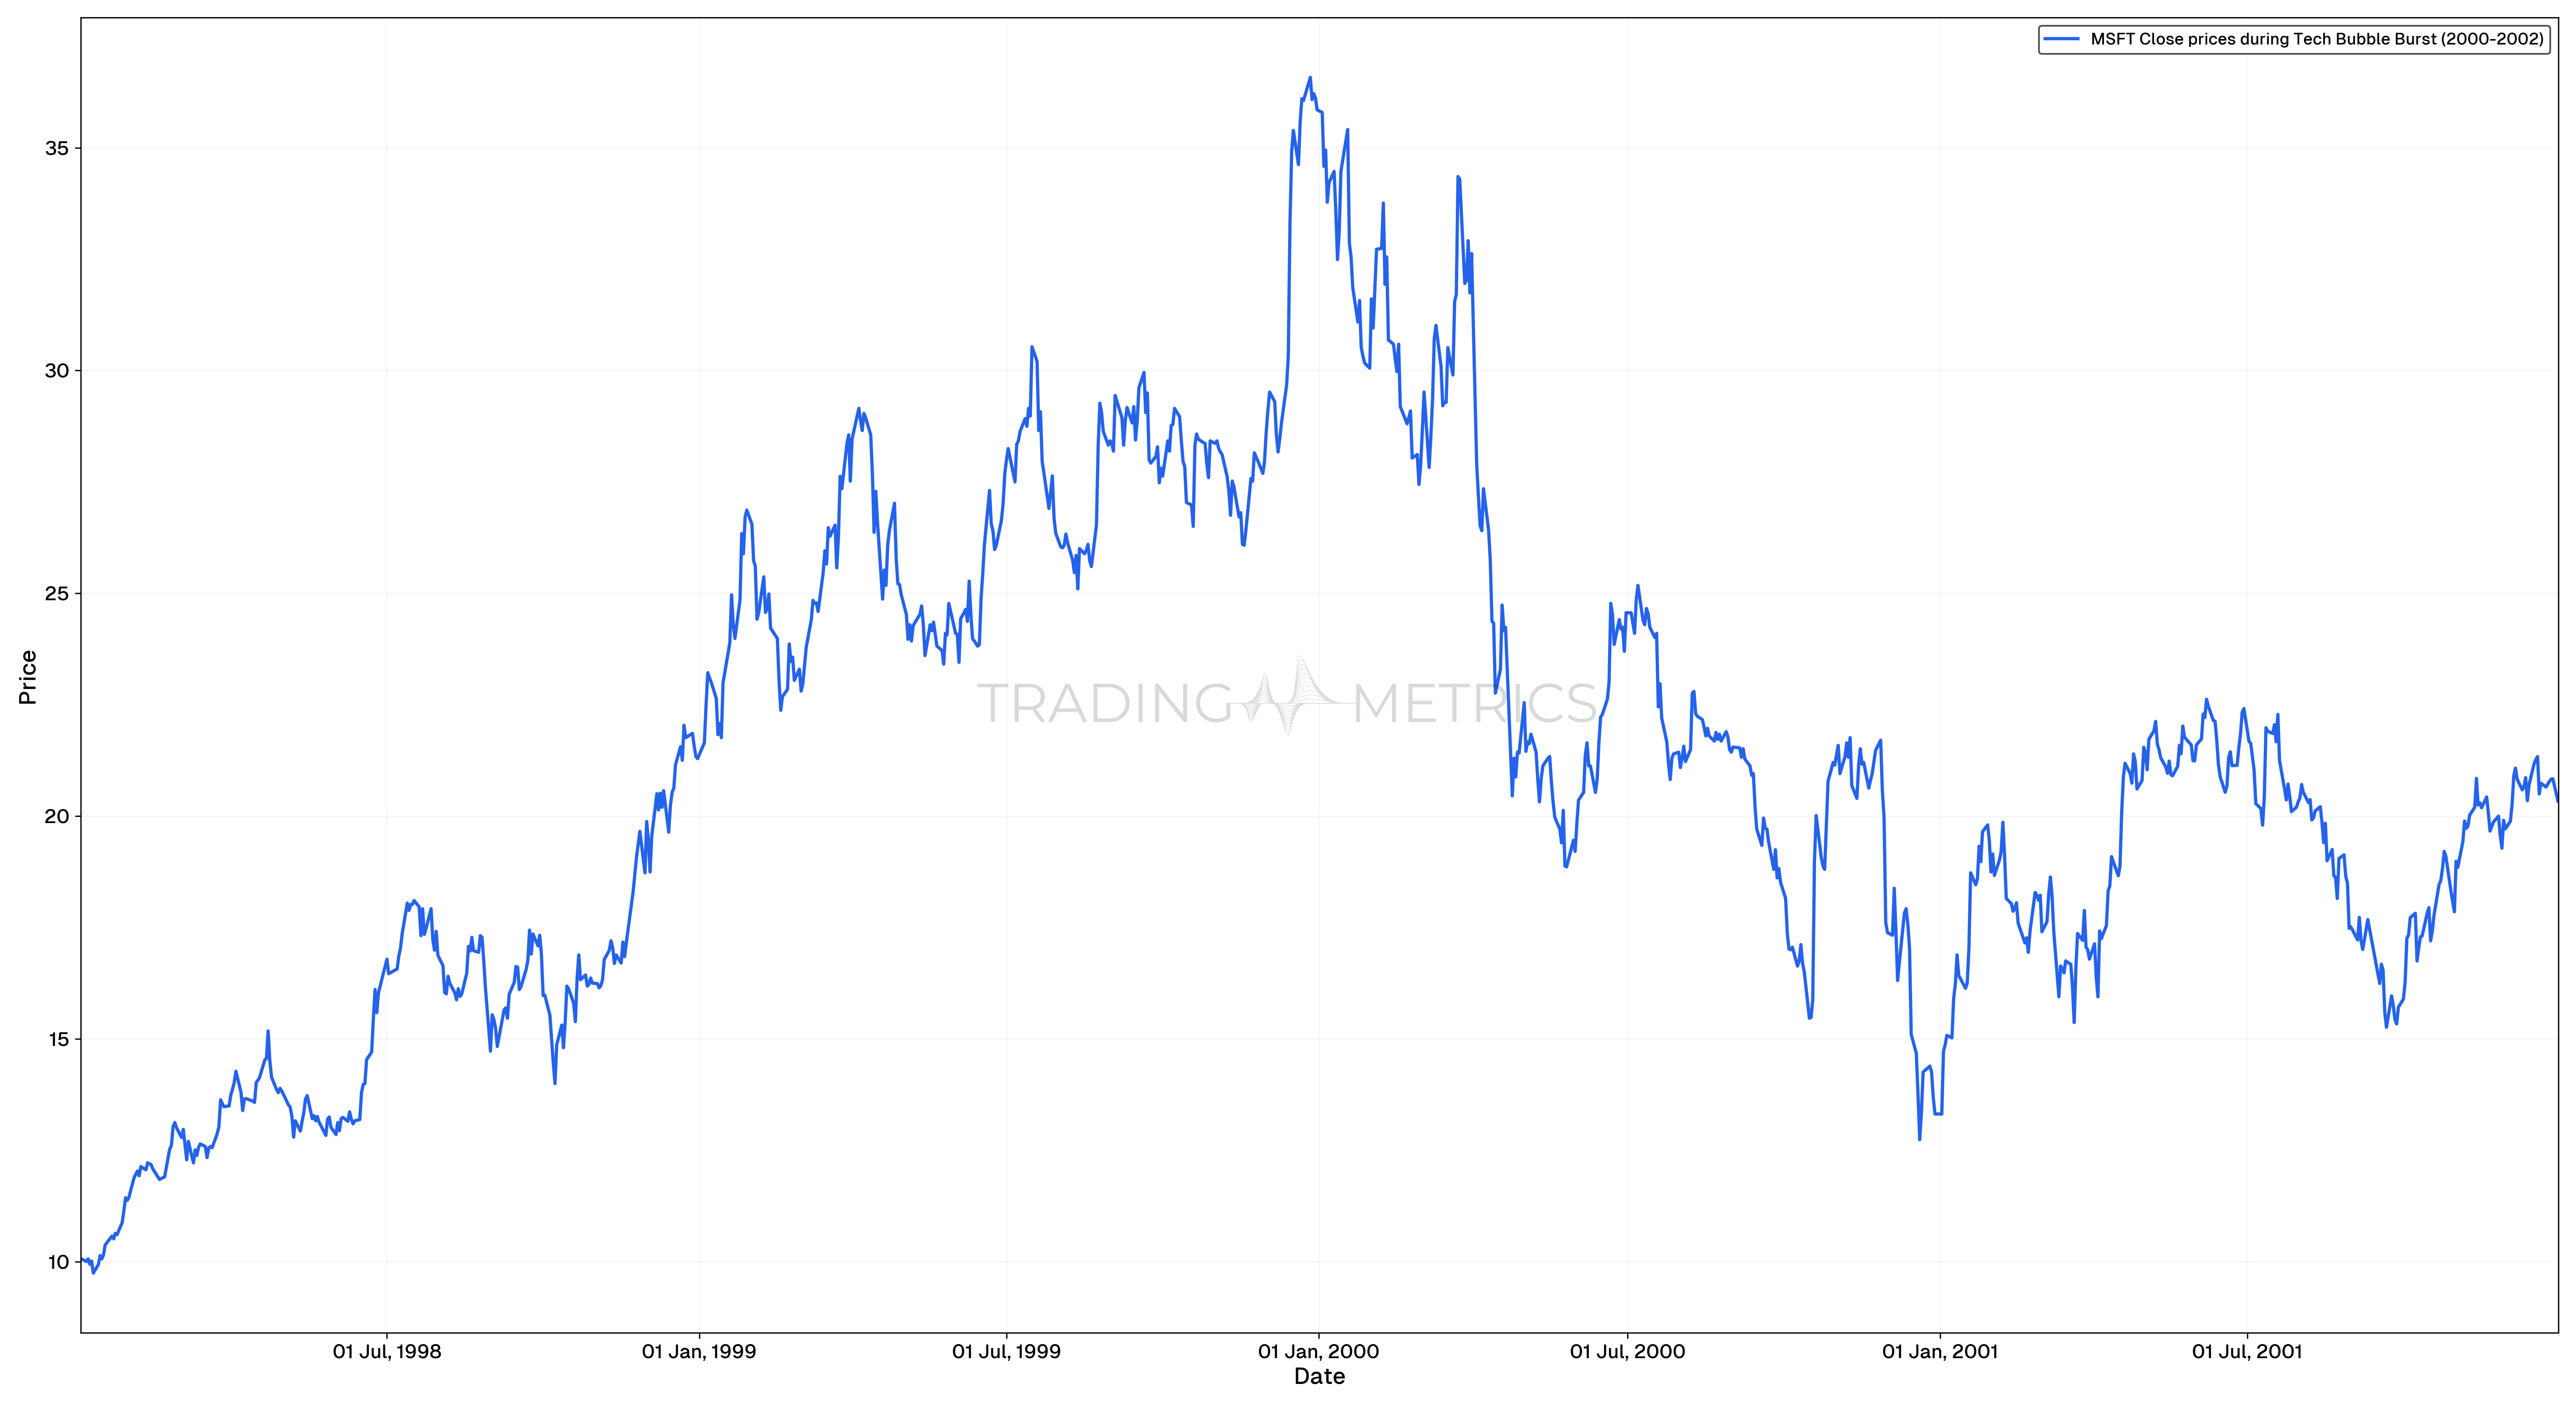
Tech Bubble Burst (2000-2002)
The dot-com bubble burst offers another poignant example of max drawdown. Suppose an investor had a portfolio heavily weighted in tech stocks at the peak of the bubble in early 2000.
At its peak on January 3, 2000, the value was $58.28. However, by December 20, 2000, the value had dropped to $20.75.
Warning: Letting emotions take over during a drawdown can amplify losses. Stick to your pre-defined risk management plan.
Combining Max Drawdown with Other Tools
Max Drawdown can be complemented with other tools to provide a more comprehensive analysis:
- Sharpe ratio: Measures the risk-adjusted return, helping traders understand if higher returns justify the increased risk indicated by MDD.
- Sortino ratio: Focuses on downside risk, similar to MDD, but only considers negative volatility.
- Value at Risk (VaR): Estimates the maximum loss over a specific period with a given confidence level.
- Stop-loss Orders: Practical tool to limit losses and manage drawdown in real-time trading.
Mindset Tip: Accept drawdowns as part of the trading journey. They test your discipline but don’t define your success.
Key Points
- Measure of Risk: Max drawdown quantifies the largest peak-to-trough decline in an investment’s value, highlighting its worst-case performance.
- Risk Tolerance Indicator: Investors use max drawdown to assess whether an asset or strategy aligns with their risk appetite.
- Impact on Recovery: Larger drawdowns require exponentially higher returns to recover, emphasizing the importance of limiting losses.
- Time Consideration: Combine max drawdown with recovery time to evaluate how quickly an investment rebounds after significant losses.
- Portfolio Management: Monitoring max drawdown across assets helps identify weaknesses and maintain a balanced risk profile.
- Strategic Implications: Investments with lower max drawdowns are often favored for capital preservation strategies, especially during volatile markets.
- Comparison Across Strategies: Use max drawdown to compare risk levels of different strategies or funds, particularly those claiming to manage risk effectively.
- Emotional Impact: High drawdowns can lead to panic selling; understanding this metric helps investors stay disciplined during market declines.
- Improving Risk Management: Analyze historical max drawdown to develop stop-loss levels and adjust position sizes proactively.
- Market Context: Max drawdown varies with market cycles; align expectations based on the asset class and economic conditions.
Conclusion
Max Drawdown is an indispensable metric for traders, offering clear insights into potential losses. By understanding and calculating MDD, traders can better manage risk, evaluate strategies, and prepare for market volatility. By integrating Max Drawdown with other analytical tools and adopting prudent trading practices, traders can navigate the turbulent waters of the market more confidently and effectively.
Frequently Asked Questions
Quick answers based on this page's topic.
Drawdown is any temporary drop from a peak in your account, whereas Max Drawdown is the largest recorded peak-to-trough decline over a specific period. MDD represents the 'historical worst-case' pain point of your strategy and is a key indicator of its long-term risk profile.
A high Max Drawdown can lead to 'trader burnout' and emotional decision-making. Knowing your strategy’s historical MDD helps you stay disciplined during a losing streak because you can distinguish between a normal, expected pullback and a total system failure.
A low MDD indicates a smoother path to returns and higher capital efficiency. It suggests the trader has strong risk controls in place. Strategies with deep drawdowns require significantly higher subsequent gains just to break even, making them less efficient for long-term compounding.
Most professional risk managers consider a Max Drawdown between 10% and 20% acceptable for active trading strategies. Beyond 20%, the mathematical recovery becomes steep—a 50% drawdown requires a 100% return just to break even—and the psychological toll often leads to further poor decisions.
The most effective methods are proper position sizing, diversifying across uncorrelated strategies or assets, and using trailing stops to protect open profits. Reducing position size during losing streaks and scaling back into full size only after equity recovers also smooths the equity curve significantly.