Chaikin Money Flow (CMF): Following Smart-Money Accumulation
The Chaikin Money Flow (CMF) is a technical analysis tool developed by Marc Chaikin. It’s a volume-weighted average of accumulation and distribution over a specified period, usually 21 days. CMF ranges from -1 to +1 and helps traders determine whether a security is experiencing buying pressure (accumulation) or selling pressure (distribution).
When volume meets price, CMF deciphers the balance between strength and weakness.
- Anonymous
How to Use Chaikin Money Flow (CMF)?
CMF is used by plotting it on a chart below the price chart of a stock or cryptocurrency. The key points to watch are:
- Above Zero Line (+0.1 or higher): Indicates buying pressure.
- Below Zero Line (-0.1 or lower): Indicates selling pressure.
- Crossing Zero Line: A potential shift in trend. Crossing above zero can suggest a buying opportunity, while crossing below zero might indicate a selling opportunity.
How to Calculate Chaikin Money Flow (CMF)?
To calculate the Chaikin Money Flow (CMF), we use the following formula:
Where:
- is the Accumulation/Distribution value for a given day.
- is the volume for a given day.
- is the number of periods (e.g., 21 days).
The Accumulation/Distribution (AD) value is calculated as:
This value is then multiplied by the volume for that day.
Importance of Chaikin Money Flow (CMF) in Trading
Chaikin Money Flow (CMF) is an important indicator that measures the accumulation and distribution of an asset based on both price and volume. It provides insights into whether institutional investors are buying or selling, which can be an important signal of future price movement. Traders use CMF to confirm trends or identify important divergences between price and volume momentum. By analyzing CMF, traders can gain an important understanding of market strength or weakness.
Volume-Weighted Momentum: CMF measures buying and selling pressure by combining price movement with volume, offering a clear view of market sentiment.
CMF Periods
Imagine you’re at a bustling market. Some days, the stalls are teeming with buyers, while other days, it’s quieter, and sellers outnumber buyers. Now, think of the Chaikin Money Flow (CMF) as your market spyglass. It helps you see whether buyers or sellers are ruling the roost over a specific period, or “CMF period.”
CMF periods refer to the number of days over which the CMF is calculated. The default period is usually 21 days, a choice rooted in the monthly trading cycle. However, traders can adjust this period to suit their trading style and the market they’re analyzing.
Choosing the right CMF period is like finding the perfect porridge temperature – not too hot, not too cold, but just right.
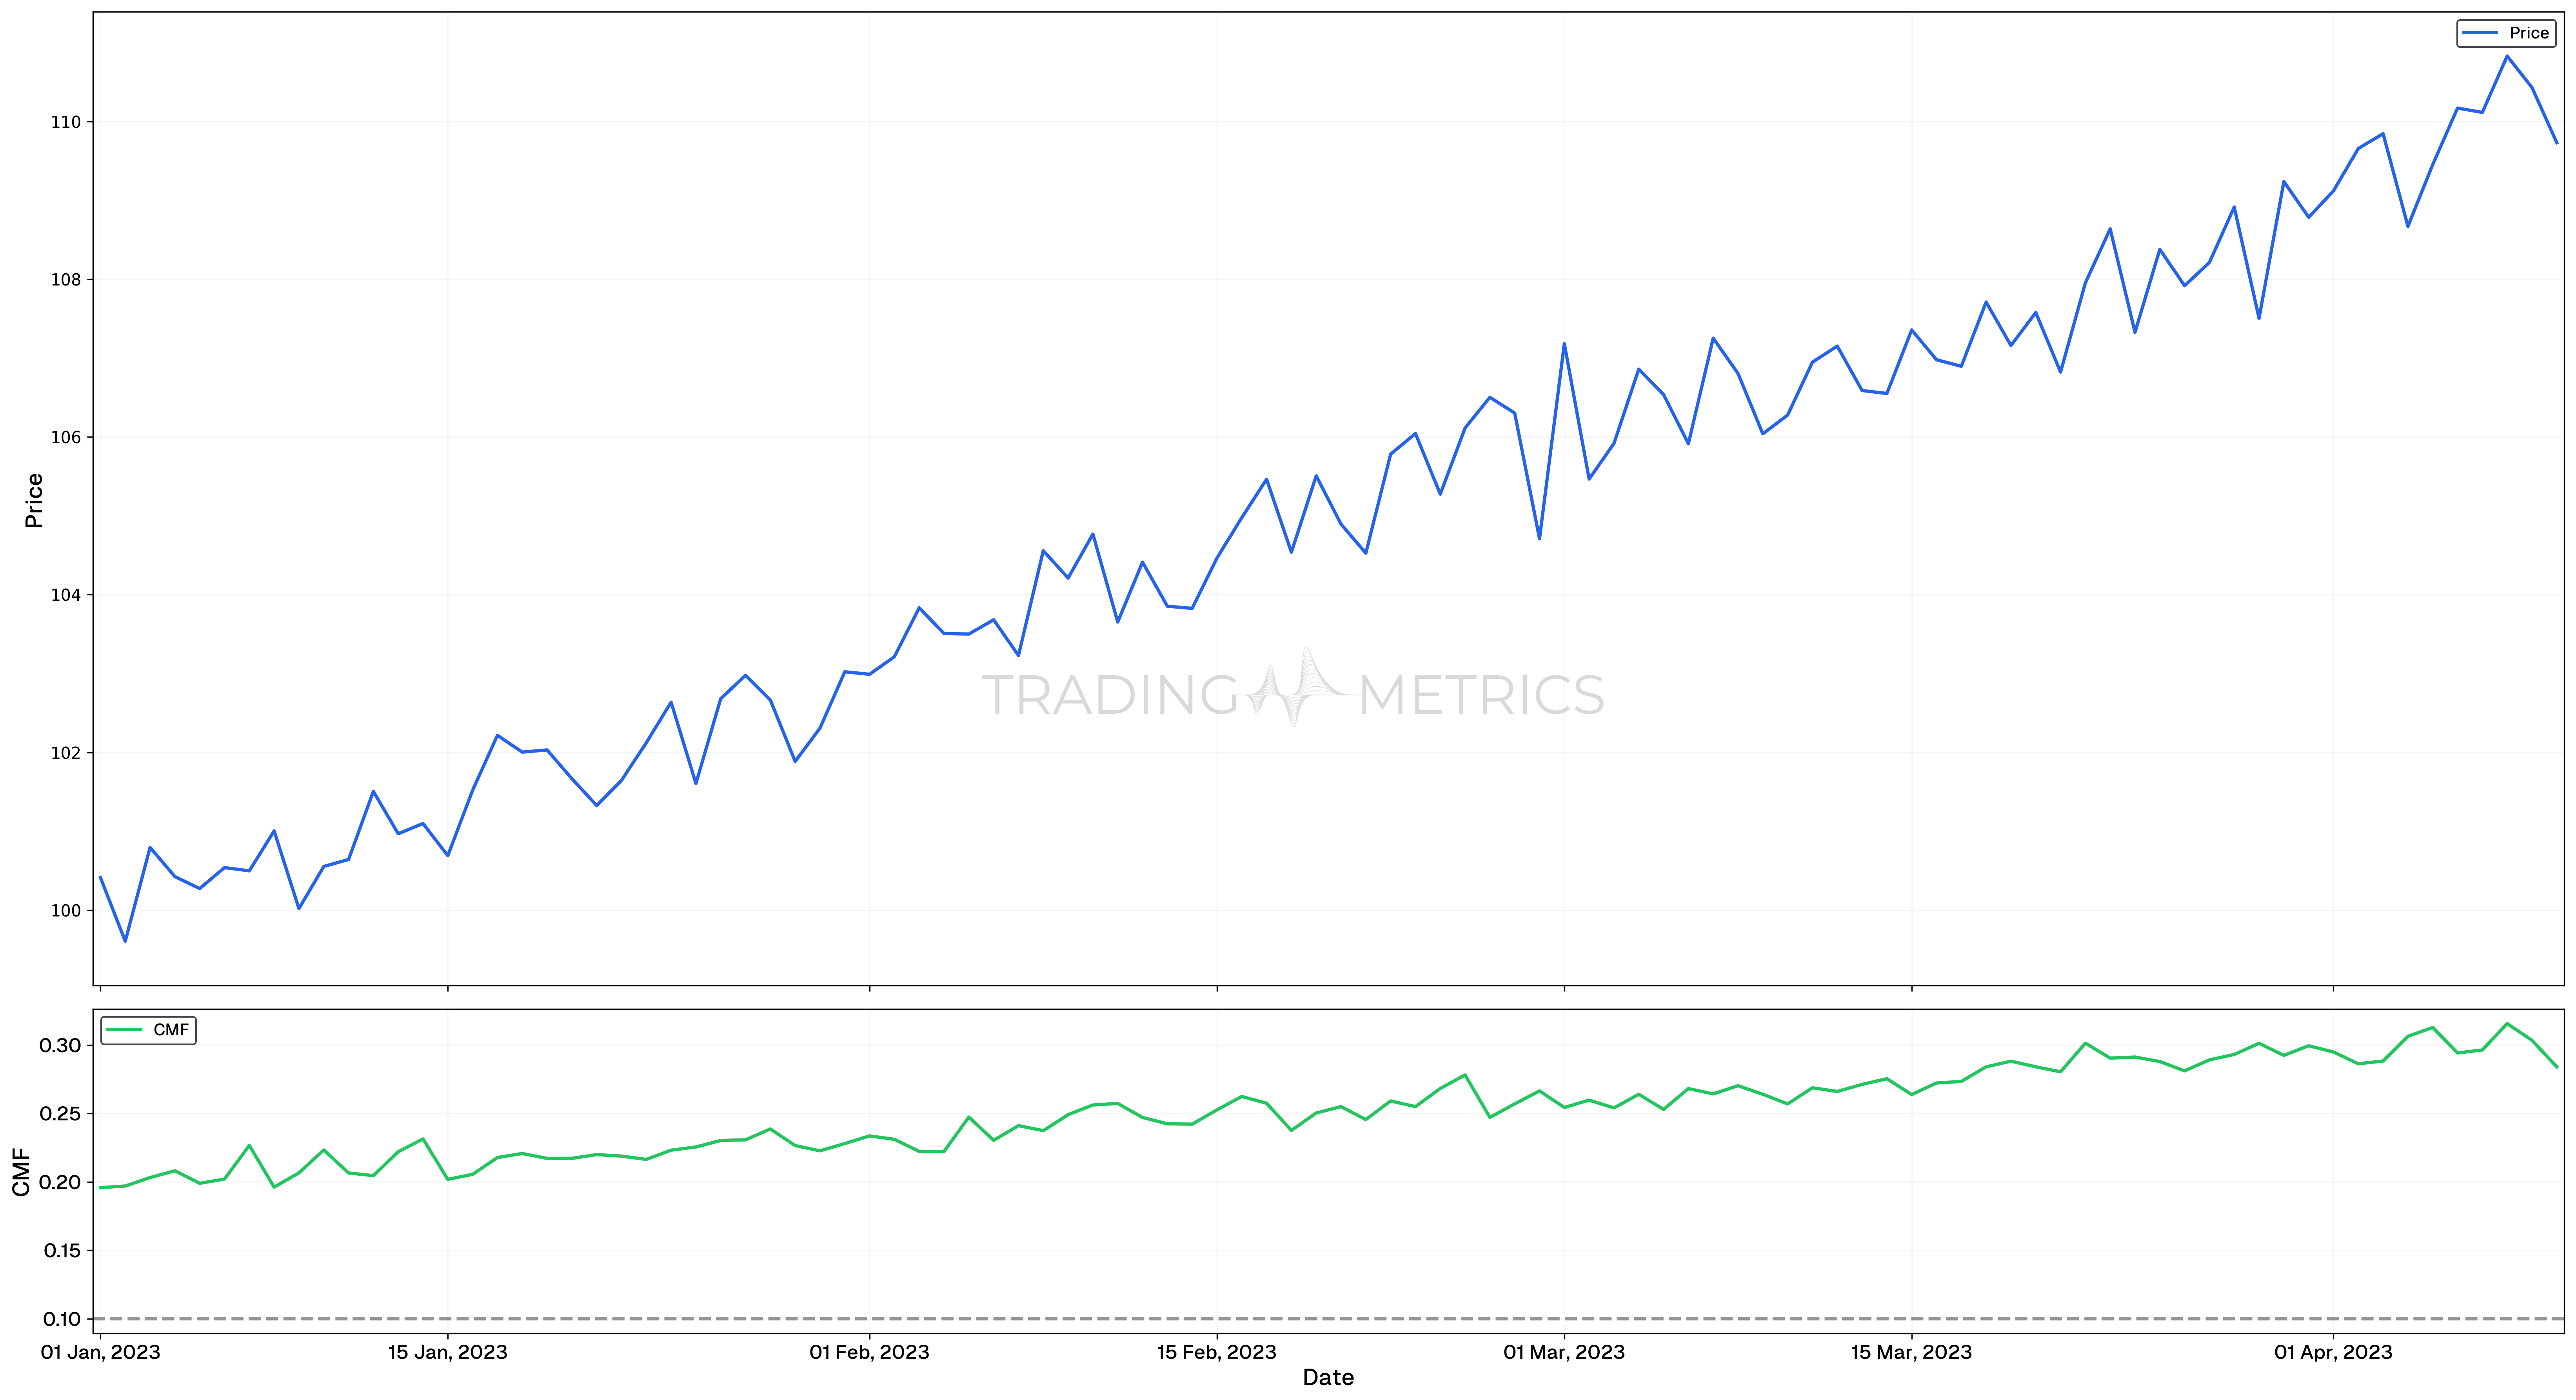
Short Periods (e.g., 10 weeks)
- Quickly responsive to market changes, ideal for short-term traders.
- Can be too sensitive, leading to false signals due to market noise.
The Chaikin Money Flow (CMF) indicator shown in the charts above is calculated using short periods, such as 10 days. This helps in quickly identifying shifts in buying and selling pressure within the stock market. The candlestick chart visualizes price movements over time, while the CMF below it provides insights into the flow of money into or out of the stock, helping traders gauge the strength of market trends during shorter time frames. The indicator is particularly useful for spotting potential reversals or confirming trends in the context of short-term trading strategies.
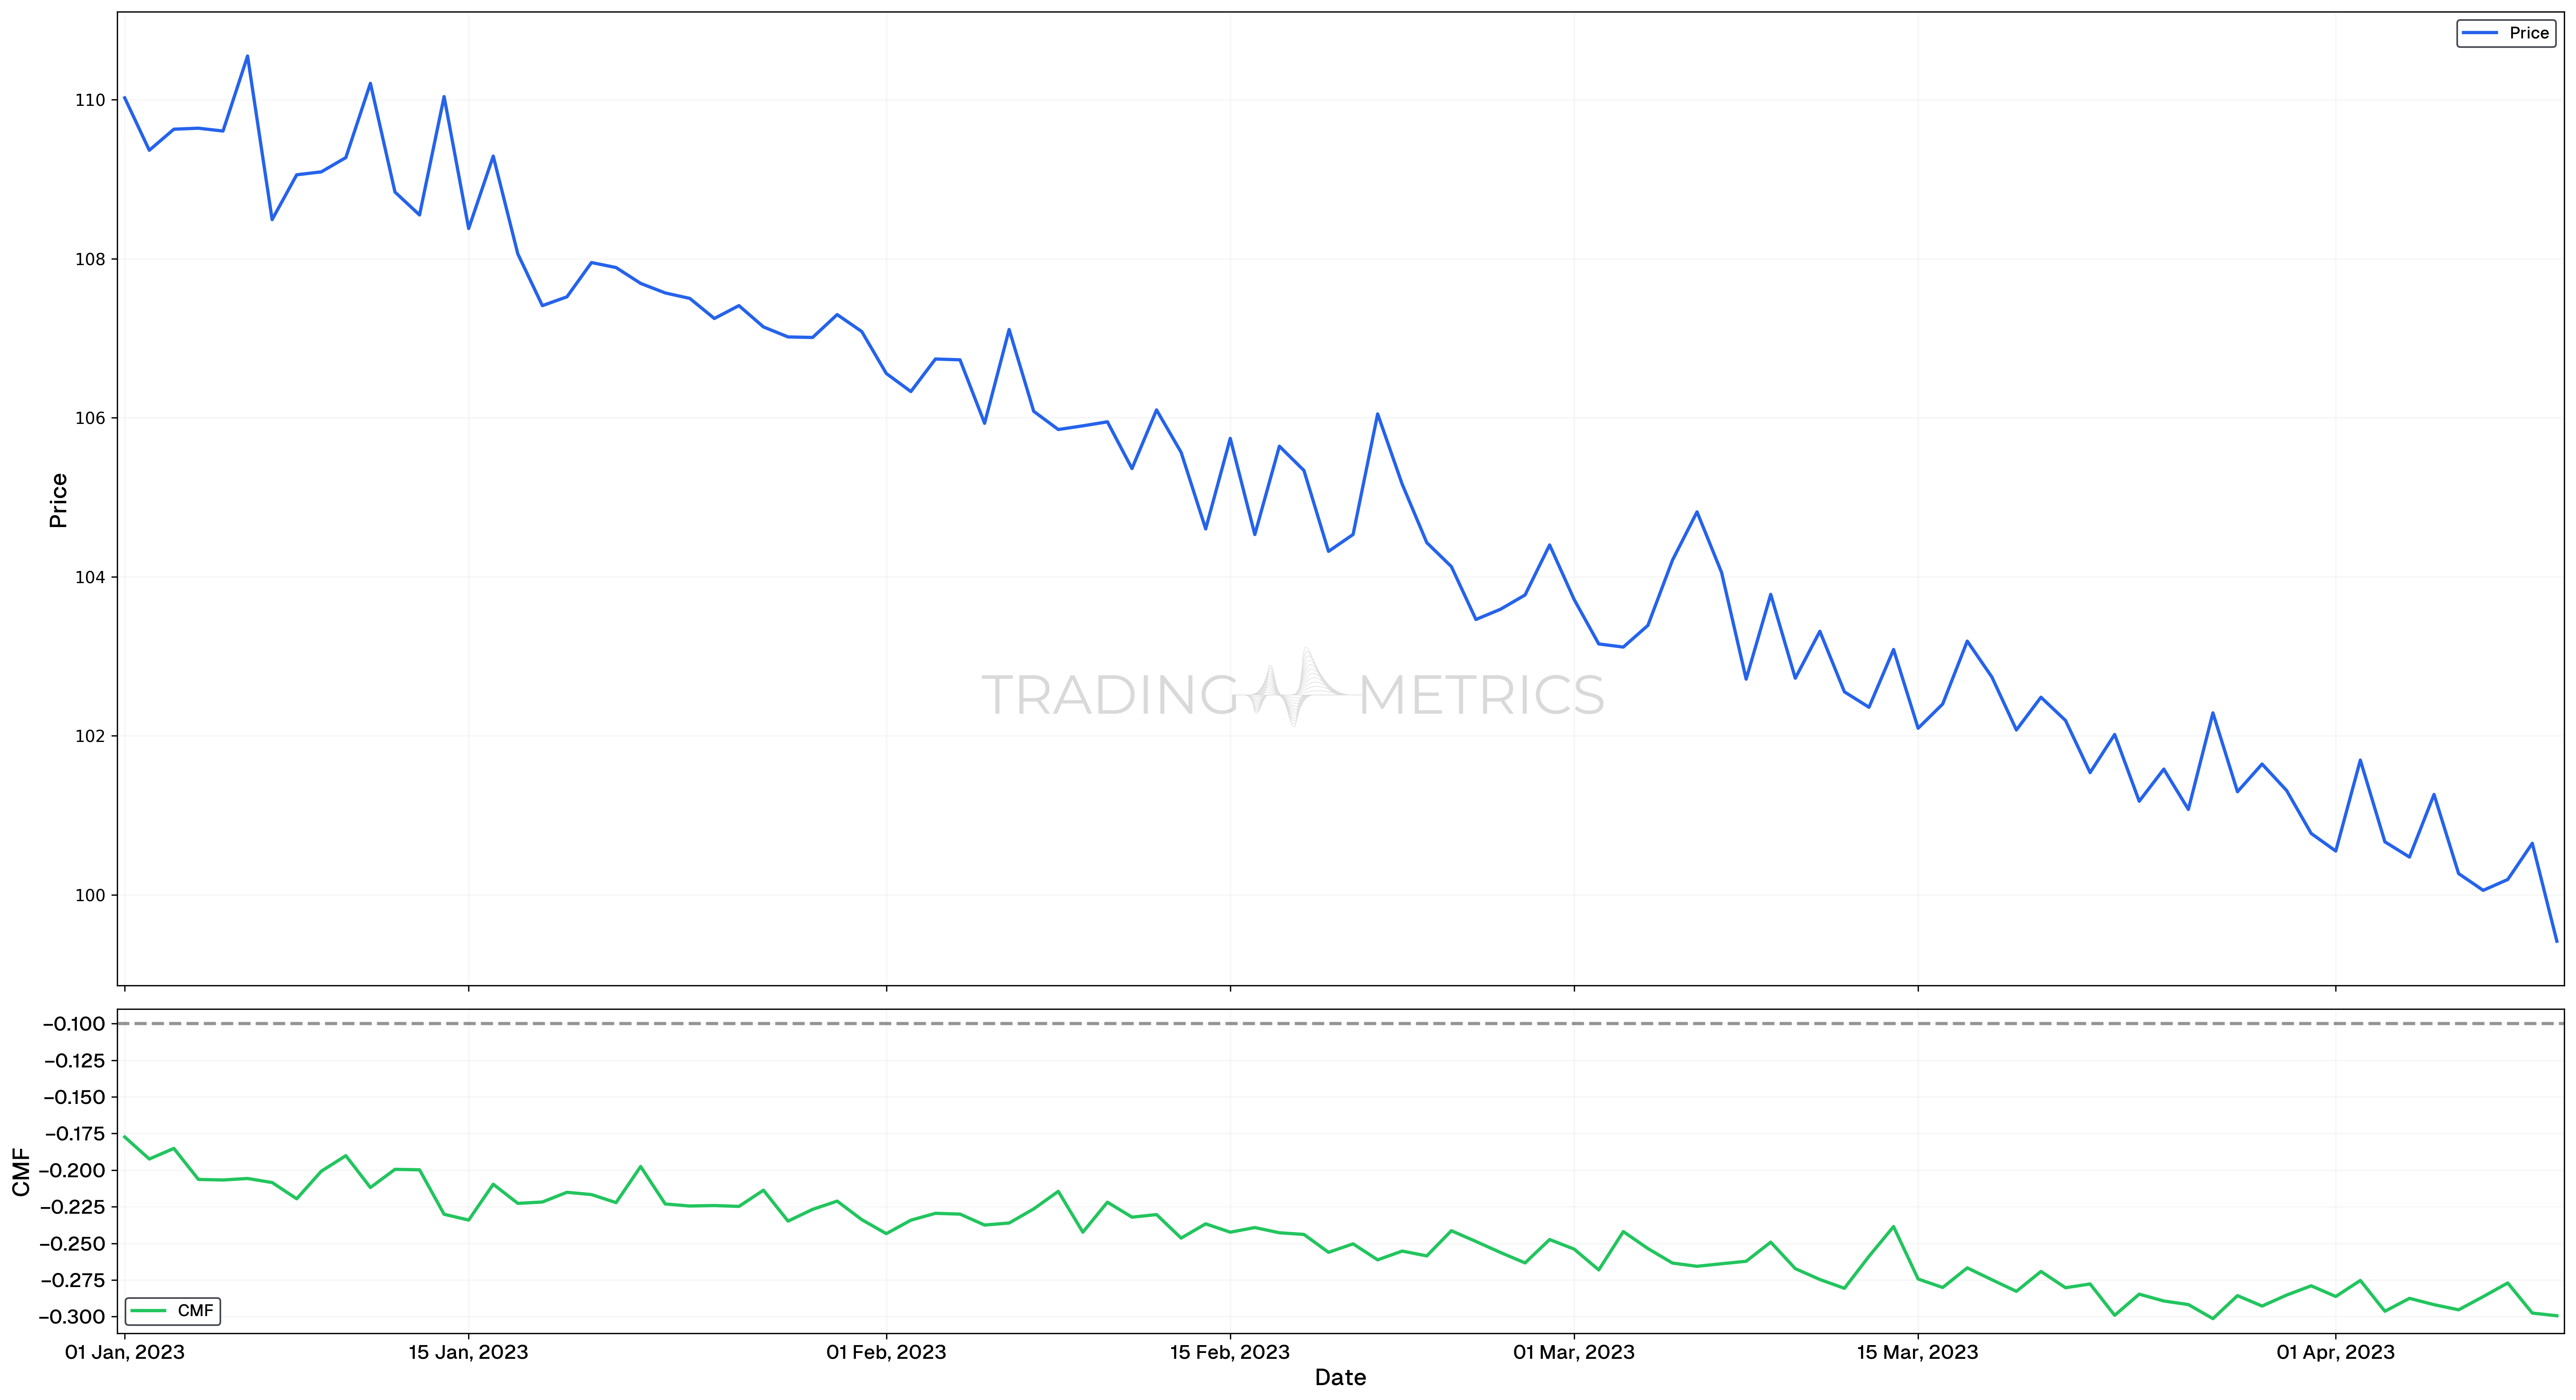
Medium Periods (e.g., 21 weeks)
- Strikes a balance between sensitivity and reliability, suitable for medium-term traders.
- May not capture very short-term fluctuations or long-term trends.
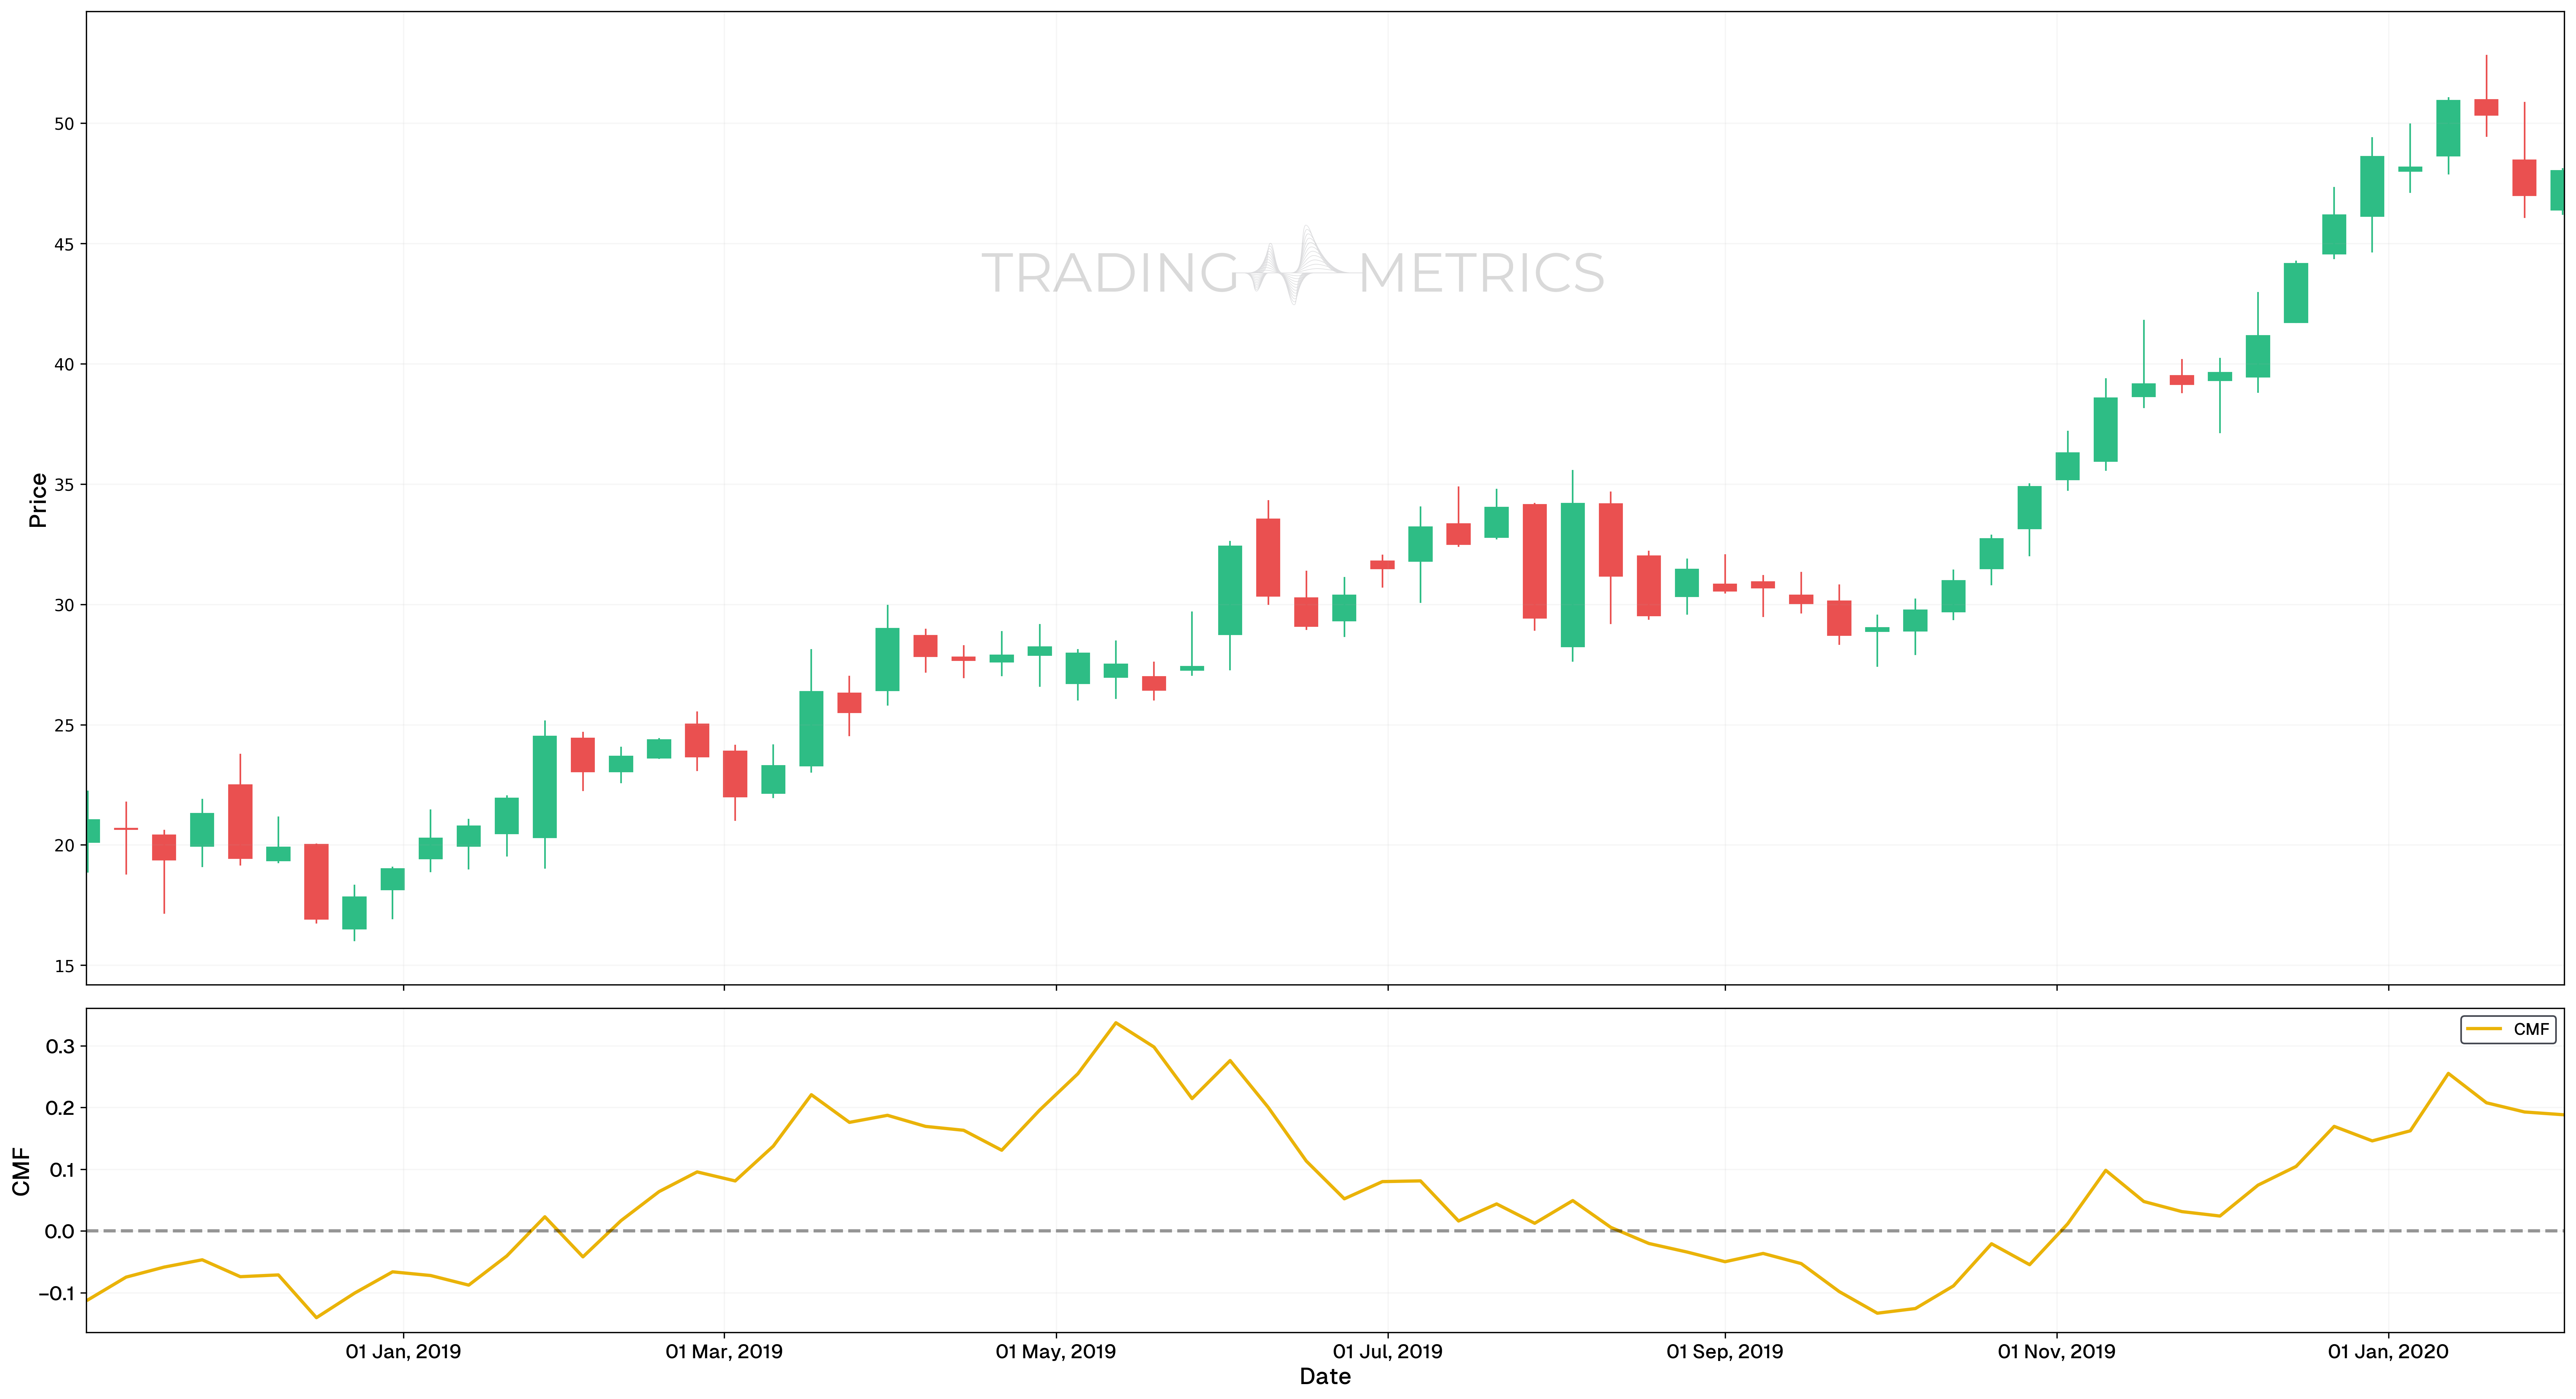
The Chaikin Money Flow (CMF) indicator displayed in these charts is calculated using medium periods, such as 21 days. This approach provides a balanced view of money flow dynamics, capturing both short-term fluctuations and longer-term trends. The candlestick chart illustrates the price movement over time, while the CMF indicator below it reflects the strength of buying and selling pressure in the market. This medium-term analysis is useful for traders and investors who seek to understand market sentiment and confirm trend direction over a moderate time horizon.
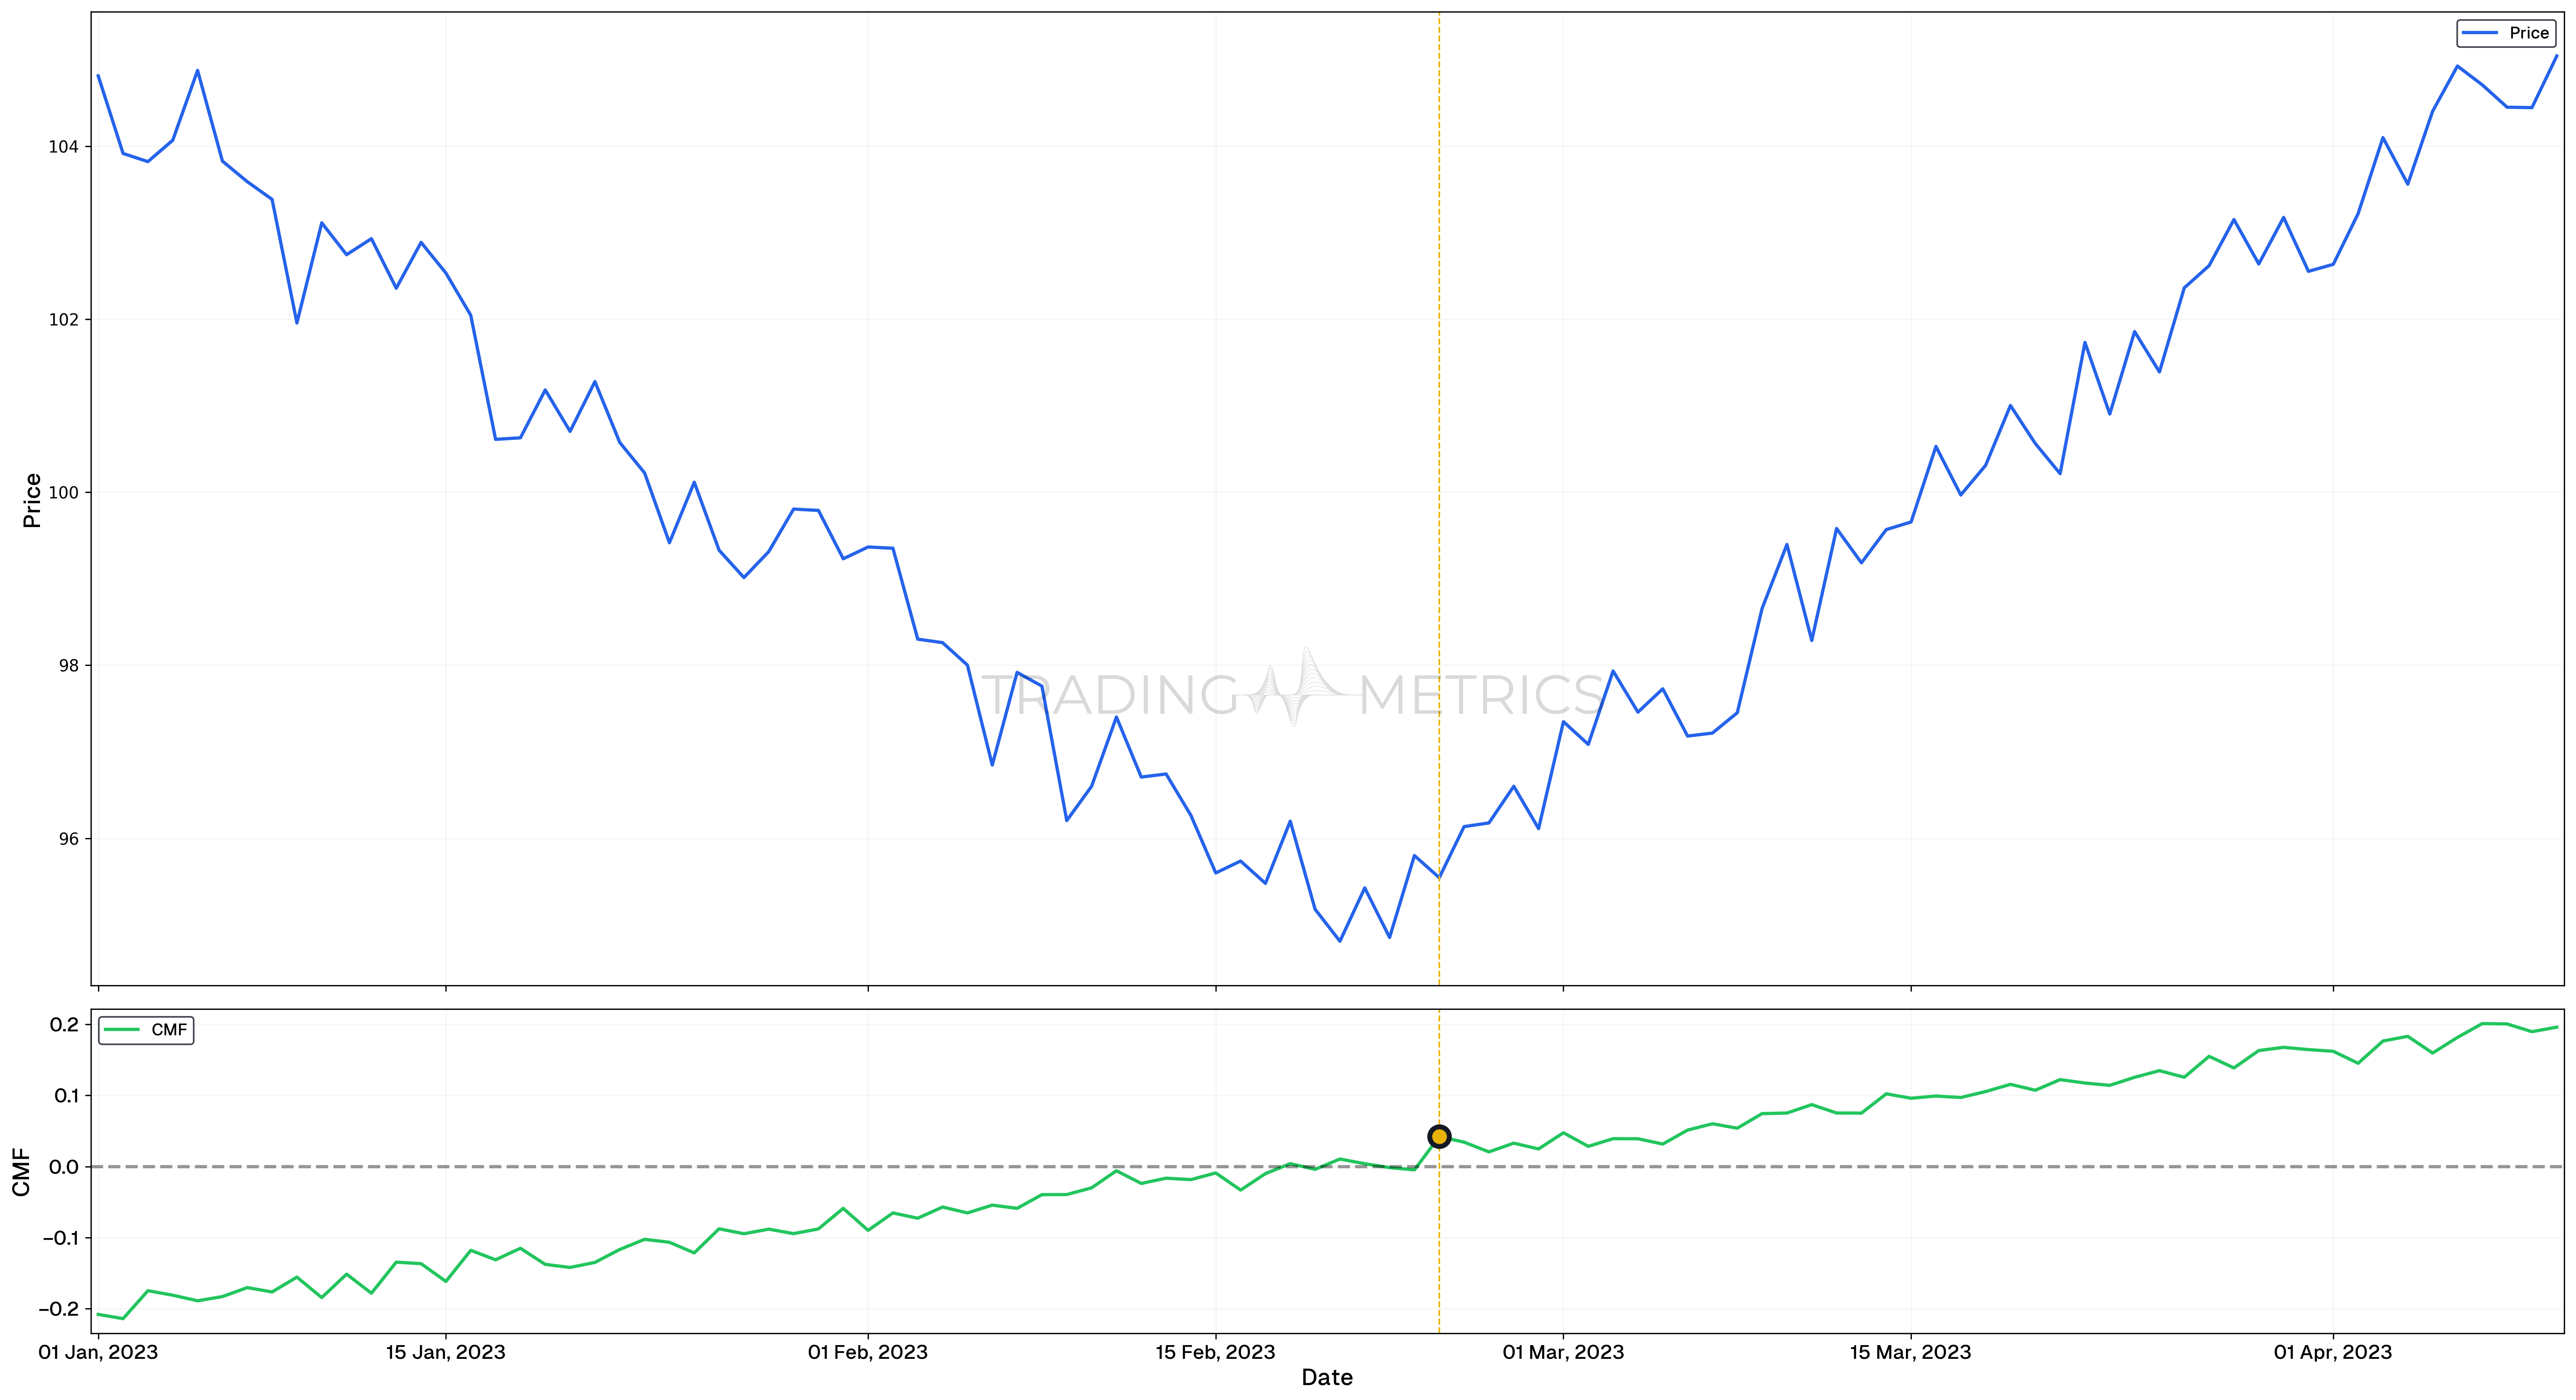
Long Periods (e.g., 50 weeks)
- Smooths out market noise, highlighting long-term trends, perfect for long-term investors.
- Less responsive to recent market changes, potentially missing early trend reversals
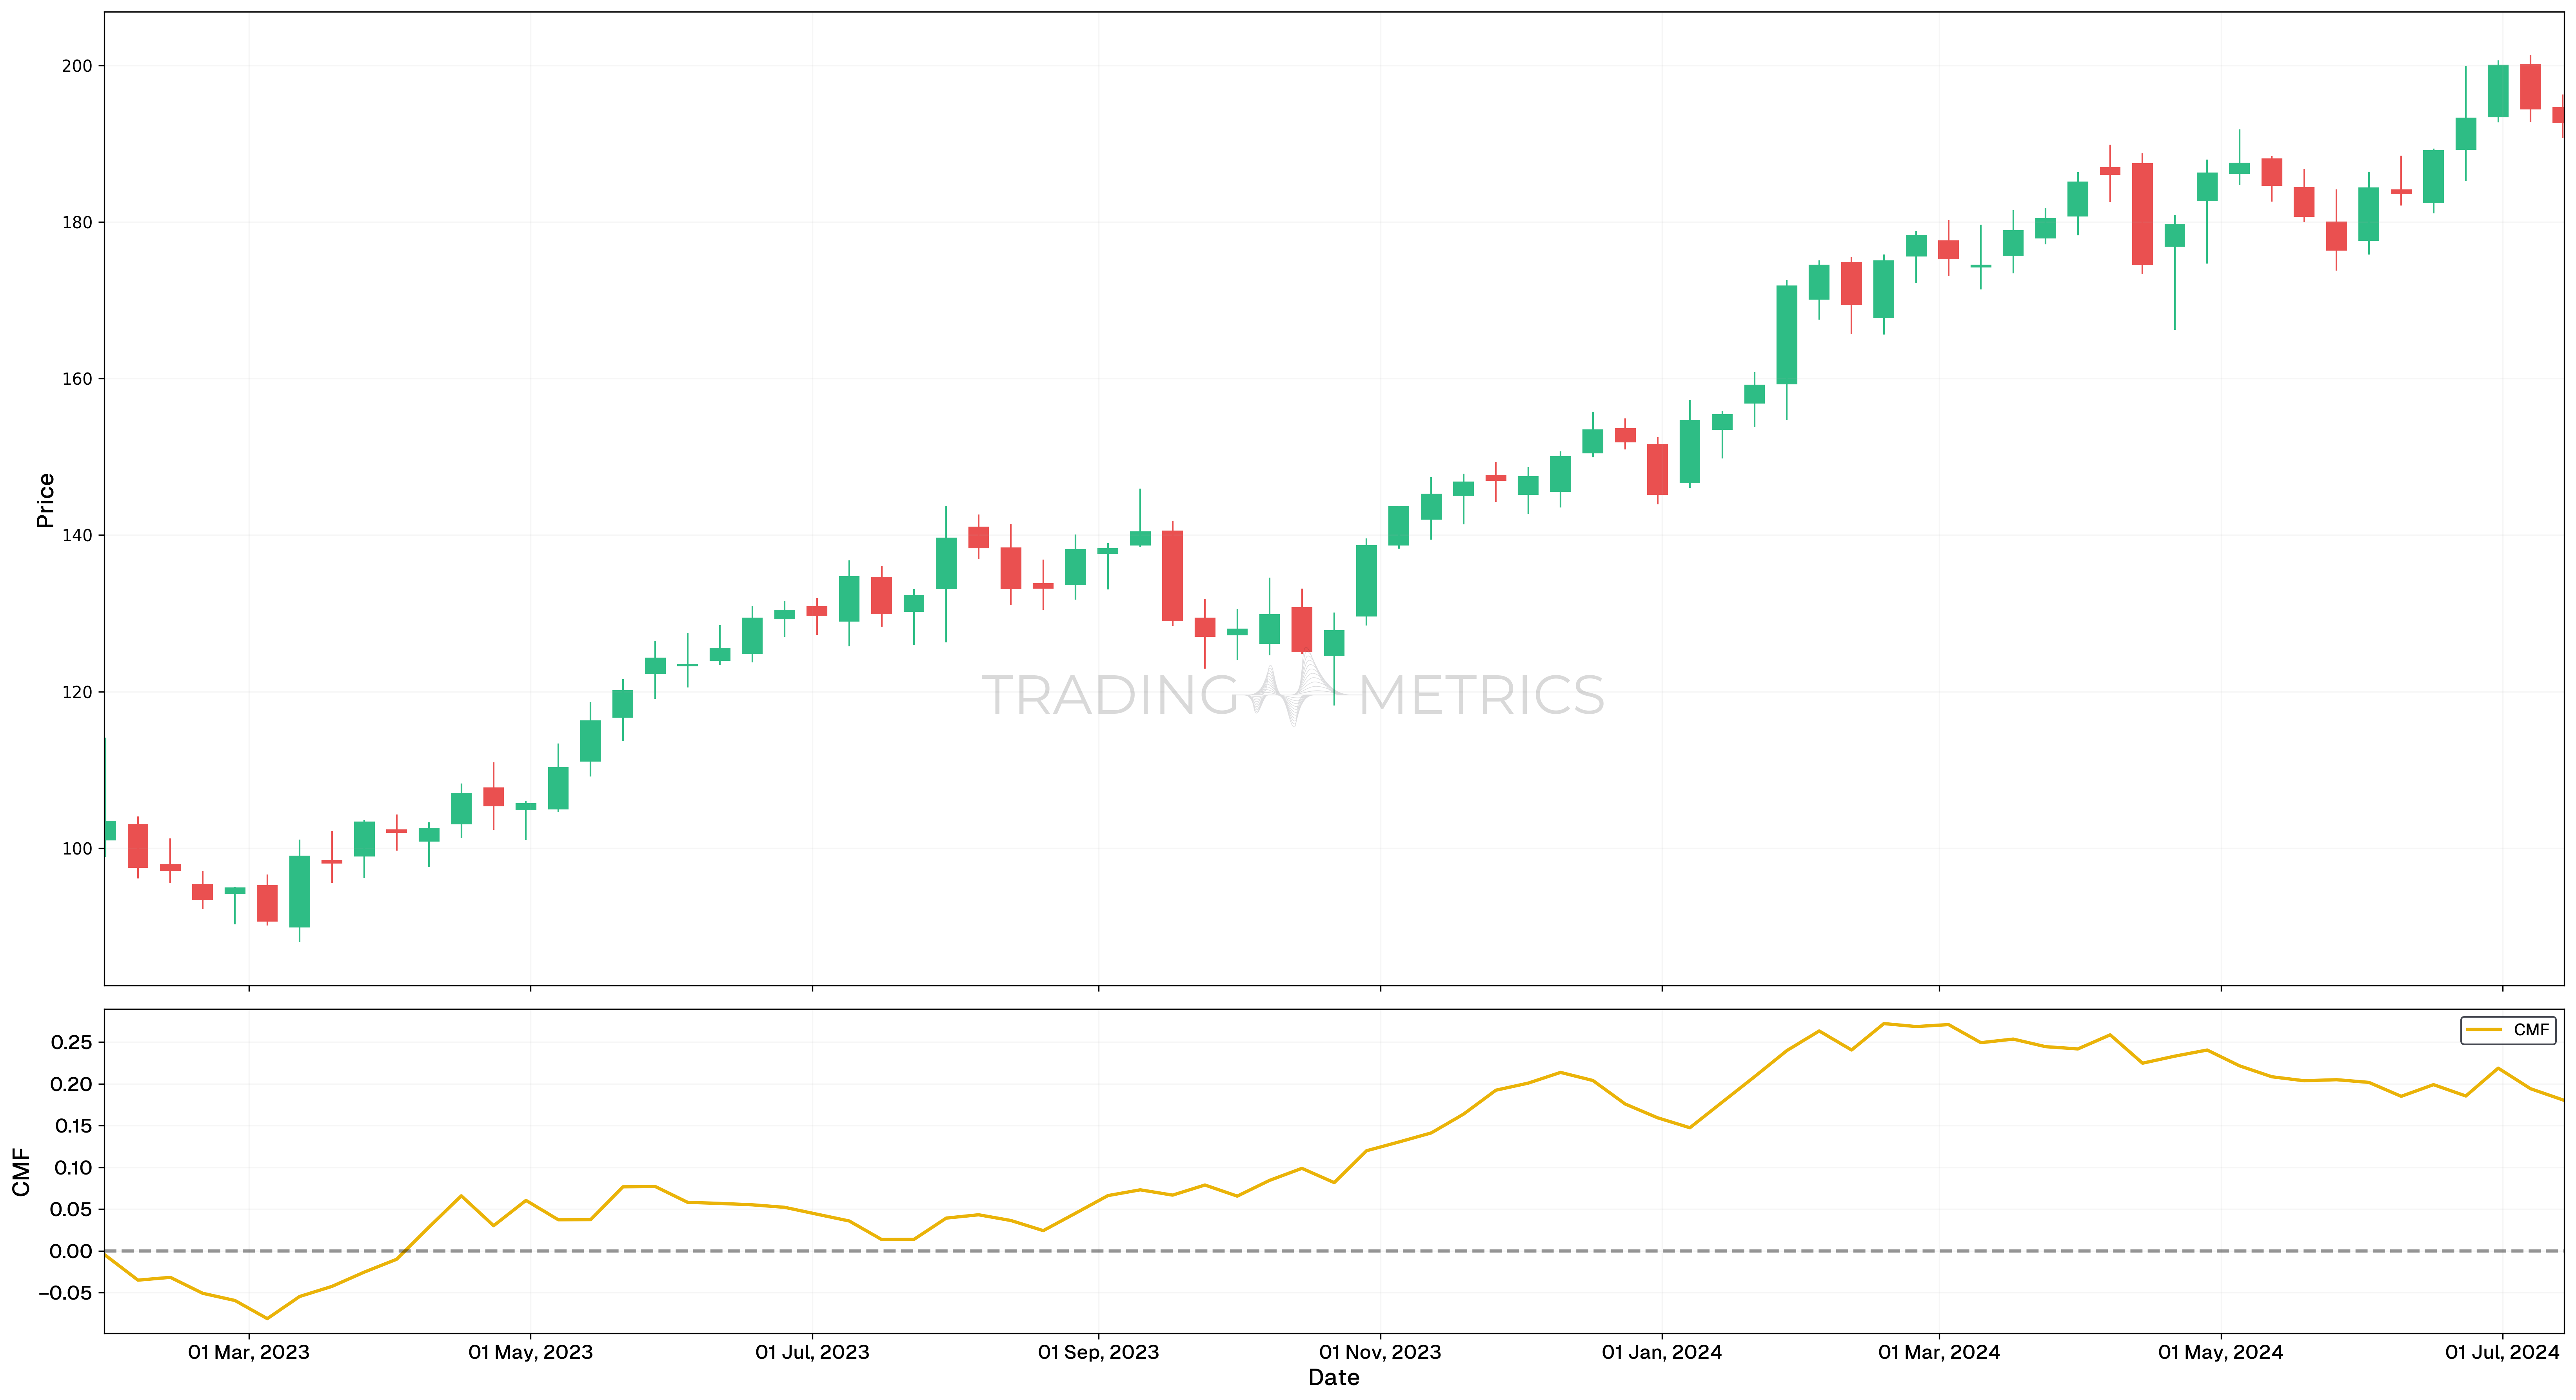
The Chaikin Money Flow (CMF) indicator shown in these charts is calculated using long periods, such as 50 days. This longer timeframe helps smooth out short-term volatility, providing a clearer picture of sustained buying or selling pressure. The candlestick chart captures the overall price trend, while the CMF indicator below highlights the cumulative money flow over the extended period. This long-term analysis is particularly valuable for investors looking to identify significant trends and confirm the strength of market movements over a more extended timeframe.
Bullish trend confirmation
Before diving into the chart, let’s set the stage. The Chaikin Money Flow (CMF) 50 is a powerful tool used by traders to confirm trends over longer periods. It helps identify whether buying or selling pressure dominates the market.
Key Points:
- CMF(50) Indicator: Used for analyzing longer trends.
- Price and CMF Relationship: When both the price and CMF are rising, it indicates a strong bullish trend.
- Timeframe of Interest: October 14, 2023, to November 10, 2023.
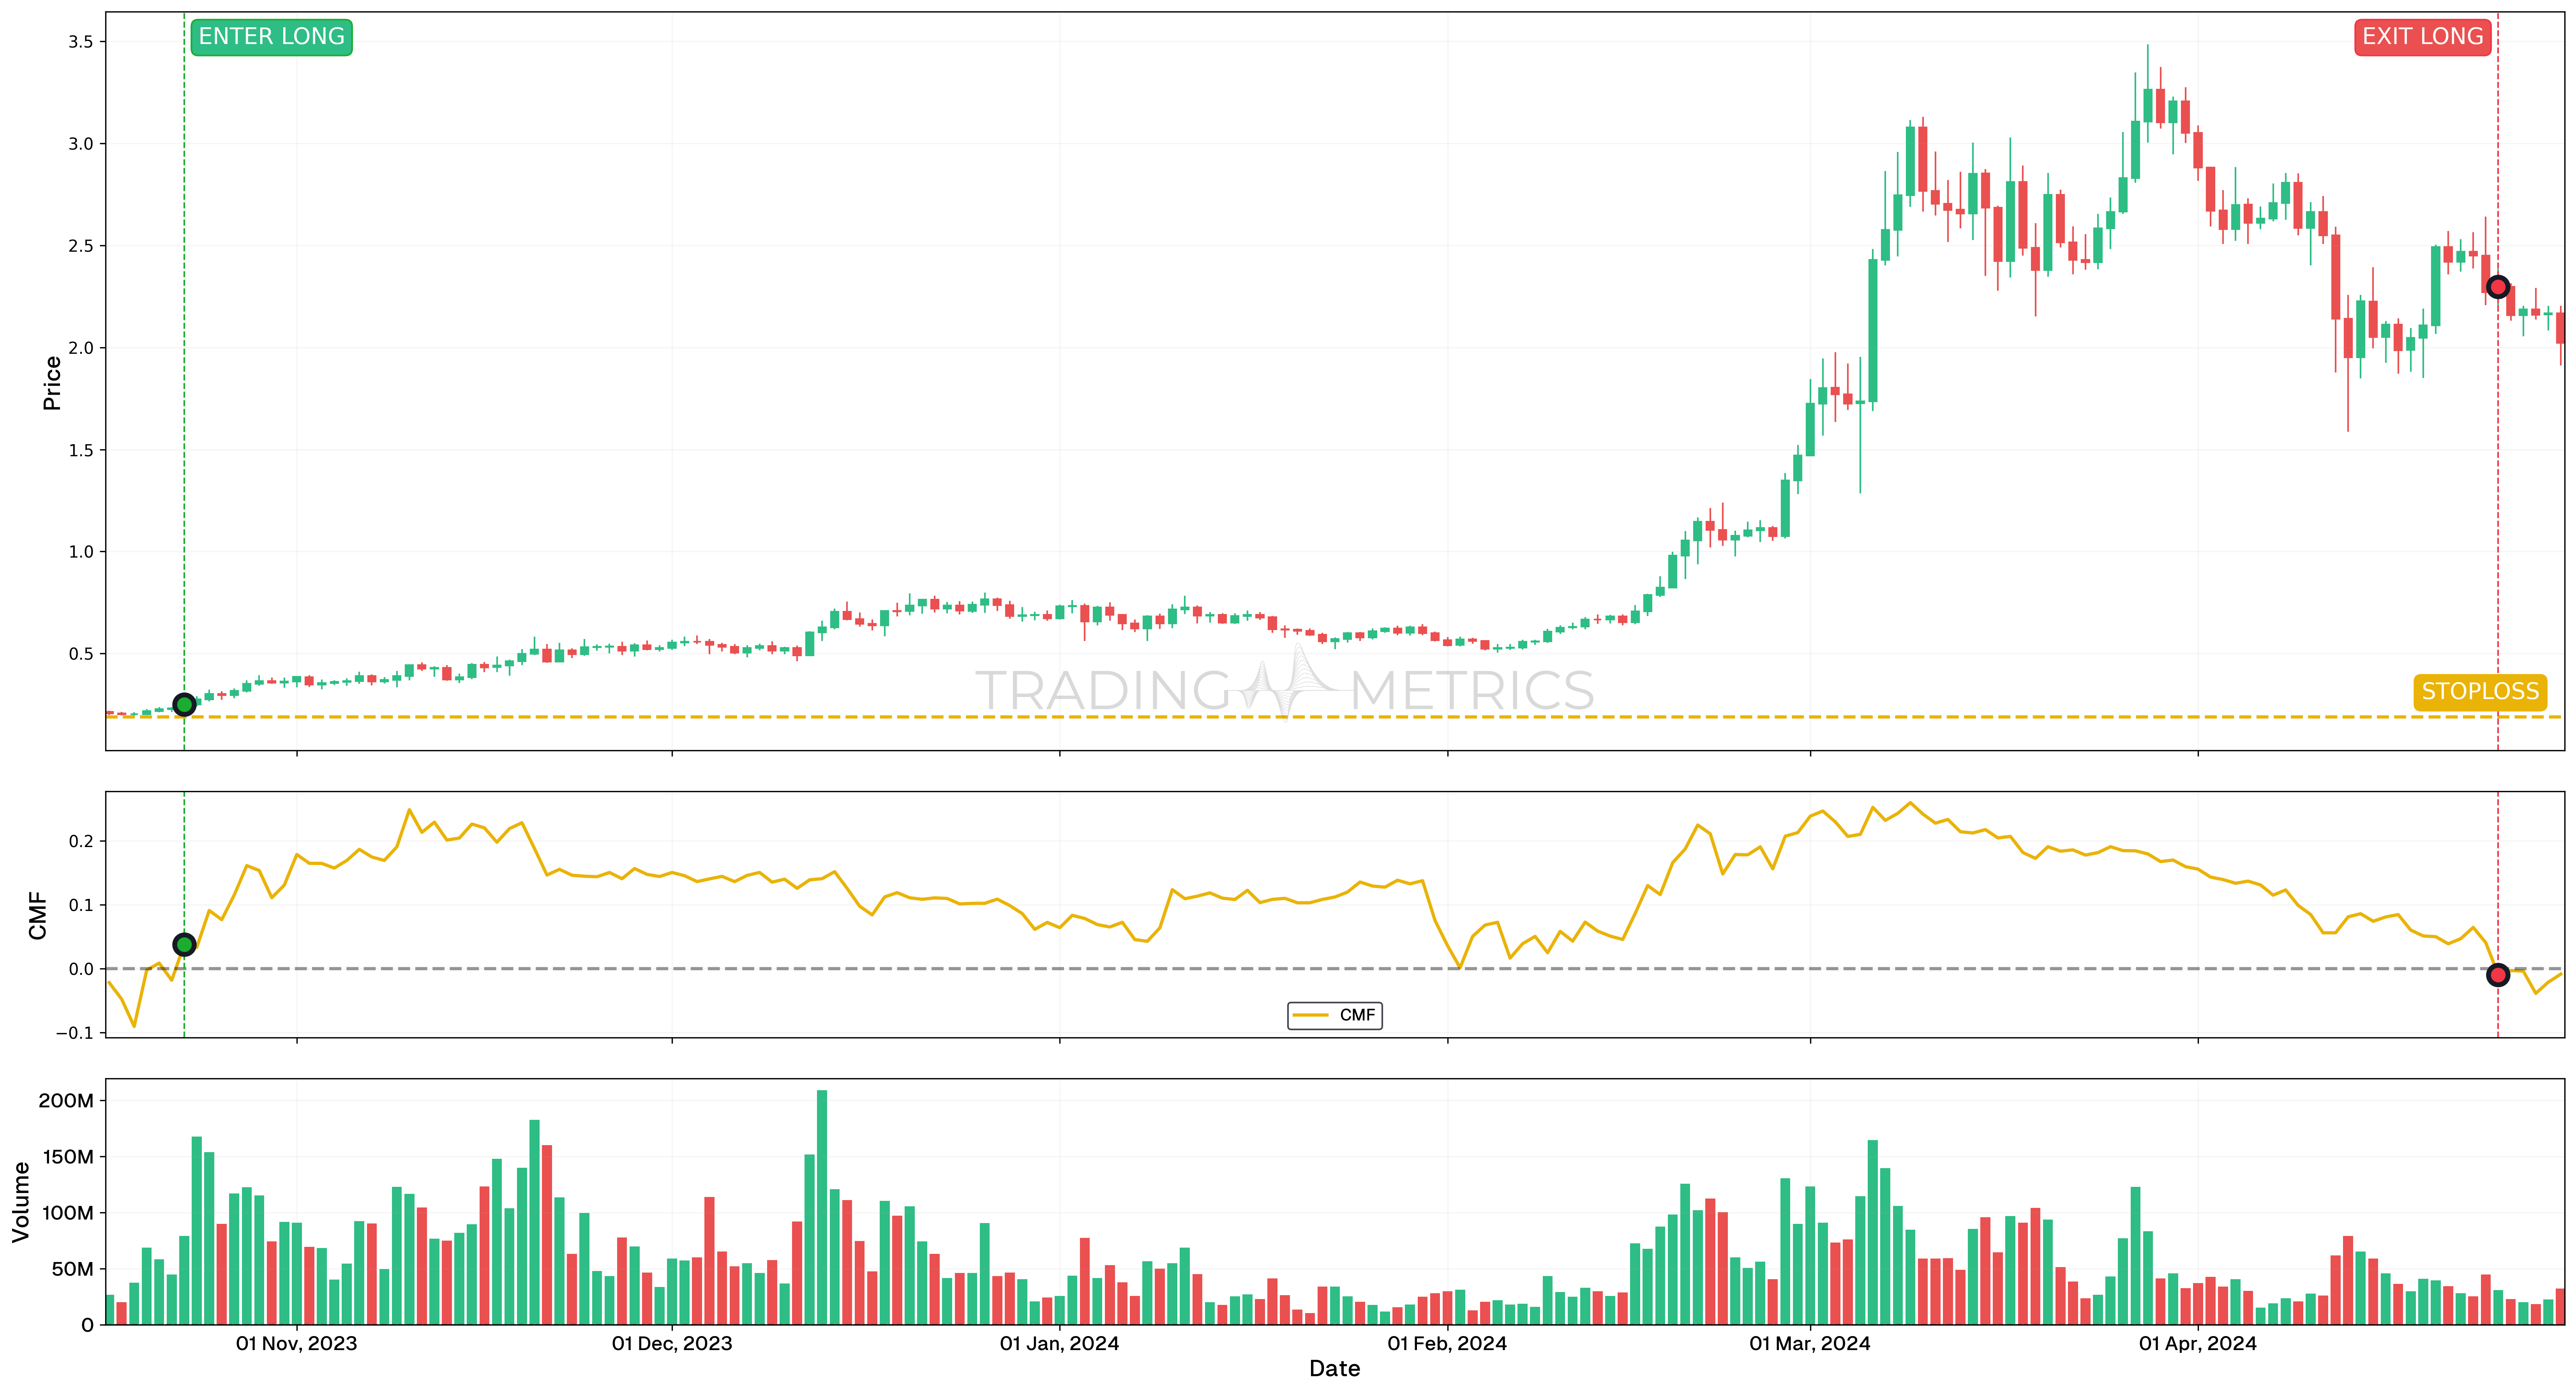
Analysis
- Bullish Trend Confirmation: From October 14, 2023, to November 10, 2023, the CMF(50) remained consistently above zero, confirming bullish momentum. This was further validated by the steadily climbing price during the same period.
- Increasing CMF(50): The CMF(50) not only stayed positive but also trended upward, reinforcing the strength of the ongoing uptrend.
- Remarkable Price Increase: Between October 23, 2023, and April 25, 2024, the price surged by an impressive 812.47%, aligning with the increasing CMF(50) and highlighting sustained bullish momentum.
- Volume Peak: On October 16, 2023, trading volume peaked at over 33.9 million, signifying strong market activity that confirmed buyers’ dominance during the uptrend.
Trade Setup
- Entry: The CMF(50) above zero and increasing, combined with the significant volume peak on October 16, 2023, provided an ideal Long Position Entry Signal during the bullish trend.
- Exit: Traders could monitor for a reversal in the CMF(50), such as a decline back toward zero or a price slowdown, as a potential Long Position Exit Signal.
- Outcome: The 812.47% price increase during this period showcases the profitability of acting on signals derived from the CMF(50) and volume.
Risk Management
- Stop-Loss Placement: The stop-loss was strategically set at $0.19, aligning with a significant support/resistance zone identified during the uptrend. This level provides a logical protective barrier while maintaining a controlled risk exposure.
- Position sizing: Position size was calculated to maintain a maximum risk exposure of 2% of trading capital, adhering to disciplined risk management principles.
- Risk-Reward Analysis: The trade setup adhered to a 1:33.28 Risk-Reward Ratio, optimizing the potential reward relative to the defined risk, especially given the sustained bullish trend indicated by CMF(50).
- Managing Volatility: With CMF(50) indicating strong momentum, price volatility can increase. Monitoring CMF levels near 0 and adjusting the stop-loss accordingly can help mitigate risk in case of a trend reversal.
- Exit Strategy: Implementing a partial exit strategy near major resistance levels can help secure gains while maintaining exposure for potential further upside, aligning with the ongoing bullish trend structure.
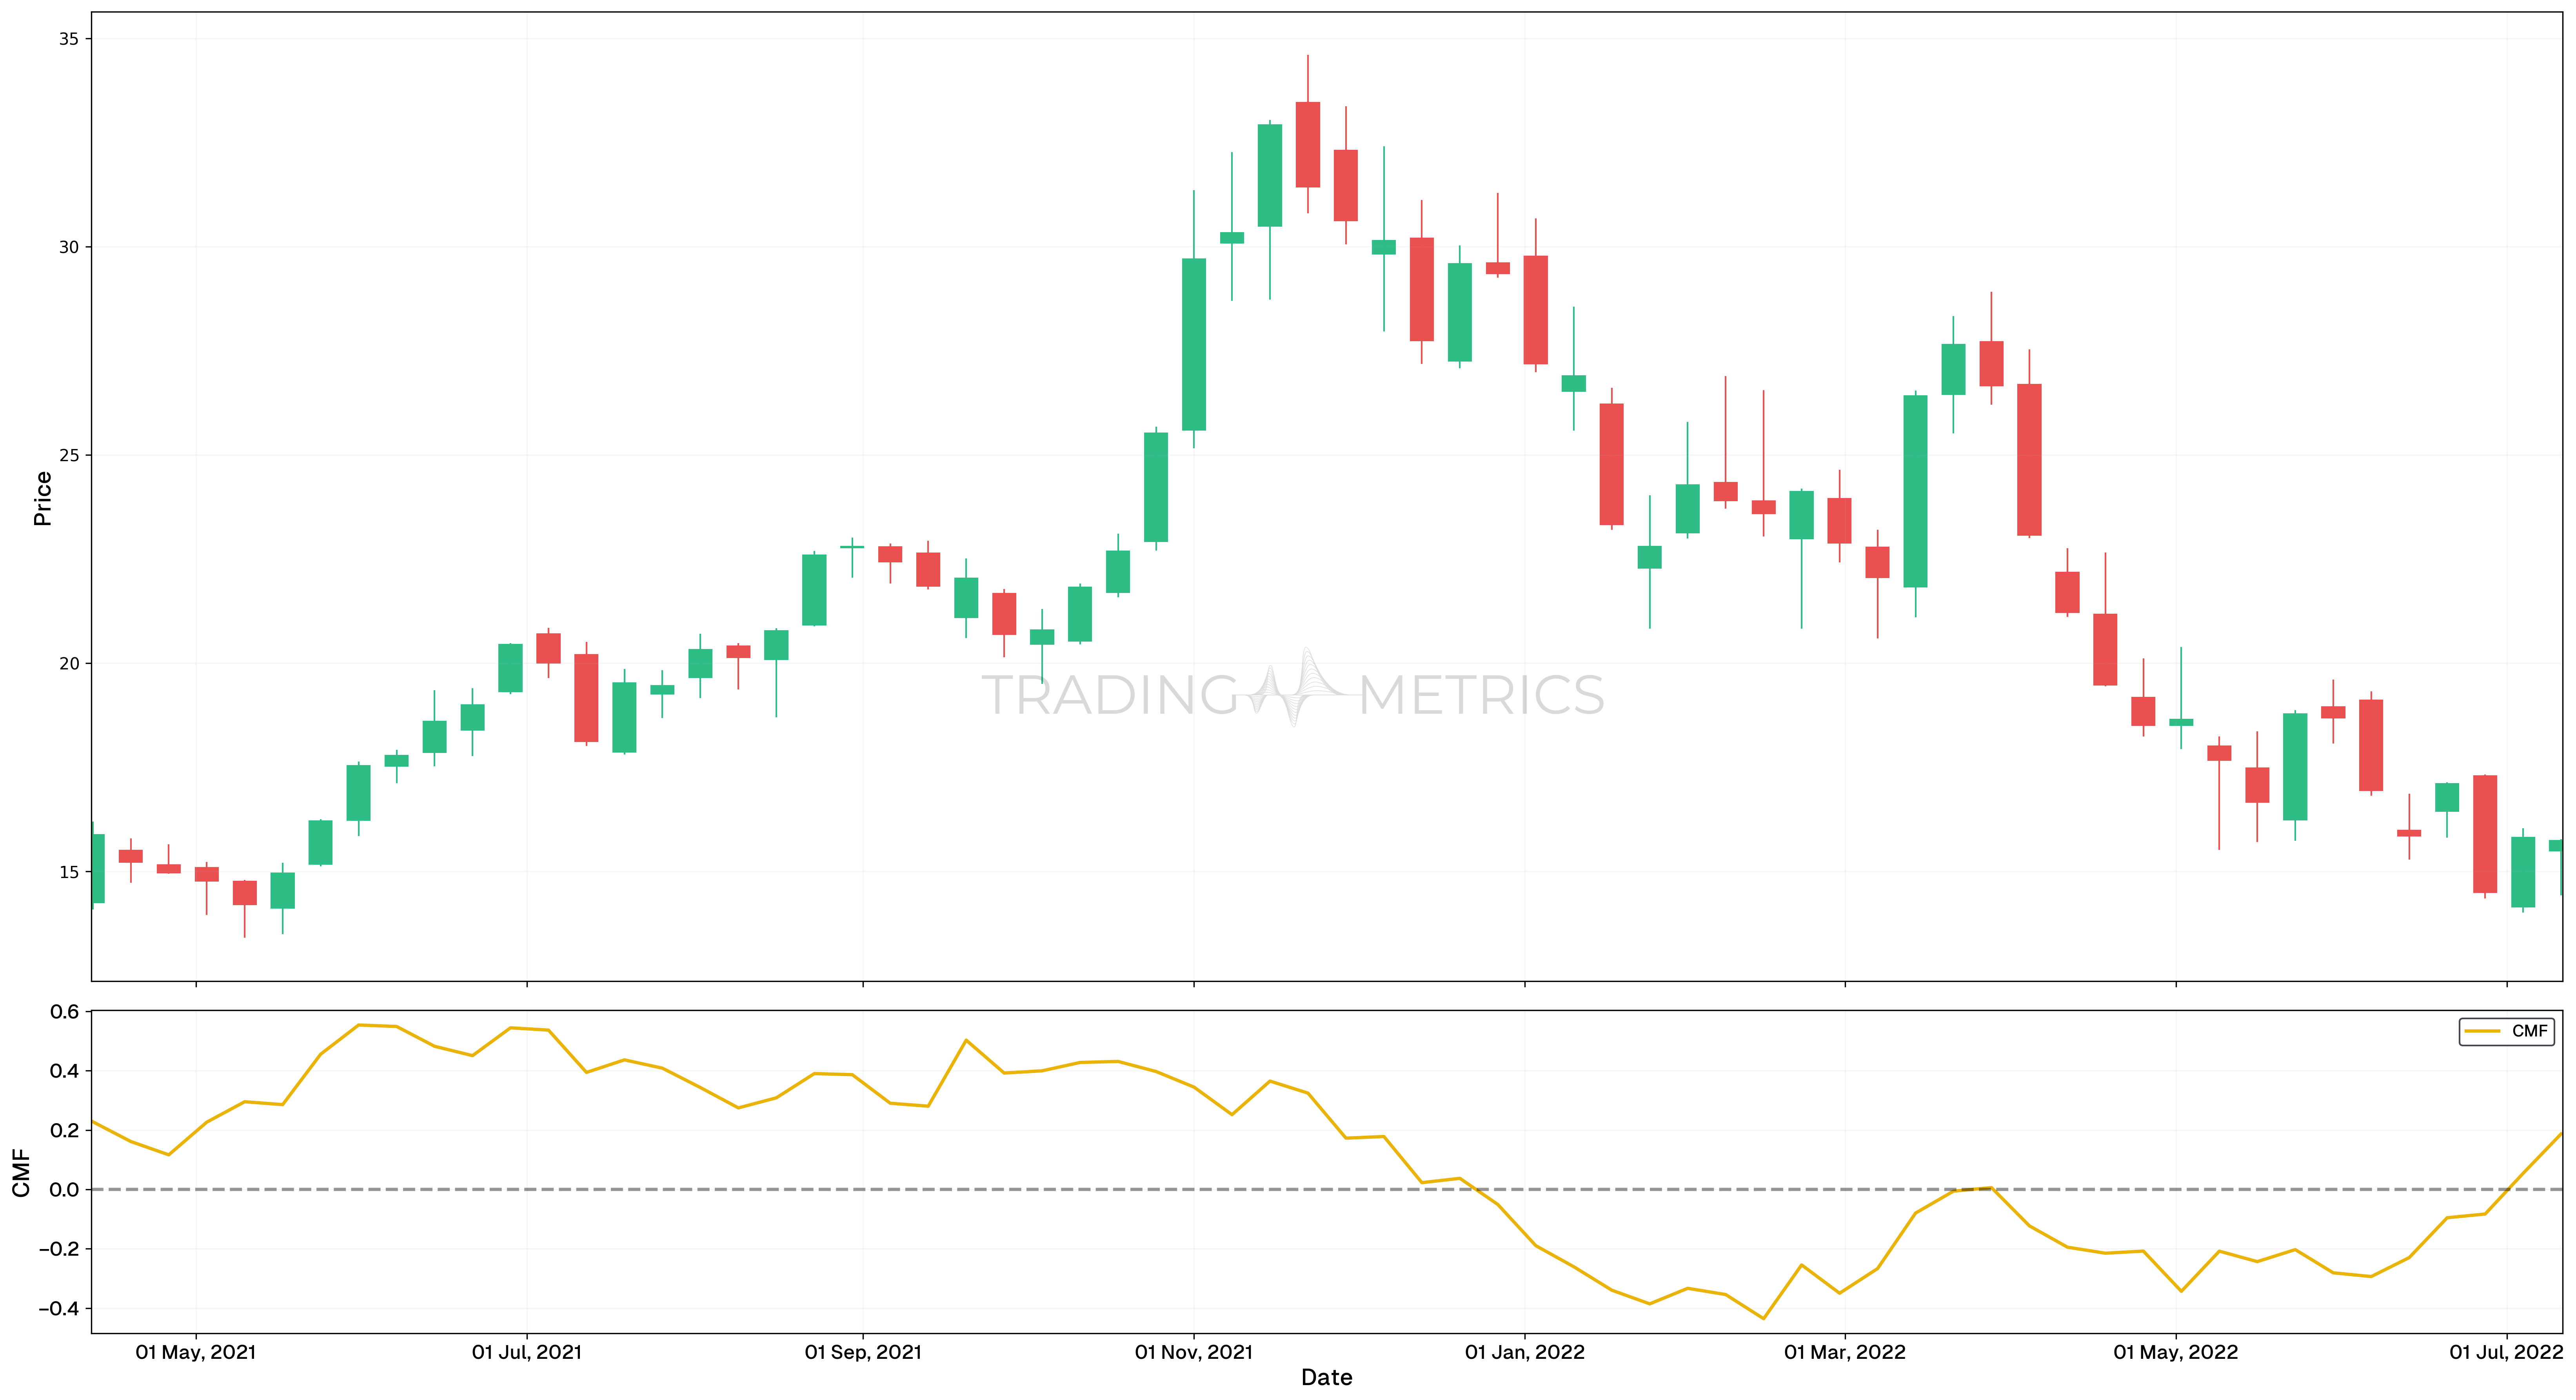
Bearish trend confirmation
When analyzing this chart, we’re focusing on the Chaikin Money Flow (CMF) indicator, specifically the CMF(20), which is designed to observe trends over a longer period. This tool is particularly useful for identifying whether a trend is likely to continue or reverse, especially in bearish markets.
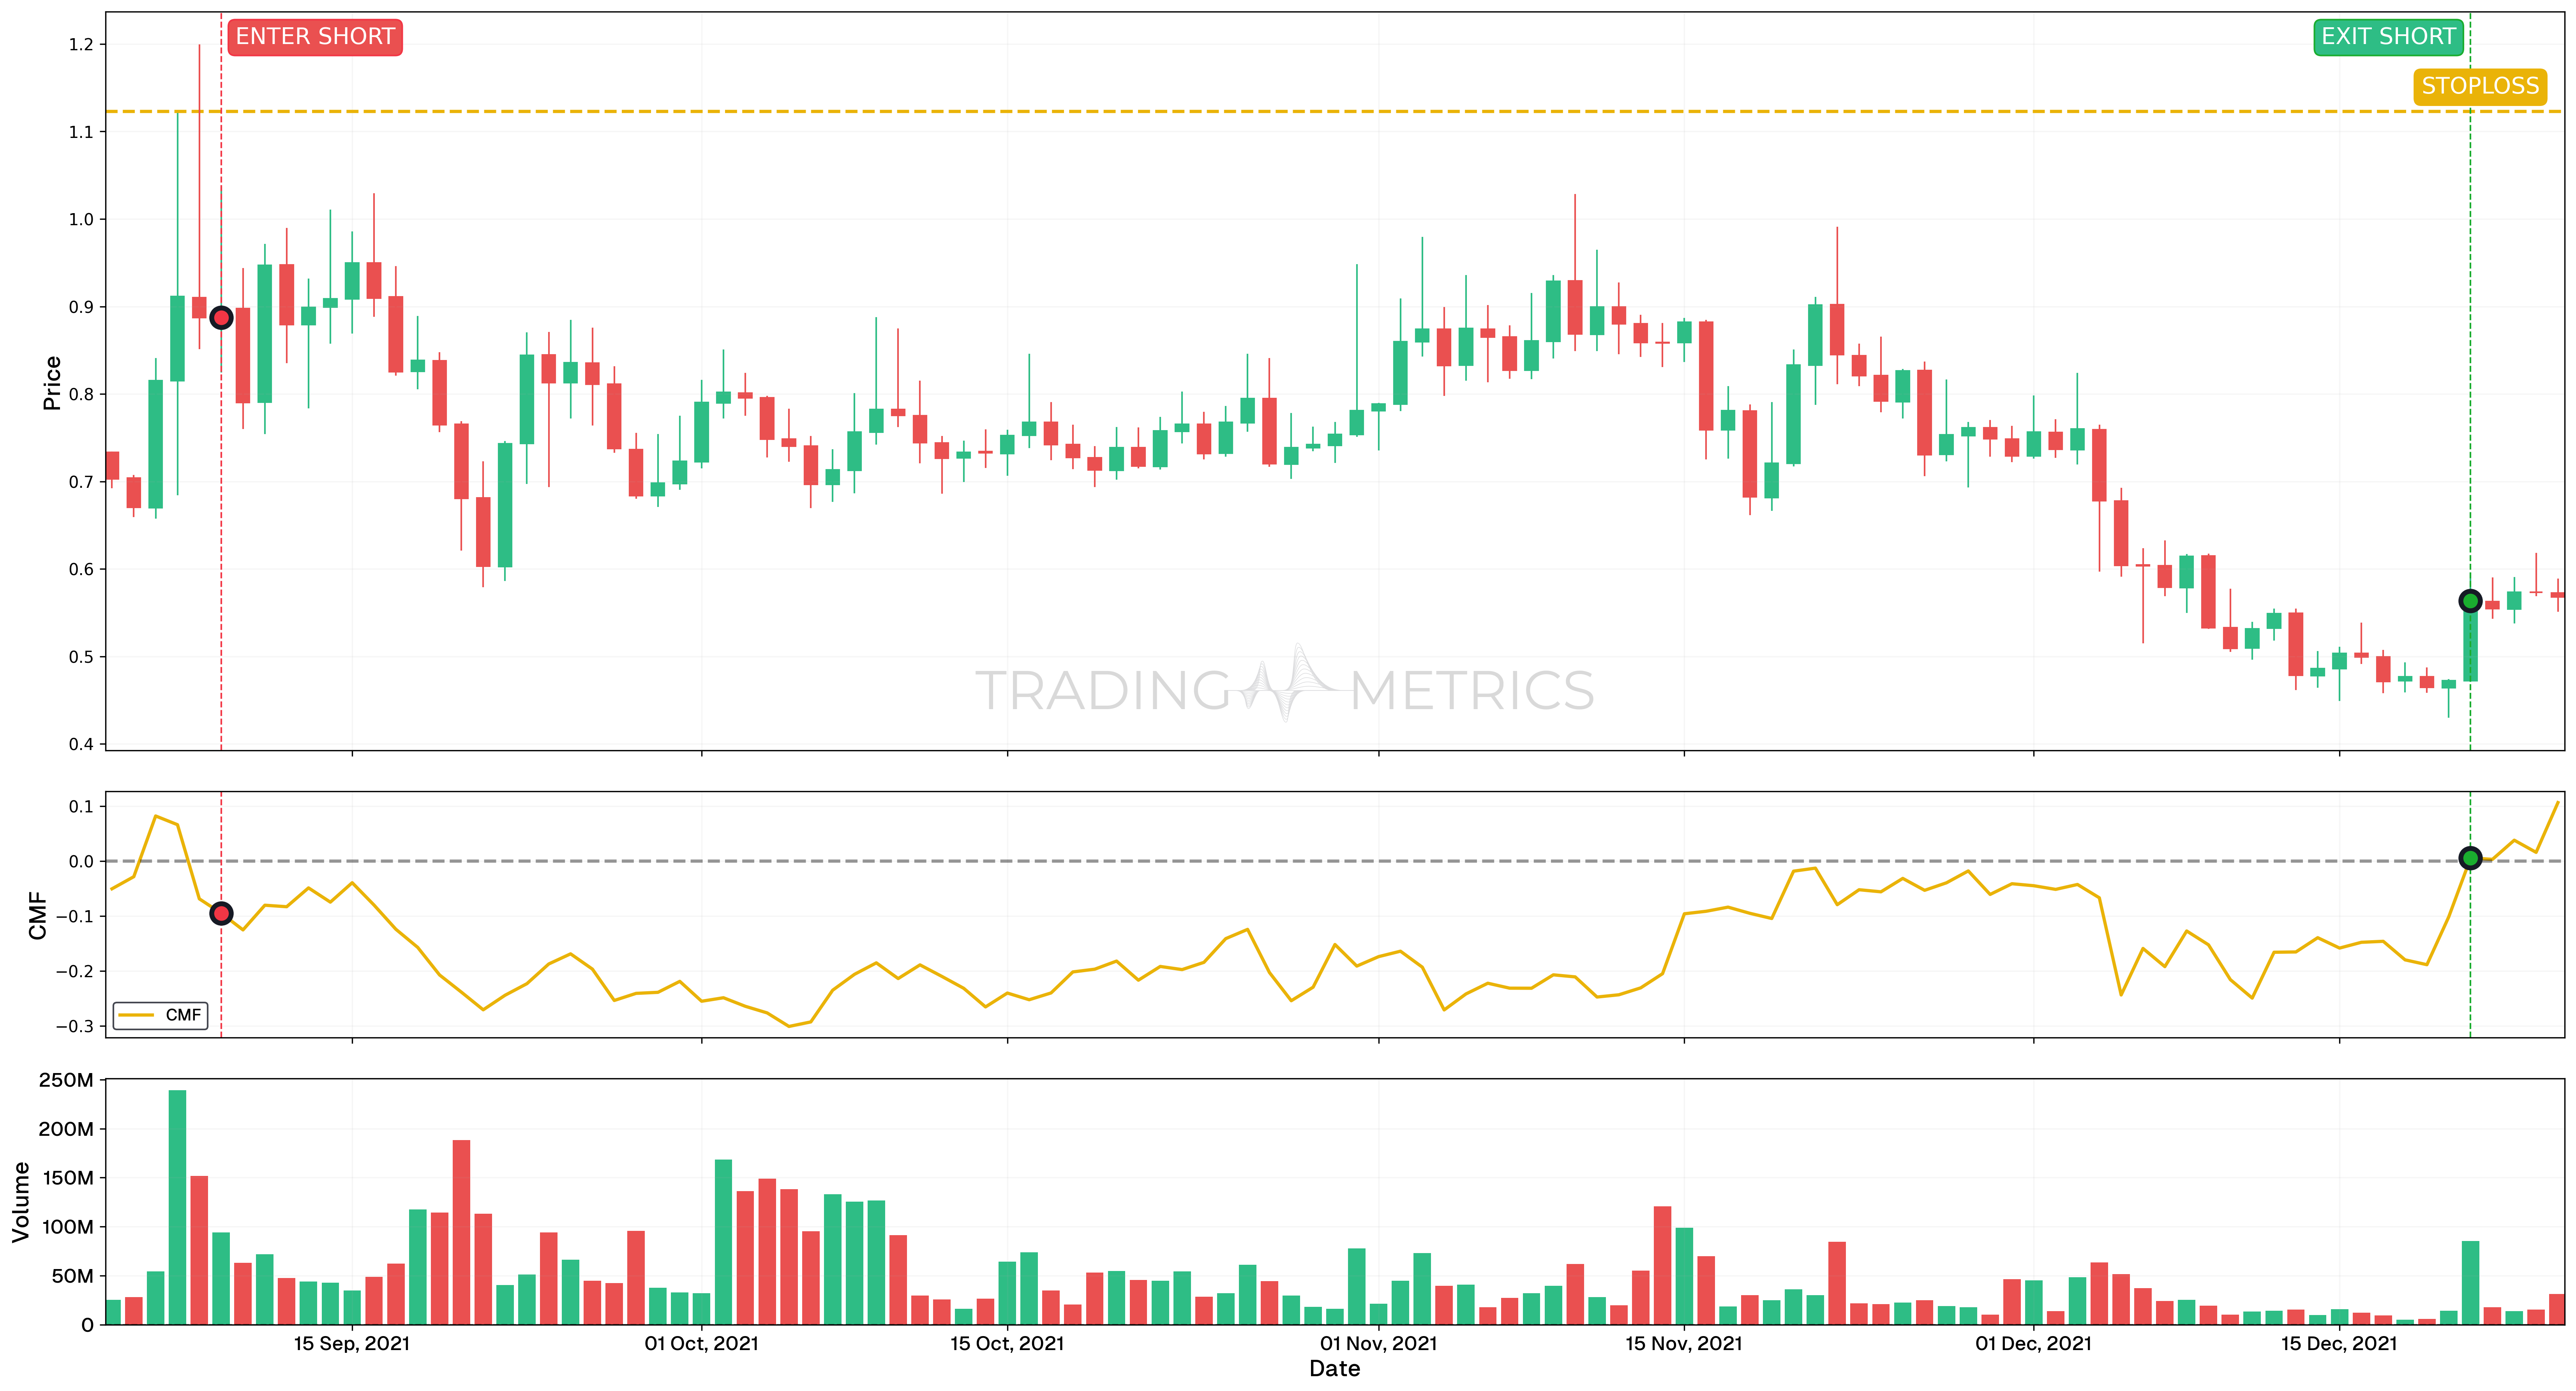
Analysis
- CMF(20) Below Zero: From September 09, 2021, to December 21, 2021, the CMF(20) remained consistently below zero, signaling sustained selling pressure. This bearish indicator aligned with a significant price decrease of -36.49% during this period.
- Price Action: The downward price movement during this period confirmed the bearish signal provided by the CMF(20), as the indicator also showed a continued decline.
- Volume Insight: On September 07, 2021, trading volume peaked at over 230,000,000. This spike in volume, combined with a decreasing CMF(20), reinforced the bearish outlook and marked an ideal Short Position Entry Signal.
Trade Setup
- Entry: The significant volume on September 07, 2021, paired with a declining CMF(20), provided a clear Short Position Entry Signal. This was a key indicator of sustained selling pressure and further price decline.
- Exit: Traders could monitor for a shift in the CMF(20) back toward zero or positive territory to identify a Short Position Exit Signal. A recovery in CMF(20) often indicates diminishing selling pressure and the potential for a reversal.
- Outcome: The price decrease of -36.49% from September 09, 2021, to December 21, 2021, validated the bearish signals provided by the CMF(20) and the corresponding high-volume entry point.
Risk Management
- Stop-Loss Placement: The stop-loss was strategically set at $1.123, aligning with a well-established support/resistance zone identified during the previous price action. This level serves as a logical protective barrier while maintaining a controlled risk exposure.
- Position sizing: Position size was calculated to ensure a maximum risk exposure of 2% of trading capital, adhering to a disciplined risk management framework.
- Risk-Reward Analysis: The trade setup maintained a 1:1.37 Risk-Reward Ratio, optimizing the potential for reward relative to the defined risk, particularly given the strong bearish CMF(20) confirmation.
- Managing Volatility: Given the substantial decline in CMF(20), volatility may increase. Monitoring CMF levels around zero and adjusting the stop-loss accordingly can help mitigate risk in the event of a potential reversal.
- Exit Strategy: Implementing a partial exit strategy as the price approaches key support levels can help lock in gains while maintaining exposure for continued downside potential, aligning with the ongoing bearish trend context.
Combining Chaikin Money Flow (CMF) with Other Tools
To enhance its effectiveness, CMF is often used in conjunction with other technical analysis tools:
- Moving Averages (MA): Helps confirm trends. For example, if CMF is positive and the price is above its moving average, it strengthens the bullish signal.
- Relative Strength Index (RSI): When combined with RSI, CMF can help identify overbought or oversold conditions with added volume context.
- MACD (Moving Average Convergence Divergence): CMF can confirm MACD signals, making trade decisions more robust.
Divergence Detection: Look for divergences between CMF and price to spot potential trend reversals before they occur.
Key Points
- Volume and Price Indicator: The Chaikin Money Flow (CMF) measures the accumulation and distribution of an asset over a specified period, combining volume and price movement to gauge buying or selling pressure.
- Range Interpretation: Positive CMF values indicate accumulation (buying pressure). Negative CMF values indicate distribution (selling pressure).
- Signal Strength: The closer the CMF value is to +1 or -1, the stronger the buying or selling pressure, respectively.
- Trend Confirmation: Positive CMF supports an uptrend. Negative CMF supports a downtrend.
- Divergence Signals: Bullish divergence means that price makes lower lows while CMF makes higher lows. Bearish divergence means that price makes higher highs while CMF makes lower highs.
- Combination with Other Indicators: CMF works well with trend-following tools like moving averages or MACD to validate trade signals.
- Customizable Periods: The default period for CMF is 20, but traders can adjust it to align with their strategy or the asset’s volatility.
- Market Condition Sensitivity: CMF performs well in trending markets but may give false signals during choppy or range-bound conditions.
- Dynamic Analysis: Regularly monitor CMF to detect shifts in buying or selling pressure as market conditions change.
- Backtesting and Integration: Include CMF in backtesting to evaluate its effectiveness and refine its role in your trading strategy.
Conclusion
The Chaikin Money Flow is a versatile and insightful tool in a trader’s arsenal. It helps identify buying and selling pressure by incorporating volume into the analysis, offering a deeper understanding of market dynamics. When used in combination with other technical indicators, CMF can significantly enhance trading strategies and decision-making processes. Always remember to look for divergences, monitor the zero line, and consider multiple time frames to make the most out of this powerful indicator.
Frequently Asked Questions
Quick answers based on this page's topic.
CMF measures the amount of Money Flow Volume over a specific period to determine if a market is under accumulation or distribution. It analyzes where the closing price falls relative to the daily range to identify the strength of buying versus selling pressure.
Values above zero indicate bullish sentiment and accumulation, suggesting buyers are in control. Conversely, values below zero signal bearish distribution and selling dominance. Crossing the zero line often serves as a key confirmation signal for a trend change.
CMF is excellent for spotting divergences. If price is making new highs but the CMF is trending lower or staying below zero, it suggests that the price move lacks strong volume support, warning of a potential reversal despite the rising price chart.