Trading the Bullish Cypher Pattern: Reversal Setup Basics
The Bullish Cypher Pattern is a precise bullish reversal signal in technical analysis, often emerging at the tail of a downtrend. Picture it as a harmonic dance - price tracing a distinct XABCD structure with Fibonacci ratios - signaling a reversal from bearish exhaustion to bullish resurgence. When this pattern forms, it’s a calculated cue that bearish momentum is fading, offering traders a chance to buy or go long as an uptrend prepares to take flight.
How to Identify the Bullish Cypher Pattern in Trading
The Bullish Cypher Pattern is a rare but highly reliable harmonic setup. Picture the market plunging lower, rebounding, then diving again into a deeper stretch — only to run out of energy before completing a full breakdown. That’s where buyers step in to reverse the trend. Here’s how to spot it:
Start with the Big Picture
This pattern forms after a steady downtrend. Sellers are pressing lower, but the Bullish Cypher’s unique Fibonacci structure reveals where exhaustion occurs and buyers gain the advantage.
Trace the XABCD Legs
The Bullish Cypher is built from five precise swings, each defined by Fibonacci rules. Identifying these ratios is what validates the setup.
- XA: The initial sharp decline that sets the structure.
- AB: A rebound upward into 38.2%–61.8% of XA.
- BC: A deep drop, extending into 113%–141.4% of AB, but never pushing below X.
- CD: A final rally upward into the 78.6% retracement of XC, marking the completion of the pattern.
- D Point: The Potential Reversal Zone (PRZ), where buyers prepare to take control.
Zero in on D (the Reversal Zone)
D is the completion point of the pattern. It forms at the 78.6% retracement of XC, which is the defining level of the Bullish Cypher. When price stabilizes here, the odds of a bullish reversal rise significantly.
Watch the Breakout
Confirmation comes when price rebounds at D and breaks higher.
- A strong bullish candle or
- A close above B
Both confirm that sellers have exhausted their push and buyers are stepping in. That’s your entry trigger.
Check Volume for Additional Confirmation
Volume flow is the final filter for conviction.
- Heavy selling on XA (sellers aggressive).
- Decline on AB (retracement phase).
- Another burst on BC (sellers overextending).
- Then a surge at D as buyers rush in.
When that spike appears, the Bullish Cypher’s bullish reversal is confirmed.
Rise Measure: Measure the XA leg height and project it upward from D, or target the 38.2% or 61.8% retracement of XC for a realistic price target.
How to Trade the Bullish Cypher Pattern (Trading Example)
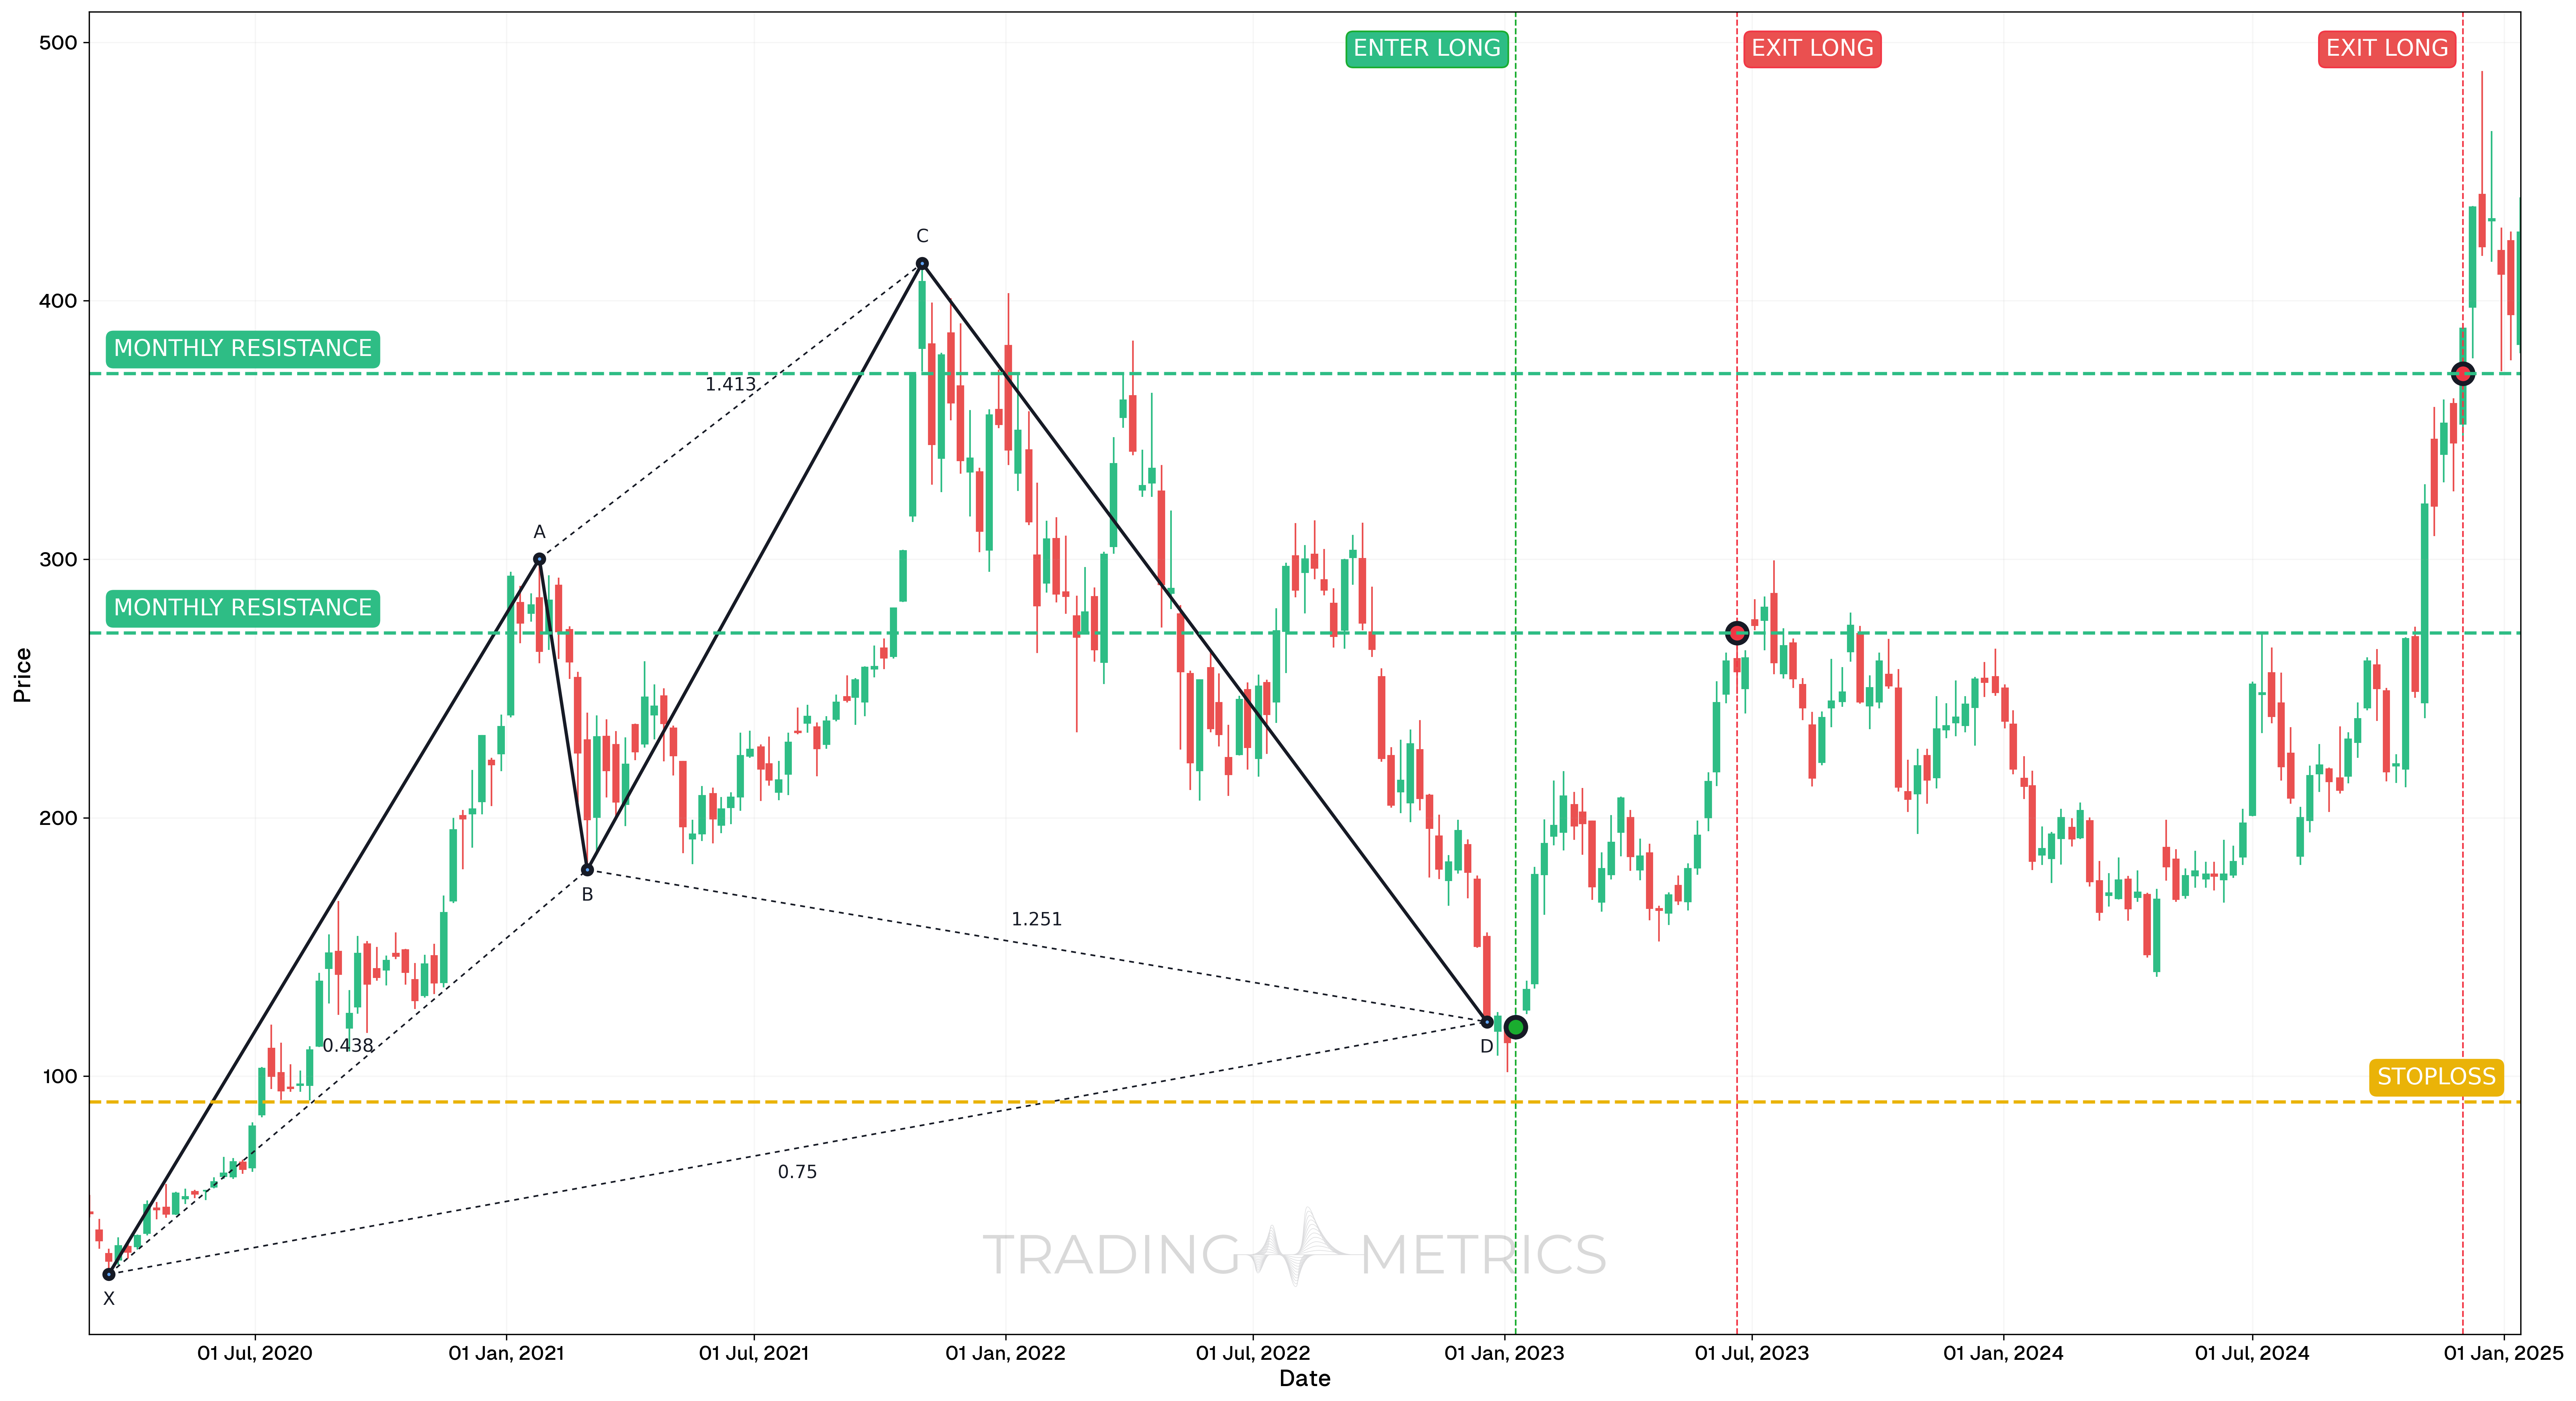
This example demonstrates how to trade the Bullish Cypher harmonic pattern using the TSLA stock on the weekly timeframe. The pattern formed over a multi-year period and presented a high-probability reversal from a deep retracement zone.
Analysis
Between March 3, 2020, and January 13, 2025, TSLA formed a textbook Bullish Cypher pattern on the weekly chart. Price completed the pattern with a strong Bullish Hammer at the PRZ (Potential Reversal Zone) on January 9, 2023, around $118.96, which also aligned with previous structural support.
Trade Setup
- Entry: Entered on January 9, 2023, at $118.96, following confirmation via a Bullish Hammer and harmonic structure completion.
- Exit: Exited in multiple stages, aligned with long-term resistance zones:
- TP1: June 20, 2023, at $271.43
- TP2: December 2, 2024, at $371.74
- Outcome: The Bullish Cypher led to a long-term, multi-leg rally, capturing significant gains with methodical exits at key levels.
Risk Management
- Stop-Loss placement: Set below the X-point at $90, ensuring invalidation only if the full structure broke.
- Position sizing: Calculated using a 2% capital risk model, adjusted for the wide structure typical of weekly harmonic setups.
- Volatility Consideration: Volatility had compressed during the late 2022 decline, with reversal acceleration confirming momentum shift upon breakout.
- Pattern Confirmation: The presence of a Bullish Hammer, strong historical confluence, and pattern symmetry increased the confidence in reversal strength.
Volume Harmony: A volume spike at D with confirmation lifts the pattern into a bullish surge.
Pre-Trade Checklist
Harmonic patterns demand strict discipline: if invalidation occurs, exit immediately rather than adjusting mid-trade.
Key Points
- Fibonacci Precision: Exact ratios (38.2%-61.8% XA, 113%-141.4% AB, 78.6% XC) boost reliability - loose fits dilute it.
- Time Frame: Shines brightest on daily or weekly charts after downtrends.
- Combine with Indicators: Use moving averages or RSI to confirm the reversal.
- Breakout Confirmation: A close above B sets the turn - don’t jump at D alone.
- Price Target: Measure the XA leg or use Fibonacci Retracements of XC for targets above the close.
- Risk Management: Set a stop-loss below C or D to limit losses if it fails.
Wait for the Harmony: Acting before confirmation risks a dissonant trap - let the reversal align.
Conclusion
The Bullish Cypher Pattern is a trader’s harmonic tool for catching bullish reversals. Its XABCD dance, paired with volume, RSI, and moving averages, can tune big gains. Whether in crypto, stocks, or forex, this pattern sharpens your edge. Stay precise, manage your risk, and let the Bullish Cypher align - that Fibonacci rhythm could lift into a winning trade.
Frequently Asked Questions
Quick answers based on this page's topic.
The Cypher identifies a 'failed breakdown.' By requiring point C to drop below point A before reversing at point D (a 78.6% retracement of XC), it captures the moment when short-sellers are trapped by a false breakout, fueling a rapid bullish recovery.
Point D must complete at a precise 78.6% Fibonacci retracement of the move from point X to point C. This level acts as a high-precision pivot point where the market's bearish energy is mathematically exhausted, signaling a high-probability entry for long positions.
The primary target is the 38.2% retracement of the CD leg, with a secondary target at the 61.8% retracement. These levels allow traders to lock in gains quickly, as the 'trap' nature of the Cypher often leads to a fast but sometimes volatile initial bounce.