Trading the Bearish Bat Pattern: Advanced Shorting Strategy
The Bearish Bat Pattern is a refined bearish reversal signal in technical analysis, often swooping in at the tail of an uptrend. Picture it as a harmonic flight - price tracing an XABCD structure with precise Fibonacci ratios - dropping from bullish highs to bearish lows. When this pattern forms, it’s an elegant sign that bullish momentum is waning, offering traders a chance to sell or go short as a downtrend takes wing.
How to Identify the Bearish Bat Pattern in Trading
The Bearish Bat Pattern is one of the most precise harmonic setups. Picture an elegant arc: the market rallies, pulls back, climbs again, but ultimately stalls at a deep Fibonacci Retracement. That’s where momentum runs out and sellers seize control. Here’s how to spot it:
Start with the Big Picture
This pattern forms after a strong uptrend. Buyers are in charge, but the harmonic ratios suggest exhaustion ahead. The Bearish Bat gives you a blueprint to catch the turn before the decline starts.
Trace the XABCD Legs
The structure is built from five distinct swings, each defined by exact Fibonacci proportions. Recognizing these ratios is what validates the pattern.
- XA: The initial surge upward that sets the stage.
- AB: A retracement down into 38.2%–50% of XA.
- BC: Another rally, retracing 38.2%–88.6% of AB but never breaking above X.
- CD: The final leg down into the 88.6% retracement of XA, often aligning with the 161.8%–261.8% projection of BC.
- D Point: Completion of the Bearish Bat, and the potential reversal zone where sellers step in.
Zero in on D (the Reversal Zone)
D is the critical point. It lines up with the 88.6% retracement of XA, reinforced by the BC projection zone. If price stalls and turns here, you’ve found the harmonic symmetry that signals exhaustion.
Watch the Breakdown
Confirmation comes when price fails at D and pushes back down.
- A sharp bearish candle or
- A close below B
Both confirm that sellers are taking over. That’s your entry trigger.
Check Volume for Additional Confirmation
Volume flow adds conviction by showing if the reversal is supported by real market participation.
- Strong volume on XA (buyers in control).
- Lighter volume on AB and BC (weaker participation).
- Then a surge at D as sellers hit back.
When you see that spike, the Bearish Bat’s reversal has real weight behind it.
Drop Wing: Measure the XA leg height and project it downward from D, or target the 38.2% or 61.8% retracement of XD for a realistic price target.
How to Trade the Bearish Bat Pattern (Trading Example)
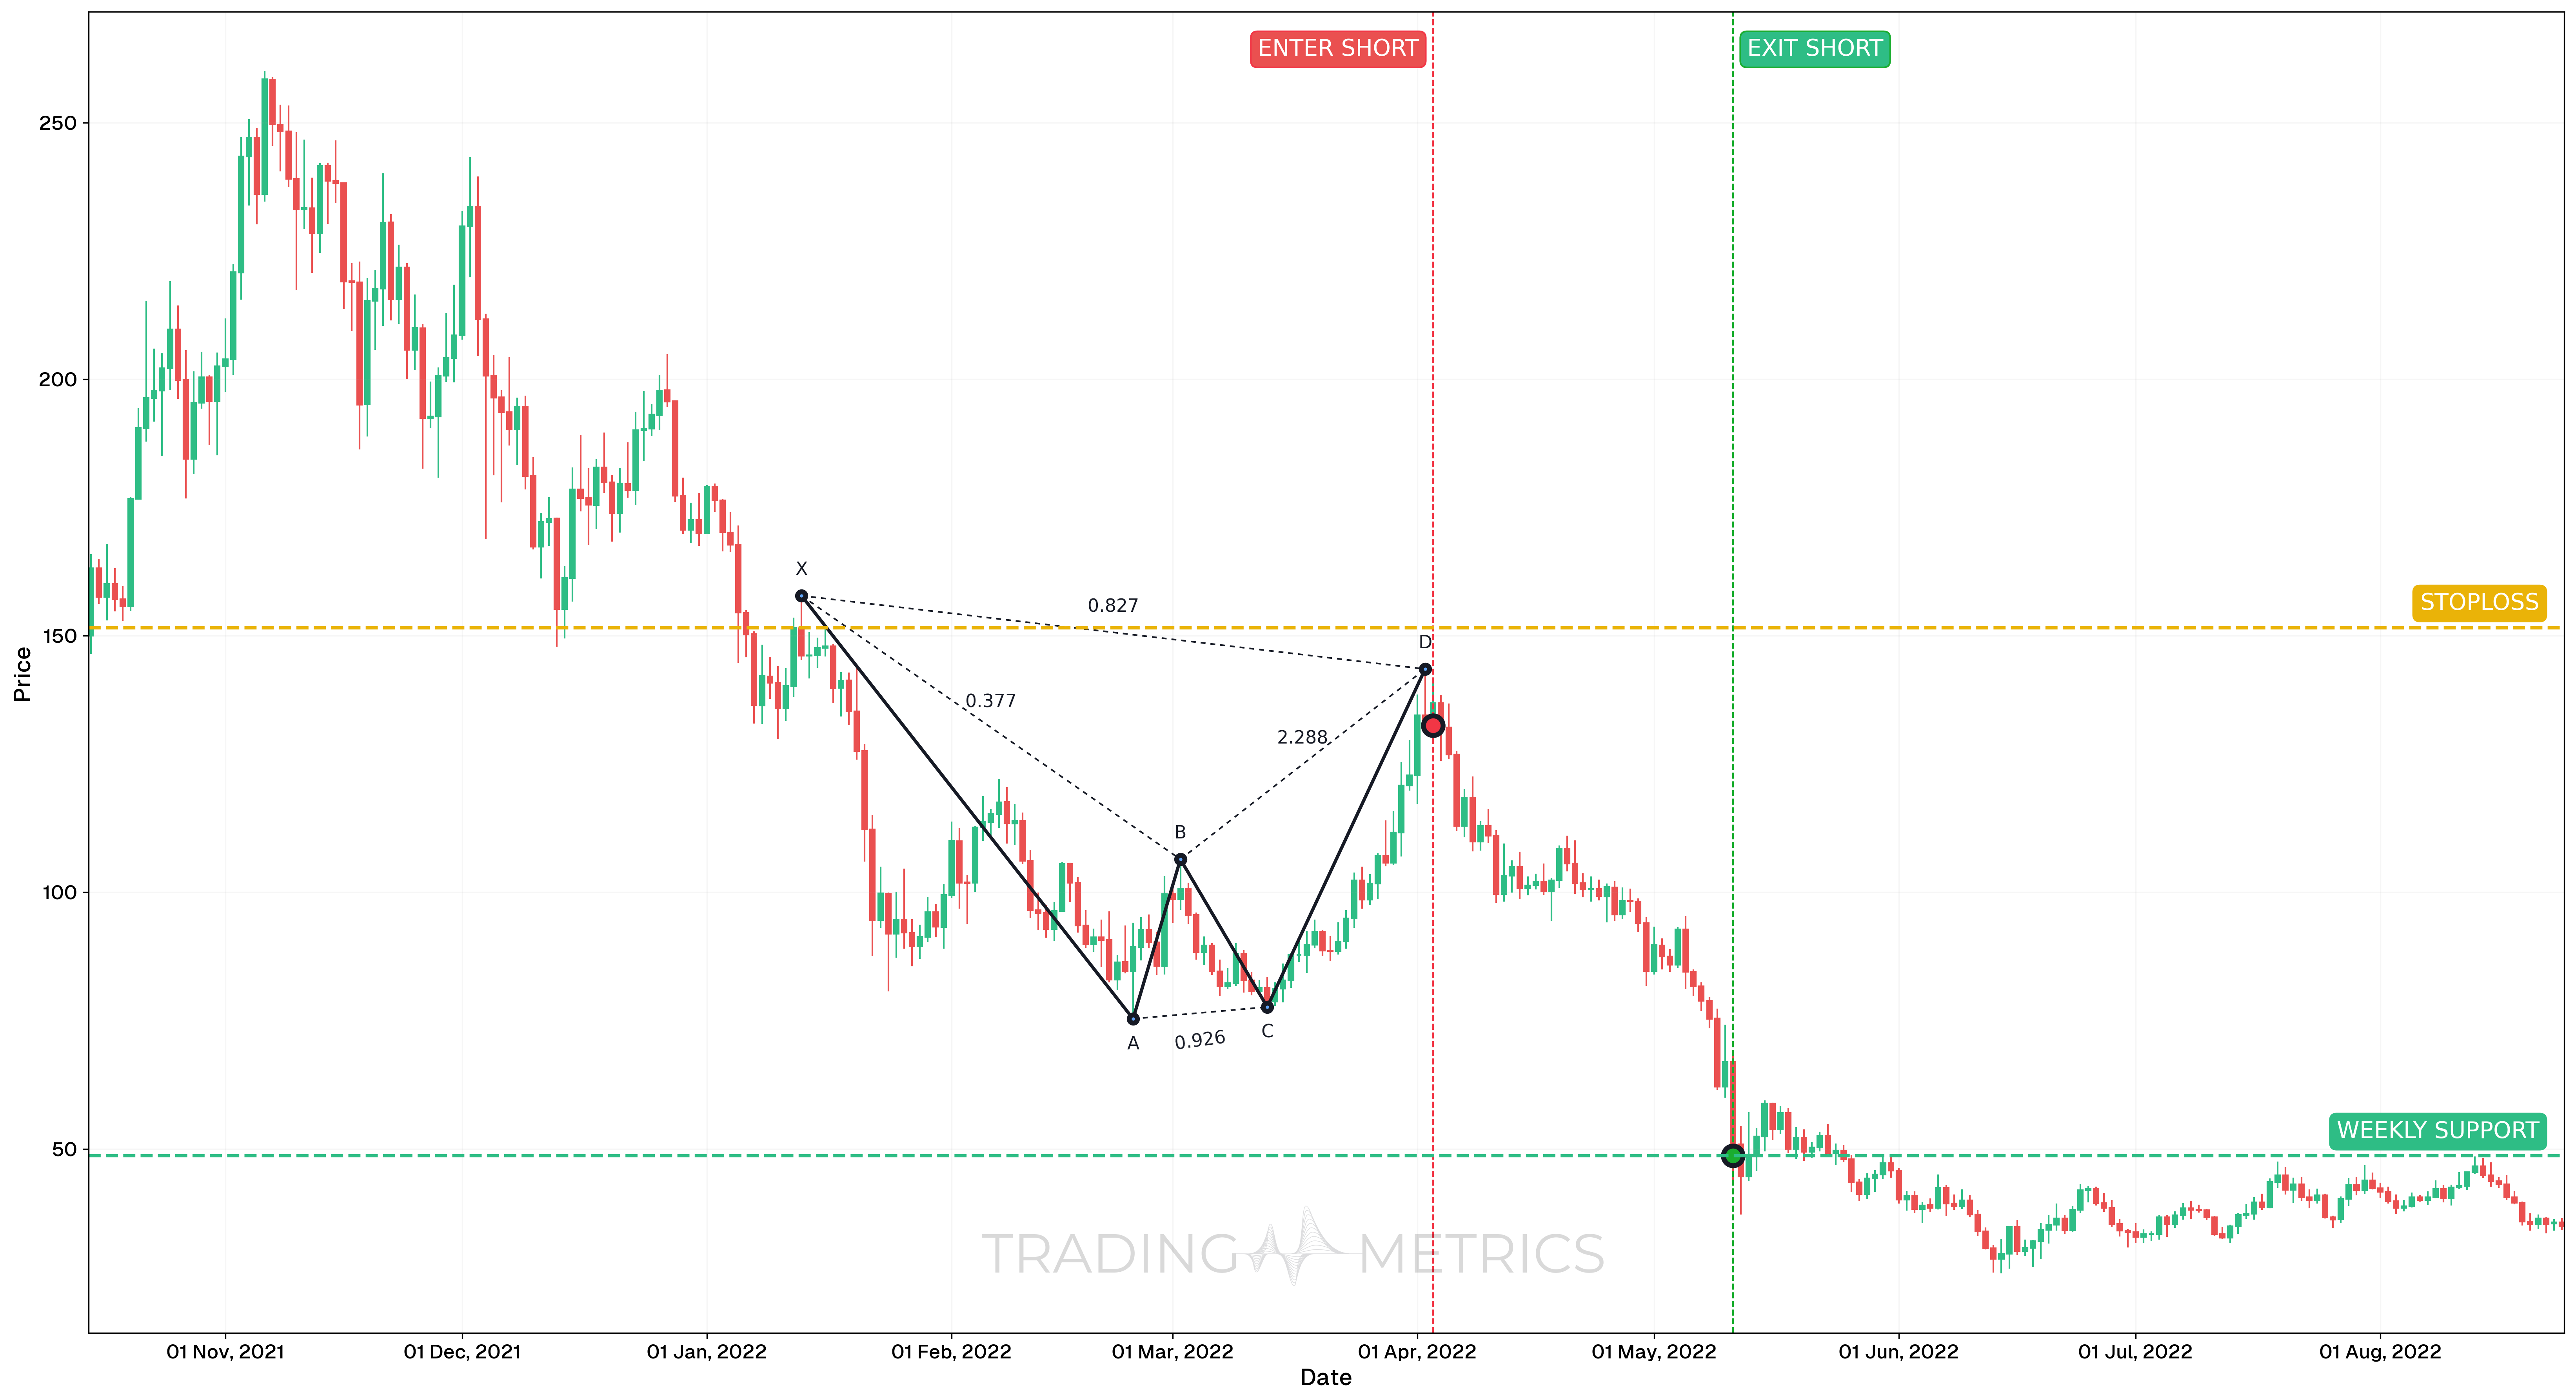
To demonstrate the application of the Bearish Bat harmonic pattern, we’ll explore a real example on the SOLUSDT pair using the daily chart. This pattern developed after an extended bullish phase, marking a potential trend reversal with high reward potential.
Analysis
Between October 2021 and August 2022, SOLUSDT formed a Bearish Bat pattern. The structure completed around early April 2022, with price reacting strongly at the D-point. The completion zone also aligned with a Shooting Star candle, adding further confluence for a bearish reversal.
Trade Setup
-
Entry: The trade was initiated on April 3, 2022, at $181.53, shortly after the Bearish Bat completion and confirmation from a Shooting Star candlestick. Entry confidence was supported by:
- Completion of the harmonic structure at a key Fibonacci confluence zone
- Strong upper wick rejection Shooting Star indicating exhaustion
- Indicators showing signs of weakening momentum
-
Exit: The trade was closed on May 11, 2022, at $48.64, once price reached a weekly support area and signs of a potential short-term bottom began forming.
-
Outcome: The Bearish Bat pattern successfully anticipated a major top in SOLUSDT, resulting in a sharp and extended downtrend that provided excellent downside potential for short trades.
Risk Management
- Stop-Loss placement: The stop-loss was set at $151.56, just above the X-point and above the invalidation of the bearish reversal structure.
- Risk-Reward Ratio: 4.43:1
This high Risk-Reward Ratio reflected the harmonic precision and timing of entry, offering strong downside potential relative to risk. - Position sizing: The trade used a 2% capital risk model, calculated between the entry price and the stop-loss level.
- Volatility Consideration: Volatility began rising after pattern completion, further confirming the bearish case. Entering after reversal confirmation helped reduce whipsaw risk.
- Exit Strategy: Targeting a key weekly support allowed the trader to lock in profits before a potential bounce, avoiding overextension.
Volume Wing: A volume spike at D with confirmation lifts the pattern into a bearish flight.
Pre-Trade Checklist
Dive the Proof: Pair the pattern with volume spikes and indicators like RSI to dodge fakes and boost your odds.
Key Points
- Fibonacci Precision: Exact ratios (38.2%-50% AB, 38.2%-88.6% BC, 88.6% XA) boost reliability - loose fits dilute it.
- Time Frame: Flies strongest on daily or weekly charts after uptrends.
- Combine with Indicators: Use moving averages or RSI to confirm the reversal.
- Breakdown Confirmation: A close below B sets the turn - don’t jump at D alone.
- Price Target: Measure the XA leg or use Fibonacci Retracements of XD for targets below the close.
- Risk Management: Set a stop-loss above D or C to limit losses if it fails.
Wait for the Drop: Acting before confirmation risks a Bearish Bat trap - let the reversal take wing.
Conclusion
The Bearish Bat Pattern is a trader’s refined tool for catching bearish reversals. Its XABCD arc, paired with volume, RSI, and moving averages, can glide into sharp gains. Whether in crypto, stocks, or forex, this pattern sharpens your edge. Stay precise, manage your risk, and let the Bearish Bat align - that harmonic dive could land a winning trade.
Frequently Asked Questions
Quick answers based on this page's topic.
The Bat is defined by its deep 88.6% Fibonacci retracement at the D completion point. Unlike the Gartley (which completes at 78.6%), the Bat allows the price to retrace much deeper into the original move, identifying the absolute final zone of buyer exhaustion.
A valid Bat requires a shallow B-point, typically between a 38.2% and 50% retracement of the XA leg. If the B-point retraces 61.8% or more, the pattern is likely a Gartley or Butterfly instead. This distinction is crucial for setting the correct entry at point D.
Yes, because the 88.6% retracement is a very specific and 'harmonious' coordinate that institutional algorithms frequently monitor. Because the entry is so deep, the Bat often offers an exceptional Risk-Reward Ratio, as the stop-loss can be placed very close to point X.