Mastering the Bearish Butterfly: Harmonic Reversal Analysis
The Bearish Butterfly Pattern is an intricate bearish reversal signal in technical analysis, often fluttering into view at the end of an uptrend. Picture it as harmonic wings - price tracing an XABCD structure with precise Fibonacci ratios - dropping from bullish highs to bearish lows. When this pattern forms, it’s a delicate yet potent sign that bullish momentum is exhausted, offering traders a chance to sell or go short as a downtrend takes flight.
How to Identify the Bearish Butterfly Pattern in Trading
The Bearish Butterfly Pattern is a powerful harmonic reversal signal. Imagine the market pushing upward in waves, only to stretch too far beyond its natural limits. At that overextended point, buyers lose strength and sellers take control. Here’s how to spot it:
Start with the Big Picture
This pattern forms after a sustained uptrend. Bulls have been driving higher, but the harmonic ratios show when the move becomes unsustainable. The Bearish Butterfly signals that the rally is likely to flip into a reversal.
Trace the XABCD Legs
The structure is made of five precise swings, each defined by Fibonacci relationships. Identifying these ratios is what validates the setup.
- XA: The initial strong rally that sets the foundation.
- AB: A retracement down into 78.6% of XA.
- BC: Another rally upward, retracing 38.2%–88.6% of AB without breaking past X.
- CD: The final leg upward, extending to the 127% of XA, often reaching as far as the 161.8% extension of XA, and supported by the 161.8%–224% projection of BC.
- D Point: The completion zone of the Bearish Butterfly and the key reversal area.
Zero in on D (the Reversal Zone)
D is the point where the overextension becomes clear. Confluence occurs at the 127%–161.8% extension of XA combined with the BC projection range. If price stalls here, sellers are likely preparing to take control.
Watch the Breakdown
Confirmation comes when price fails at D and reverses lower.
- A strong bearish candle or
- A close below B
Both confirm that buyers have lost control and a reversal is in motion. That’s your entry trigger.
Check Volume for Additional Confirmation
Volume helps verify whether the reversal has real weight behind it.
- Strong volume on XA (bulls driving hard).
- Lighter on AB and BC (momentum cooling).
- Then a surge at D as sellers strike back.
When you see that spike, the Bearish Butterfly’s reversal gains credibility.
Drop Flutter: Measure the XA leg height and project it downward from D, or target the 38.2% or 61.8% retracement of XD for a realistic price target.
How to Trade the Bearish Butterfly Pattern (Trading Example)
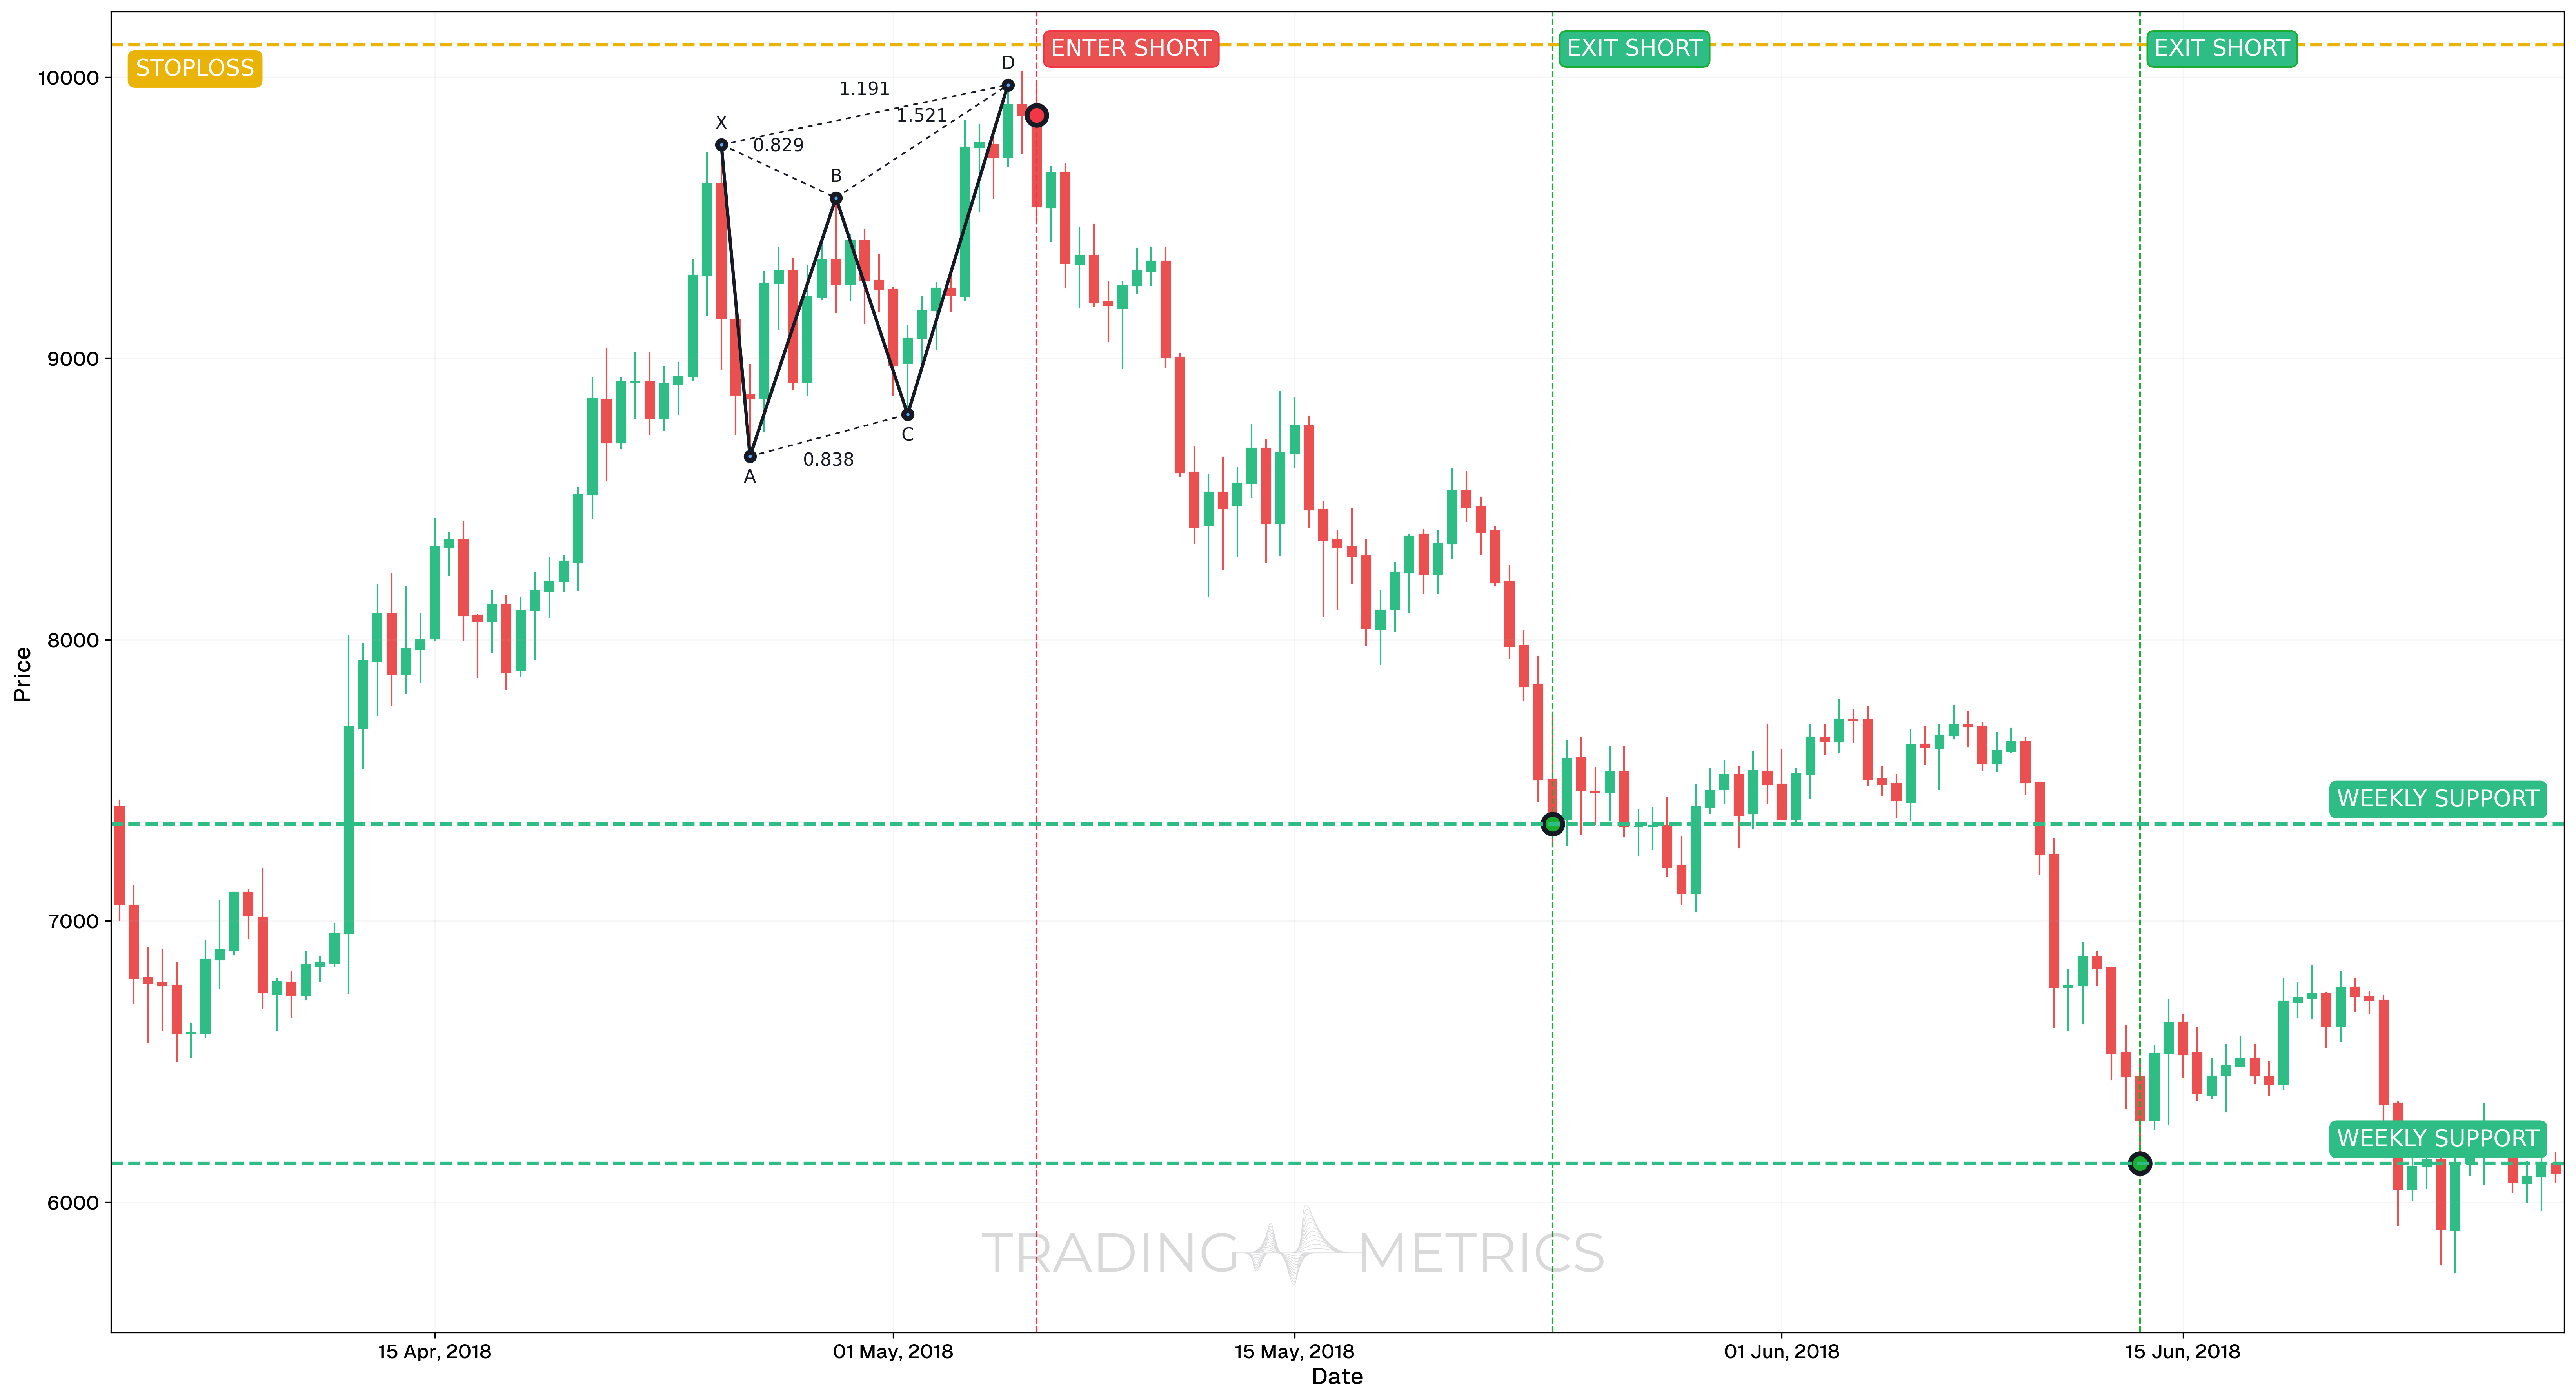
To demonstrate how the Bearish Butterfly harmonic pattern can be traded, we’ll analyze the BTCUSDT pair on the 12-hour chart during mid-2018. The pattern provided a clean reversal opportunity after a strong advance, supported by momentum divergence and structural exhaustion.
Analysis
Between April 4 and June 28, 2018, BTCUSDT formed a classic Bearish Butterfly pattern. The XA, AB, BC, and CD legs followed precise Fibonacci alignments, with the D-point completing near $9,863.99.
What added conviction was a clearly developing RSI Bearish Divergence, signaling potential exhaustion as price approached the PRZ (Potential Reversal Zone).
Trade Setup
-
Entry: The trade was entered at $9,863.99 on May 6, 2018, following:
- Full pattern completion at the D-point
- Visible RSI divergence between the C and D points
- Price reacting with rejection wicks on resistance
-
Exit: The trade was exited in multiple stages as price reversed and hit major support zones:
- May 24, 2018 (TP1): Exit at $7,345.01
- June 13, 2018 (TP2): Exit at $6,136.97
-
Outcome: The Bearish Butterfly setup captured a major reversal phase. Both targets were met as BTC underwent a sustained Drawdown. The trade benefited from divergence confirmation and precise harmonic completion.
Risk Management
- Stop-Loss placement: The stop-loss was placed just above the X-to-D extension at $10,115, allowing for slight overshoot within the PRZ (Potential Reversal Zone) range while maintaining risk control.
- Position sizing: Trade was sized using a 2% capital risk model, based on the distance between entry and stop-loss.
- Volatility Consideration: Volatility peaked near the pattern’s D-point, followed by contraction as price reversed. Waiting for divergence confirmation allowed reduced exposure to false breakouts.
- Adaptive Exit Strategy: Taking profit at known weekly support and key structural lows preserved gains while allowing flexible trend-following for more aggressive traders.
Volume Flutter: A volume spike at D with confirmation drops the pattern into a bearish surge.
Pre-Trade Checklist
Flutter the Proof: Pair the pattern with volume spikes and indicators like RSI to dodge fakes and boost your odds.
Key Points
- Fibonacci Precision: Exact ratios (78.6% AB, 38.2%-88.6% BC, 127%-161.8% XA) boost reliability - loose fits dilute it.
- Time Frame: Flutters strongest on daily or weekly charts after uptrends.
- Combine with Indicators: Use moving averages or RSI to confirm the reversal.
- Breakdown Confirmation: A close below B sets the turn - don’t jump at D alone.
- Price Target: Measure the XA leg or use Fibonacci Retracements of XD for targets below the close.
- Risk Management: Set a stop-loss above D to limit losses if it fails.
Wait for the Flutter: Acting before confirmation risks a Bearish Butterfly trap - let the reversal take flight.
Conclusion
The Bearish Butterfly Pattern is a trader’s intricate tool for catching bearish reversals. Its XABCD wings, paired with volume, RSI, and moving averages, can flutter into deep declines. Whether in crypto, stocks, or forex, this pattern sharpens your edge. Stay precise, manage your risk, and let the Bearish Butterfly align - that harmonic drop could land a winning trade.
Frequently Asked Questions
Quick answers based on this page's topic.
Unlike the Bat or Gartley which are 'internal' retracements, the Butterfly is an 'external' extension pattern. The D-point completes at a 127.2% to 161.8% extension of the XA leg, signaling that the uptrend has overextended itself into a 'Bull Trap' zone before reversing.
A valid Butterfly must have a B-point that retraces exactly 78.6% of the XA leg. This specific ratio is the 'harmonic signature' of the pattern; if the B-point is shallower (like 50%), the structure is more likely to evolve into a Bearish Crab pattern.
Since the D-point is an extension, the stop-loss is placed just beyond the 161.8% Fibonacci level of the XA leg. If the price continues to rise past this coordinate, the harmonic structure is invalidated, and the market is likely in a runaway trend rather than a harmonic reversal.