Trading the Bearish Cypher Pattern: Advanced Reversal Methods
The Bearish Cypher Pattern is a precise bearish reversal setup in technical analysis, most often forming near the peak of an uptrend. It features a distinct XABCD structure defined by Fibonacci ratios, signaling when bullish momentum is exhausted and bearish pressure is likely to take control.
How to Identify the Bearish Cypher Pattern in Trading
The Bearish Cypher Pattern is a rare but powerful harmonic formation. Imagine the market driving upward, pulling back, then making one more sharp push higher — only to stall before completing a deep retracement. That’s where sellers take control. Here’s how to spot it:
Start with the Big Picture
This pattern appears after a strong uptrend. Buyers are aggressive, but the Bearish Cypher’s unique Fibonacci structure highlights where exhaustion will likely occur and a reversal is ready to unfold.
Trace the XABCD Legs
The Bearish Cypher has five precise swings, each tied to specific Fibonacci rules. Recognizing these levels is what separates a valid setup from random price action.
- XA: A strong rally upward that sets the foundation.
- AB: A retracement downward into 38.2%–61.8% of XA.
- BC: A surge upward extending into 113%–141.4% of AB, but never moving beyond X.
- CD: A final decline into the 78.6% retracement of XC, creating the completion point.
- D Point: The potential reversal zone where sellers prepare to step in.
Zero in on D (the Reversal Zone)
D is where the pattern completes. It forms at the 78.6% retracement of XC, which is the defining level of the Bearish Cypher. If price stalls here, it marks the exhaustion of the uptrend and the entry of bearish pressure.
Watch the Breakdown
Confirmation comes when price fails at D and reverses lower.
- A strong bearish candle or
- A close below B
Both confirm that buyers are trapped and sellers are in control. That’s your entry trigger.
Check Volume for Additional Confirmation
Volume provides the final filter for conviction.
- Strong activity on XA (buyers in control).
- Lighter on AB (retracement).
- Another burst on BC (buyers overextending).
- Then a surge at D as sellers hit back.
When that spike appears, the Bearish Cypher’s bearish reversal is validated.
Drop Measure: Measure the XA leg height and project it downward starting at point D, or aim for the 38.2% or 61.8% retracement of XC as realistic price targets.
How to Trade the Bearish Cypher Pattern (Trading Example)
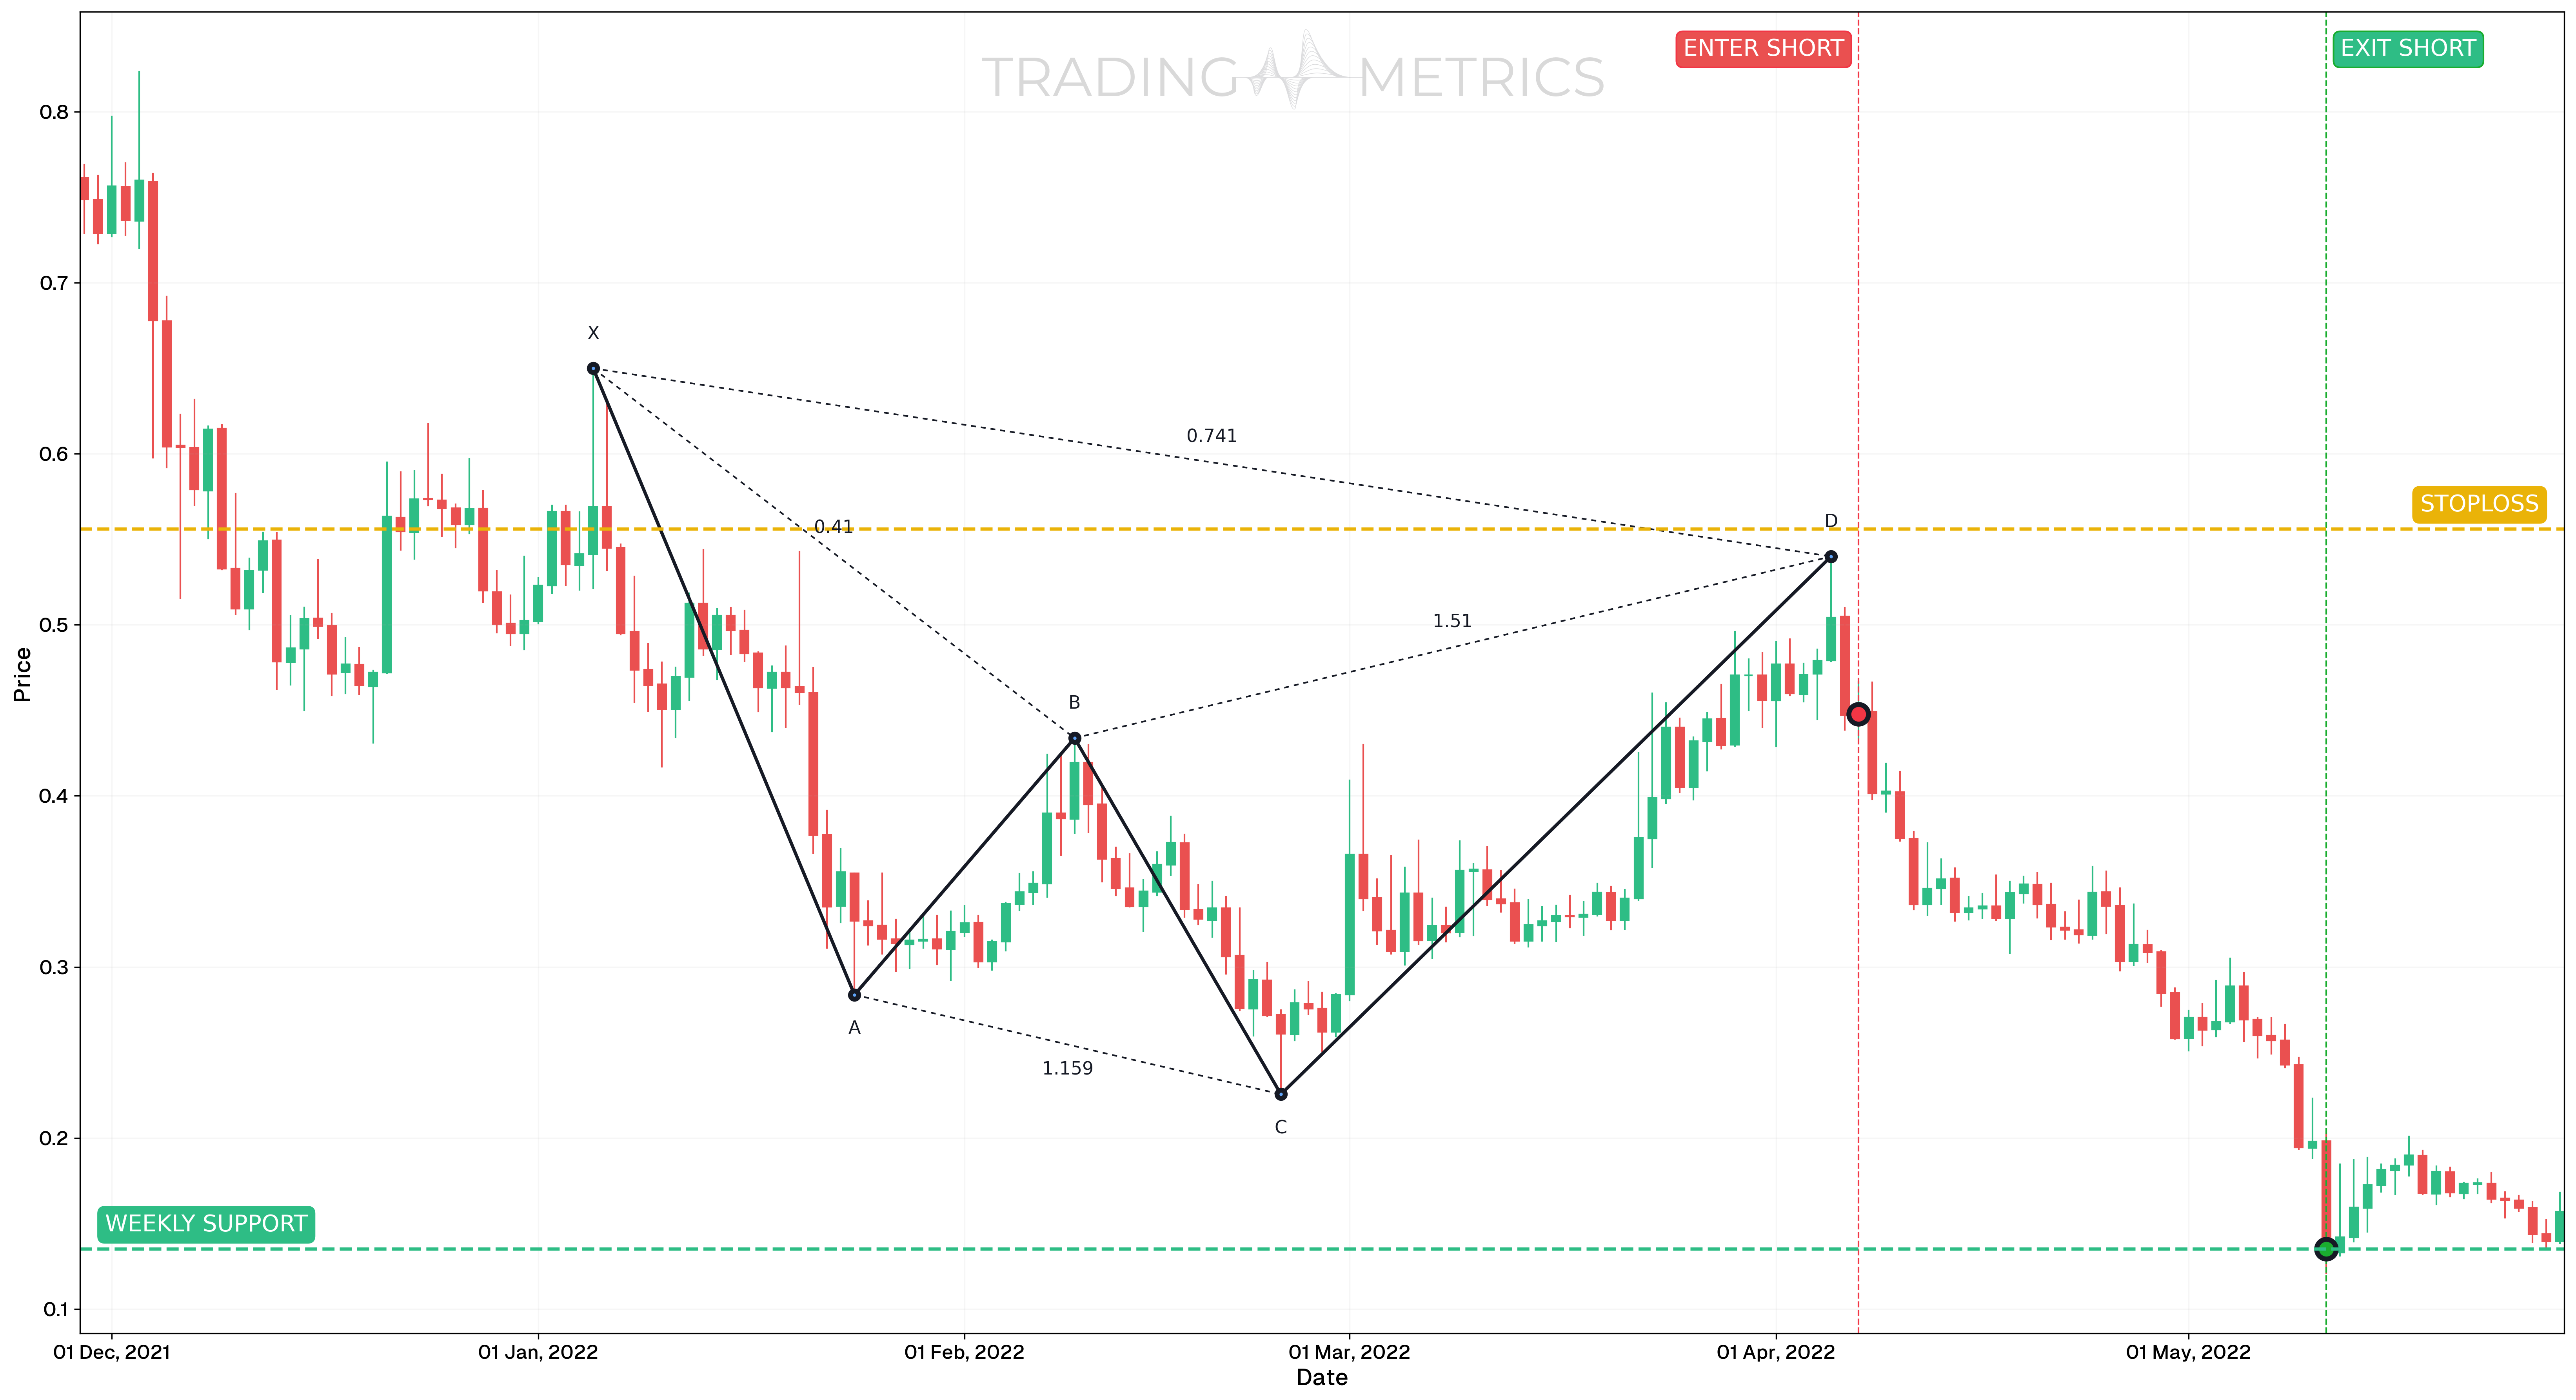
This example demonstrates how to trade the Bearish Cypher harmonic pattern using the FETUSDT pair on the daily timeframe. The pattern completed during a strong uptrend, followed by reversal signals confirming short entry.
Analysis
Between November 29, 2021, and May 28, 2022, FETUSDT developed a clean Bearish Cypher pattern. The PRZ (Potential Reversal Zone) was hit on April 7, 2022, around $0.556. A Shooting Star followed shortly after, then a Bearish Engulfing candle confirmed downside momentum.
Trade Setup
- Entry: Entered after the Bearish Engulfing candle on April 7, 2022, at $0.448, once confirmation aligned with the Bearish Cypher PRZ (Potential Reversal Zone) rejection.
- Exit: The trade was closed at $0.135 on May 11, 2022, near a key Weekly Support level.
- Outcome: The pattern achieved full target reach, with confirmation patterns improving entry timing and confidence.
Risk Management
- Stop-Loss placement: Placed above the X-point at $0.556, beyond the harmonic invalidation zone.
- Risk-Reward Ratio: 1:2.90 A strong reward relative to the structural risk, based on a well-defined PRZ (Potential Reversal Zone) and target zone.
- Position sizing: Calculated using a 2% capital risk model, based on entry-to-stop distance.
- Volatility Consideration: Entry followed a volatility spike into the PRZ (Potential Reversal Zone), and signals confirmed downside bias with compression after reversal candles.
- Pattern Confirmation: The combination of harmonic PRZ (Potential Reversal Zone) rejection, Shooting Star, and Bearish Engulfing improved entry quality significantly.
Pre-Trade Checklist
Volume Harmony: A volume spike at D with confirmation sharpens the pattern into a bearish surge.
Key Points
- Fibonacci Precision: Exact ratios (38.2%-61.8% AB, 113%-141.4% BC, 78.6% CD) boost reliability - loose fits dilute it.
- Time Frame: Shines brightest on daily or weekly charts after uptrends.
- Combine with Indicators: Use moving averages or RSI to confirm the reversal.
- Breakout Confirmation: A close below B sets the turn - don’t jump at D alone.
- Price Target: Measure the XA leg or use Fibonacci Retracements of CD for targets below the close.
- Risk Management: Set a stop-loss above C or D to limit losses if it fails.
Wait for the Harmony: Acting before confirmation risks a false signal — wait for alignment before entering.
Conclusion
The Bearish Cypher Pattern is a trader’s harmonic tool for catching bearish reversals. Its XABCD dance, paired with volume, RSI, and moving averages, can tune powerful downside moves. Whether in crypto, stocks, or forex, this pattern sharpens your edge. Stay precise, manage your risk, and let the Bearish Cypher align so that Fibonacci structure could turn into a profitable short trade.
Frequently Asked Questions
Quick answers based on this page's topic.
The Cypher is unique because it measures the final D-point relative to the XC leg rather than the XA leg. It requires point C to extend past point A (a 127.2% to 141.4% extension), creating a 'Bull Trap' that lures in breakout buyers before the final reversal at 78.6% of XC.
The B-point must retrace between 38.2% and 61.8% of the XA leg without closing beyond that range. This 'shallow' retracement is essential for the pattern's symmetry, distinguishing it from the deeper retracements seen in Gartley or Butterfly setups.
The most technical stop-loss is placed just above point X. Point X serves as the absolute structural anchor for the pattern; if the market manages to close above this level, the bearish harmonic thesis is invalidated and the prior trend is likely to continue.