Trend-Based Fib Extensions: Setting Price Targets That Hold
Trend-Based Fibonacci Extension is a tool traders use to project potential price targets based on a measured move. It extends Fibonacci levels beyond the current price action, providing possible areas where an asset may reach or reverse. Unlike Fibonacci Retracement, which identifies levels where price might pull back, the Fibonacci extension projects levels in the direction of the prevailing trend.
Trend-based Fibonacci extensions connect the dots between past momentum and future targets.
- Anonymous
How to Use Trend-Based Fibonacci Extension?
To use it, traders typically identify three key points:
Start of the Trend (A)
This is where the initial move begins. It’s the lowest point in an uptrend or the highest point in a downtrend. The trend-based Fibonacci extension is drawn from this point to establish a reference for future price movements.
Uptrend Point A
Point A in uptrend is the lowest point before a sharp upward move, signaling the start of the trend.
Downtrend Point A
Point A in downtrend is the highest point before a steep decline, marking the start of the downward trend.
End of the Trend (B)
This is where the initial trend move ends. For an uptrend, it’s the highest point reached before a pullback occurs. In a downtrend, it’s the lowest point before a retracement starts.
Uptrend Point B
Point B in uptrend is the highest point before the price pulls back, indicating the end of the upward trend.
Downtrend Point B
Point B in downtrend is the lowest point before a retracement begins, signaling the end of the downtrend.
Pullback Point (C)
This is the point where the retracement ends, and the price resumes its original trend direction. For an uptrend, it’s the lowest point after a pullback; for a downtrend, it’s the highest point after a retracement. The distance between Point A and Point B is projected from this point (C) to determine potential extension levels for future price movements.
The tool then projects Fibonacci ratios (e.g., 1.618, 2.618) as potential future price levels. The most common levels used are 61.8%, 100%, 161.8%, and 261.8%, but traders can adjust them to suit their strategies.
Importance of Trend-Based Fibonacci Extension in Trading
The Trend-Based Fibonacci Extension is important because it helps traders project future price targets based on the magnitude of previous price moves. It provides a structured way to identify potential areas of resistance or support in trending markets, improving the precision of trade planning. By using this tool, traders can align their strategies with the market’s momentum, making it easier to set realistic profit targets and manage risk effectively. Its ability to highlight critical price zones aids in better decision-making and enhances confidence in executing trades.
Dynamic Targeting: Use extension levels to set progressive take-profit targets, locking in gains while allowing for trend continuation.
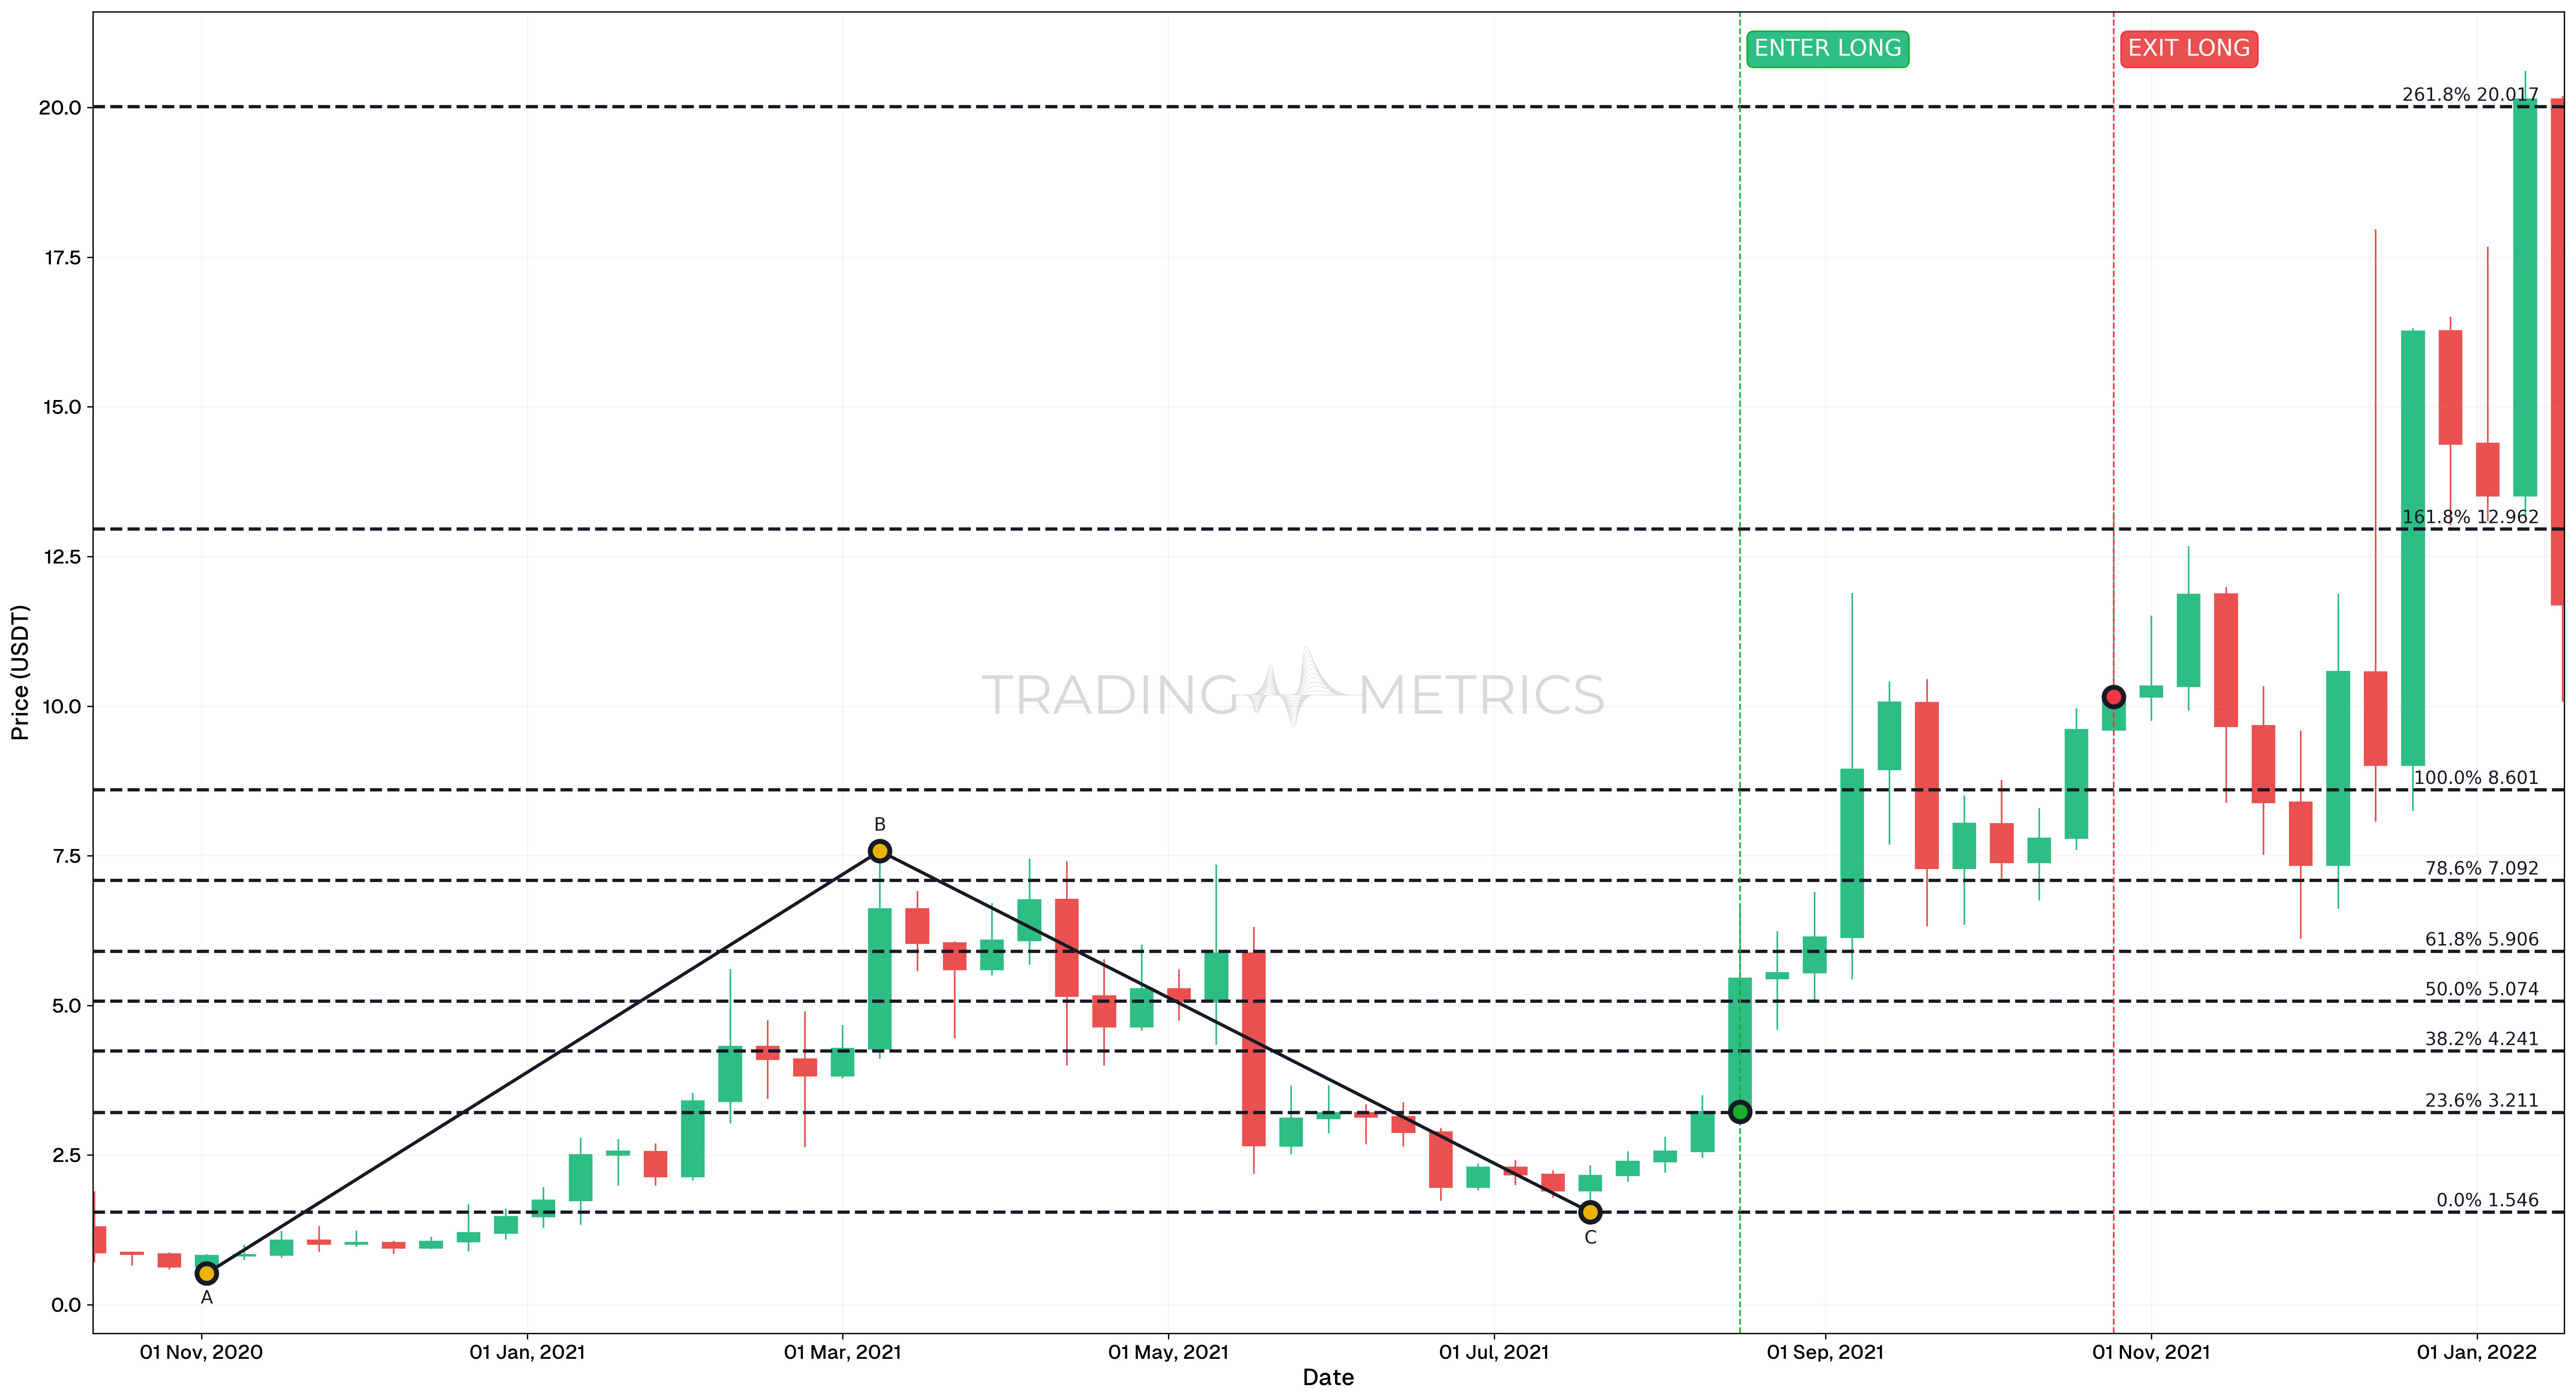
Trend Based Fibonacci Extension in Uptrend
On August 16, 2021, a Bullish Engulfing candle formed, signaling a potential entry for a long position. The bullish momentum was further supported by the RSI crossing above 50 on the weekly timeframe and the price breaking above the 50 EMA. These conditions indicated a strong uptrend, making it an ideal point to enter the market.
Analysis
- The entry signal on August 16, 2021 was supported by a combination of bullish technical patterns and indicators, indicating a strong potential for upward momentum.
- Key confirmations for the trade included a Bullish Engulfing pattern, RSI crossing above 50, and the price moving above the 50 EMA, signaling trend continuation.
Trade Setup
-
Entry: On August 16, 2021, a long position was initiated based on:
- A Bullish Engulfing pattern on the weekly chart, highlighting a reversal or continuation of upward momentum.
- RSI crossing above 50, indicating strong bullish momentum.
- Price breaking above the 50 EMA, confirming a trend continuation to the upside.
-
Exit Targets:
- 100% Fibonacci Level: A conservative exit point, ideal for traders seeking to lock in profits early.
- 161.8% Fibonacci Level: A moderately aggressive target, aligning with expectations of continued trend strength.
- 261.8% Fibonacci Level: The riskiest target, offering the highest potential reward but requiring tolerance for volatility.
-
Outcome: The flexibility in exit points allowed traders to balance their risk and reward preferences. Conservative traders could secure profits early, while aggressive traders aimed for higher Fibonacci extensions, accepting increased volatility.
Risk Management
-
Stop-Loss Placement: The stop-loss for this trade was set at the 0% Fibonacci level (1.546), which corresponded to point C in the ABC corrective structure. This level acted as a key invalidation point; if price broke below this zone, it would indicate a failure of the bullish reversal thesis and invalidate the trade setup.
-
Position sizing: Position size should be calculated based on the distance between the entry price and the stop-loss at 1.546. This ensures the trader’s maximum risk is capped - commonly at 1-2% of total capital - and allows flexibility regardless of account size.
-
Risk-Reward Consideration: This trade used Fibonacci extension levels for scaling out profits. The setup provided:
- A 1:3.2 Risk-Reward Ratio to the 1.0 extension (8.601)
- A 1:5.8 ratio to the 161.8% extension (12.962)
- And a 1:10 potential to the 261.8% extension (20.017)
These tiers allowed traders to lock in profits while maintaining favorable asymmetry.
-
Trailing Stop Strategy: As price advanced toward each Fibonacci extension, traders could trail the stop-loss just below each prior Fibonacci level or below short-term swing lows. This dynamic approach locks in profits and reduces exposure.
-
Volatility Awareness: Given the strong uptrend and wide extension levels, volatility could expand quickly. Monitoring Average True Range (ATR) or volume spikes helped adjust trailing stops or prepare for exit near overextended price moves.
-
Confirmation-Based Entry Reinforcement: Entry was supported by multiple confirmations - Bullish Engulfing, RSI > 50, price above 50 EMA. This multi-factor alignment strengthened the validity of the setup and reduced the likelihood of a false signal, justifying a tighter stop-loss placement.
Conclusion
Combining Candlestick Patterns like the Bullish Engulfing pattern with indicators such as RSI and EMA enhances trade confirmation and reliability.
Fibonacci extension levels provide clear exit strategies, allowing traders to tailor profit-taking to their risk tolerance:
- Conservative: 100% Fibonacci Level.
- Moderate: 161.8% Fibonacci Level.
- Aggressive: 261.8% Fibonacci Level.
A disciplined approach, supported by a combination of technical tools, improves decision-making and trade outcomes.
Avoid Over-Reliance: Use Fibonacci extensions as guidelines, not absolute targets, and confirm signals with other tools like RSI or moving averages.
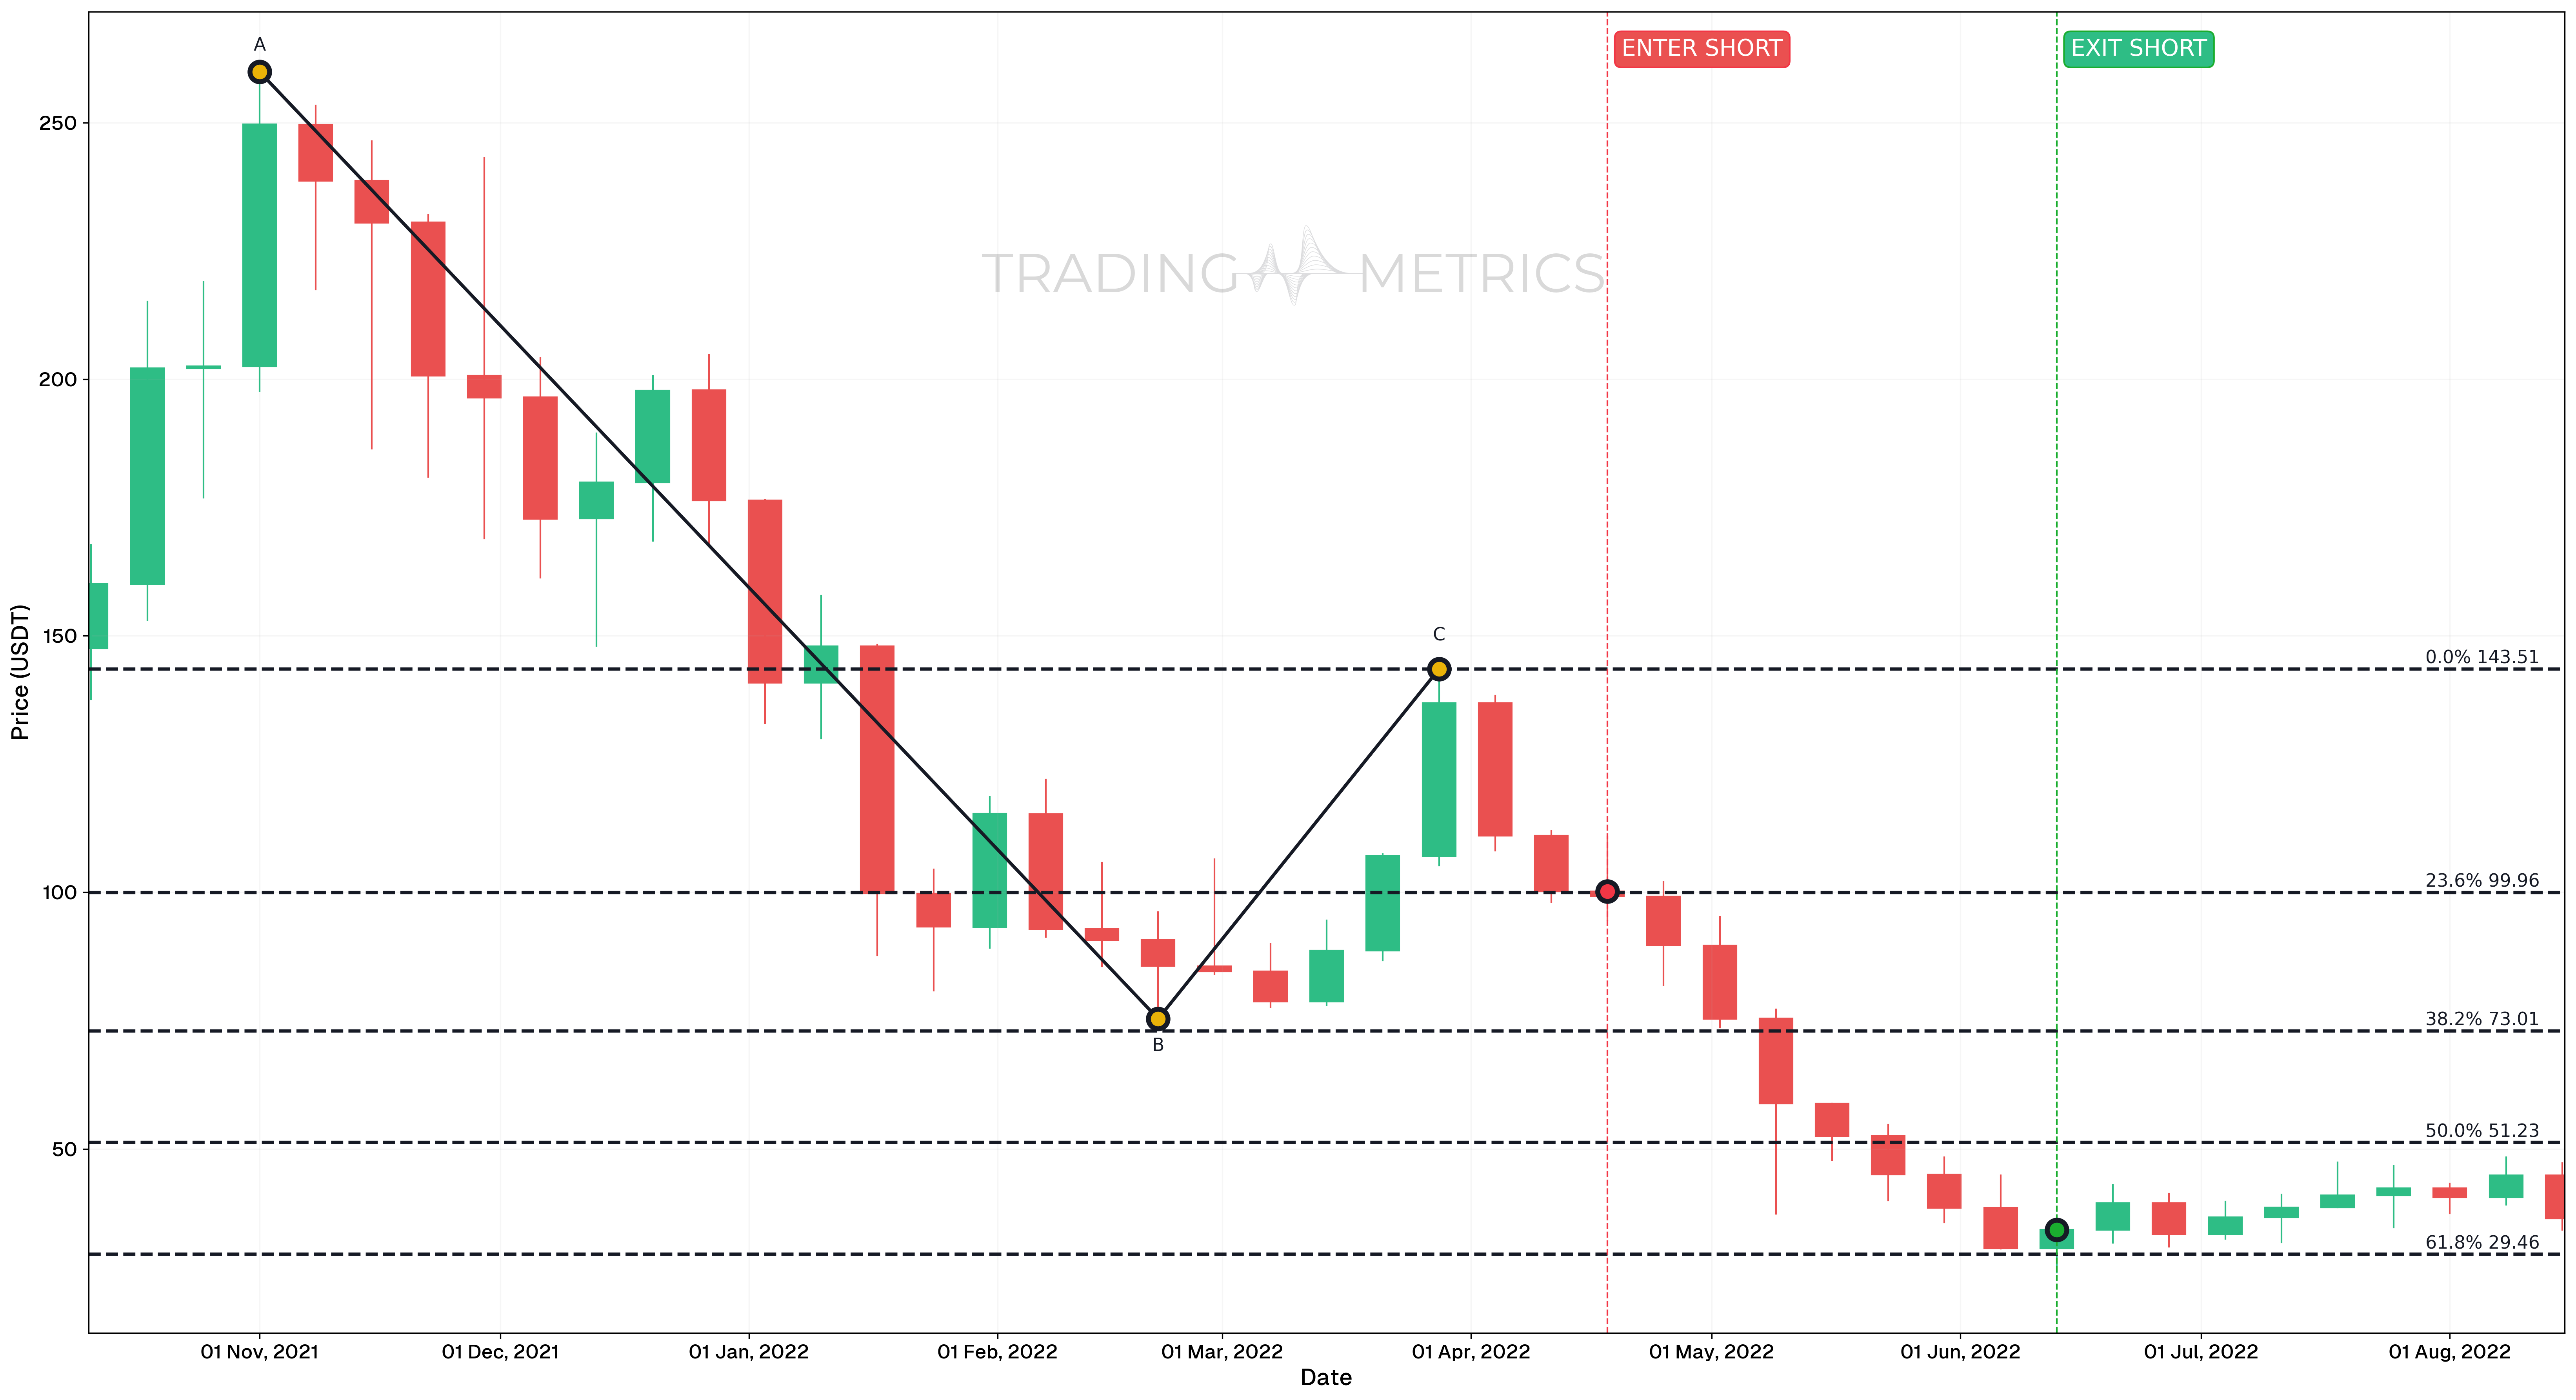
Trend Based Fibonacci Extension in Downtrend
Analysis
- The trade leveraged a bearish engulfing candle on April 18, 2022, signaling a potential trend reversal and strong selling pressure.
- The exit strategy was aligned with the 61.8% Fibonacci Retracement level, a significant support zone, ensuring profits were secured before a potential market reversal.
Trade Setup
-
Entry: On April 18, 2022, a short position was initiated based on:
- A bearish engulfing candle, indicating a strong reversal signal.
- Price closed at $100.15 after opening at $111.06, confirming bearish momentum and significant selling pressure.
- The strategy capitalized on the anticipated continuation of the downtrend following the reversal signal.
-
Exit: The position was closed on June 20, 2022, at the 61.8% Fibonacci Retracement level, with considerations including:
- Price action testing a low of $31.73 before closing at $39.39, signaling potential stabilization or recovery.
- The formation of the first green candle after a continuous downtrend, suggesting a shift in sentiment and a possible bounce.
-
Outcome: The trade captured a substantial portion of the downtrend, exiting at a key support level to secure profits while minimizing risk from a potential reversal.
Risk Management
- Stop-Loss Placement: The stop-loss for this short trade was set at 143.51, which corresponds to the 0% Fibonacci Retracement level (point C). This level was chosen as it marks the recent high before the Bearish Engulfing candle formed, serving as a logical invalidation point for the downtrend. If price moves above this level, it would invalidate the trade setup and suggest a potential trend reversal.
- Position sizing: Risk was limited to 1–2% of the total trading capital, based on the distance between the entry price and the stop-loss level. This ensures consistent exposure across trades and helps preserve capital during losing streaks.
- Risk-Reward Ratio: The trade targeted the 61.8% Fibonacci level (29.46), offering a Risk-Reward Ratio 1:1.52.
- Trend Confirmation and Volume: The trade was supported by a Bearish Engulfing candle, declining volume on retracements, and the structure of lower highs and lower lows. This technical confluence added confidence in the short position’s validity.
- Exit Flexibility: While the 61.8% Fibonacci level was the primary target, traders could trail the stop or exit partially at earlier support zones such as the 50% or 38.2% levels to lock in partial profits and reduce exposure.
- Volatility Consideration: Due to the wide range between entry and stop-loss, volatility was factored into the trade size. A smaller position size was taken to accommodate wider stop placement without breaching account risk limits.
Conclusion
Early signs of market stabilization, such as the formation of a green candle after a prolonged downtrend, can indicate potential reversals, warranting cautious profit-taking.
Combining Trend-Based Fibonacci Extension with Other Tools
The effectiveness of Fibonacci extensions increases when combined with:
- Support and resistance levels: Extensions overlapping with key horizontal levels give stronger confluence, making the level more reliable.
- Moving averages (e.g., 50-day or 200-day): A Fibonacci extension near a moving average might indicate a stronger reversal.
- Relative Strength Index (RSI): If RSI is overbought around a Fibonacci extension level, it might suggest a reversal is due.
- Candlestick patterns: Look for reversal candlestick patterns like Common Doji or Engulfing around extension levels for confirmation.
For instance, if BTC is reaching a 161.8% Fibonacci extension while hitting a significant resistance level and the RSI is overbought, you might anticipate a correction, providing you with a perfect exit strategy.
Volume Validation: Look for increased volume as price approaches extension levels to confirm the likelihood of a breakout or continuation.
Key Points
- Projection of Price Targets: Trend-Based Fibonacci Extension is used to identify potential price targets and continuation levels in the direction of the trend.
- Key Levels: Common extension levels include 61.8%, 100%, 161.8%, 200%, and 261.8%, which act as potential areas for price reaction or trend exhaustion.
- Directional Application: This tool works in both uptrends and downtrends, providing traders with clear levels for profit-taking or breakout strategies.
- Anchor Points: Accurate extensions require three anchor points - starting point (trend origin), the end of the trend, and the retracement point.
- Combines with Retracements: Use Fibonacci extensions in conjunction with Fibonacci Retracement levels to align entry and exit points with market structure.
- Works Across Markets: Effective for any asset class or market condition, from stocks and forex to commodities and cryptocurrencies.
- Confirmation with Other Tools: Combine extensions with indicators like RSI or MACD to validate breakout potential and reduce false signals.
- Dynamic Resistance and Support: Extension levels often act as dynamic resistance in uptrends and dynamic support in downtrends, guiding trade decisions.
- Customizable Time Frames: Suitable for multiple time frames, allowing traders to align short-term trades with longer-term trend projections.
- Backtesting and Strategy Integration: Include Fibonacci extensions in backtesting to refine profit-taking strategies and validate their reliability in historical market conditions.
Conclusion
In both crypto and stock markets, Fibonacci extensions offer a clear, mathematical way to anticipate potential price targets in a trending asset. By understanding its application, combining it with other indicators, and applying it with discipline, traders can make more informed decisions about entry and exit points, ultimately improving their trading outcomes.
Frequently Asked Questions
Quick answers based on this page's topic.
This tool uses three points—a major low, a major high, and a higher low—to project where the next impulsive wave might end. By measuring the initial move and applying it to the retracement, it identifies 'mathematical goals' like the 1.618 level where trends often exhaust.
Often called the Golden Ratio, the 1.618 extension is the most common target for wave 3 or 5 in a trend. Markets frequently experience a pause or a reversal at this level because many institutional algorithms and manual traders use it as a primary take-profit zone.
Accuracy depends on selecting the correct swing high and low points. If you anchor the tool to minor 'noise' instead of significant market pivots, the projected levels will be unreliable. Always ensure your points represent clear shifts in market structure on your chosen timeframe.