Measured Move Up: Projecting Symmetric Bullish Targets
The Measured Move Up pattern is a calculated bullish continuation signal in technical analysis, often spotted during an uptrend. Picture it as a two-leg journey - price surges, consolidates, then surges again by a similar distance - mapping out a predictable climb. When this pattern unfolds, it’s a precise sign that bullish momentum is set to repeat, offering traders a chance to buy or go long as the uptrend stretches higher.
How to Identify the Measured Move Up Pattern in Trading
The Measured Move Up is a bullish continuation formation. It develops in three phases: a sharp rise, a consolidation pause, and a second rise of similar size. The setup confirms when price breaks above the consolidation high. Here’s how to spot it:
Start with the Big Picture
This pattern forms during an uptrend. Buyers drive price higher, then the market pauses briefly before continuing with another leg of equal strength.
Trace the Three Phases
The structure unfolds in a clear three-part sequence. Recognizing each stage confirms the setup.
- First Leg: A sharp upward move establishing the initial thrust.
- Consolidation: A sideways or slight pullback phase, often taking the shape of a rectangle, flag, or triangle.
- Second Leg: A fresh rally projected to mirror the first leg in size, beginning once consolidation breaks.
Zero in on the Breakout Level
The breakout level is the consolidation’s high. Price must close above this level to confirm the second leg is underway.
Watch the Breakout
The bullish trigger comes when price closes above the consolidation high.
- A decisive break over resistance or
- A large bullish candle
Both confirm continuation of the uptrend and provide the entry.
Check Volume for Additional Confirmation
Volume activity strengthens the signal.
- Spikes on the first leg as buyers dominate.
- Declines during consolidation as the market pauses.
- Surges on the breakout, confirming renewed bullish momentum.
Measure the Rise: Measure the height of the first leg (from low to high) and project it upward from the consolidation breakout for a precise price target.
How to Trade the Measured Move Up Pattern (Trading Example)
To demonstrate how the Measured Move Up pattern can be traded, we’ll use the SOLUSDT Perpetual pair on the 3-day chart. This classic pattern unfolded in three phases, providing a highly structured and high-reward continuation opportunity.
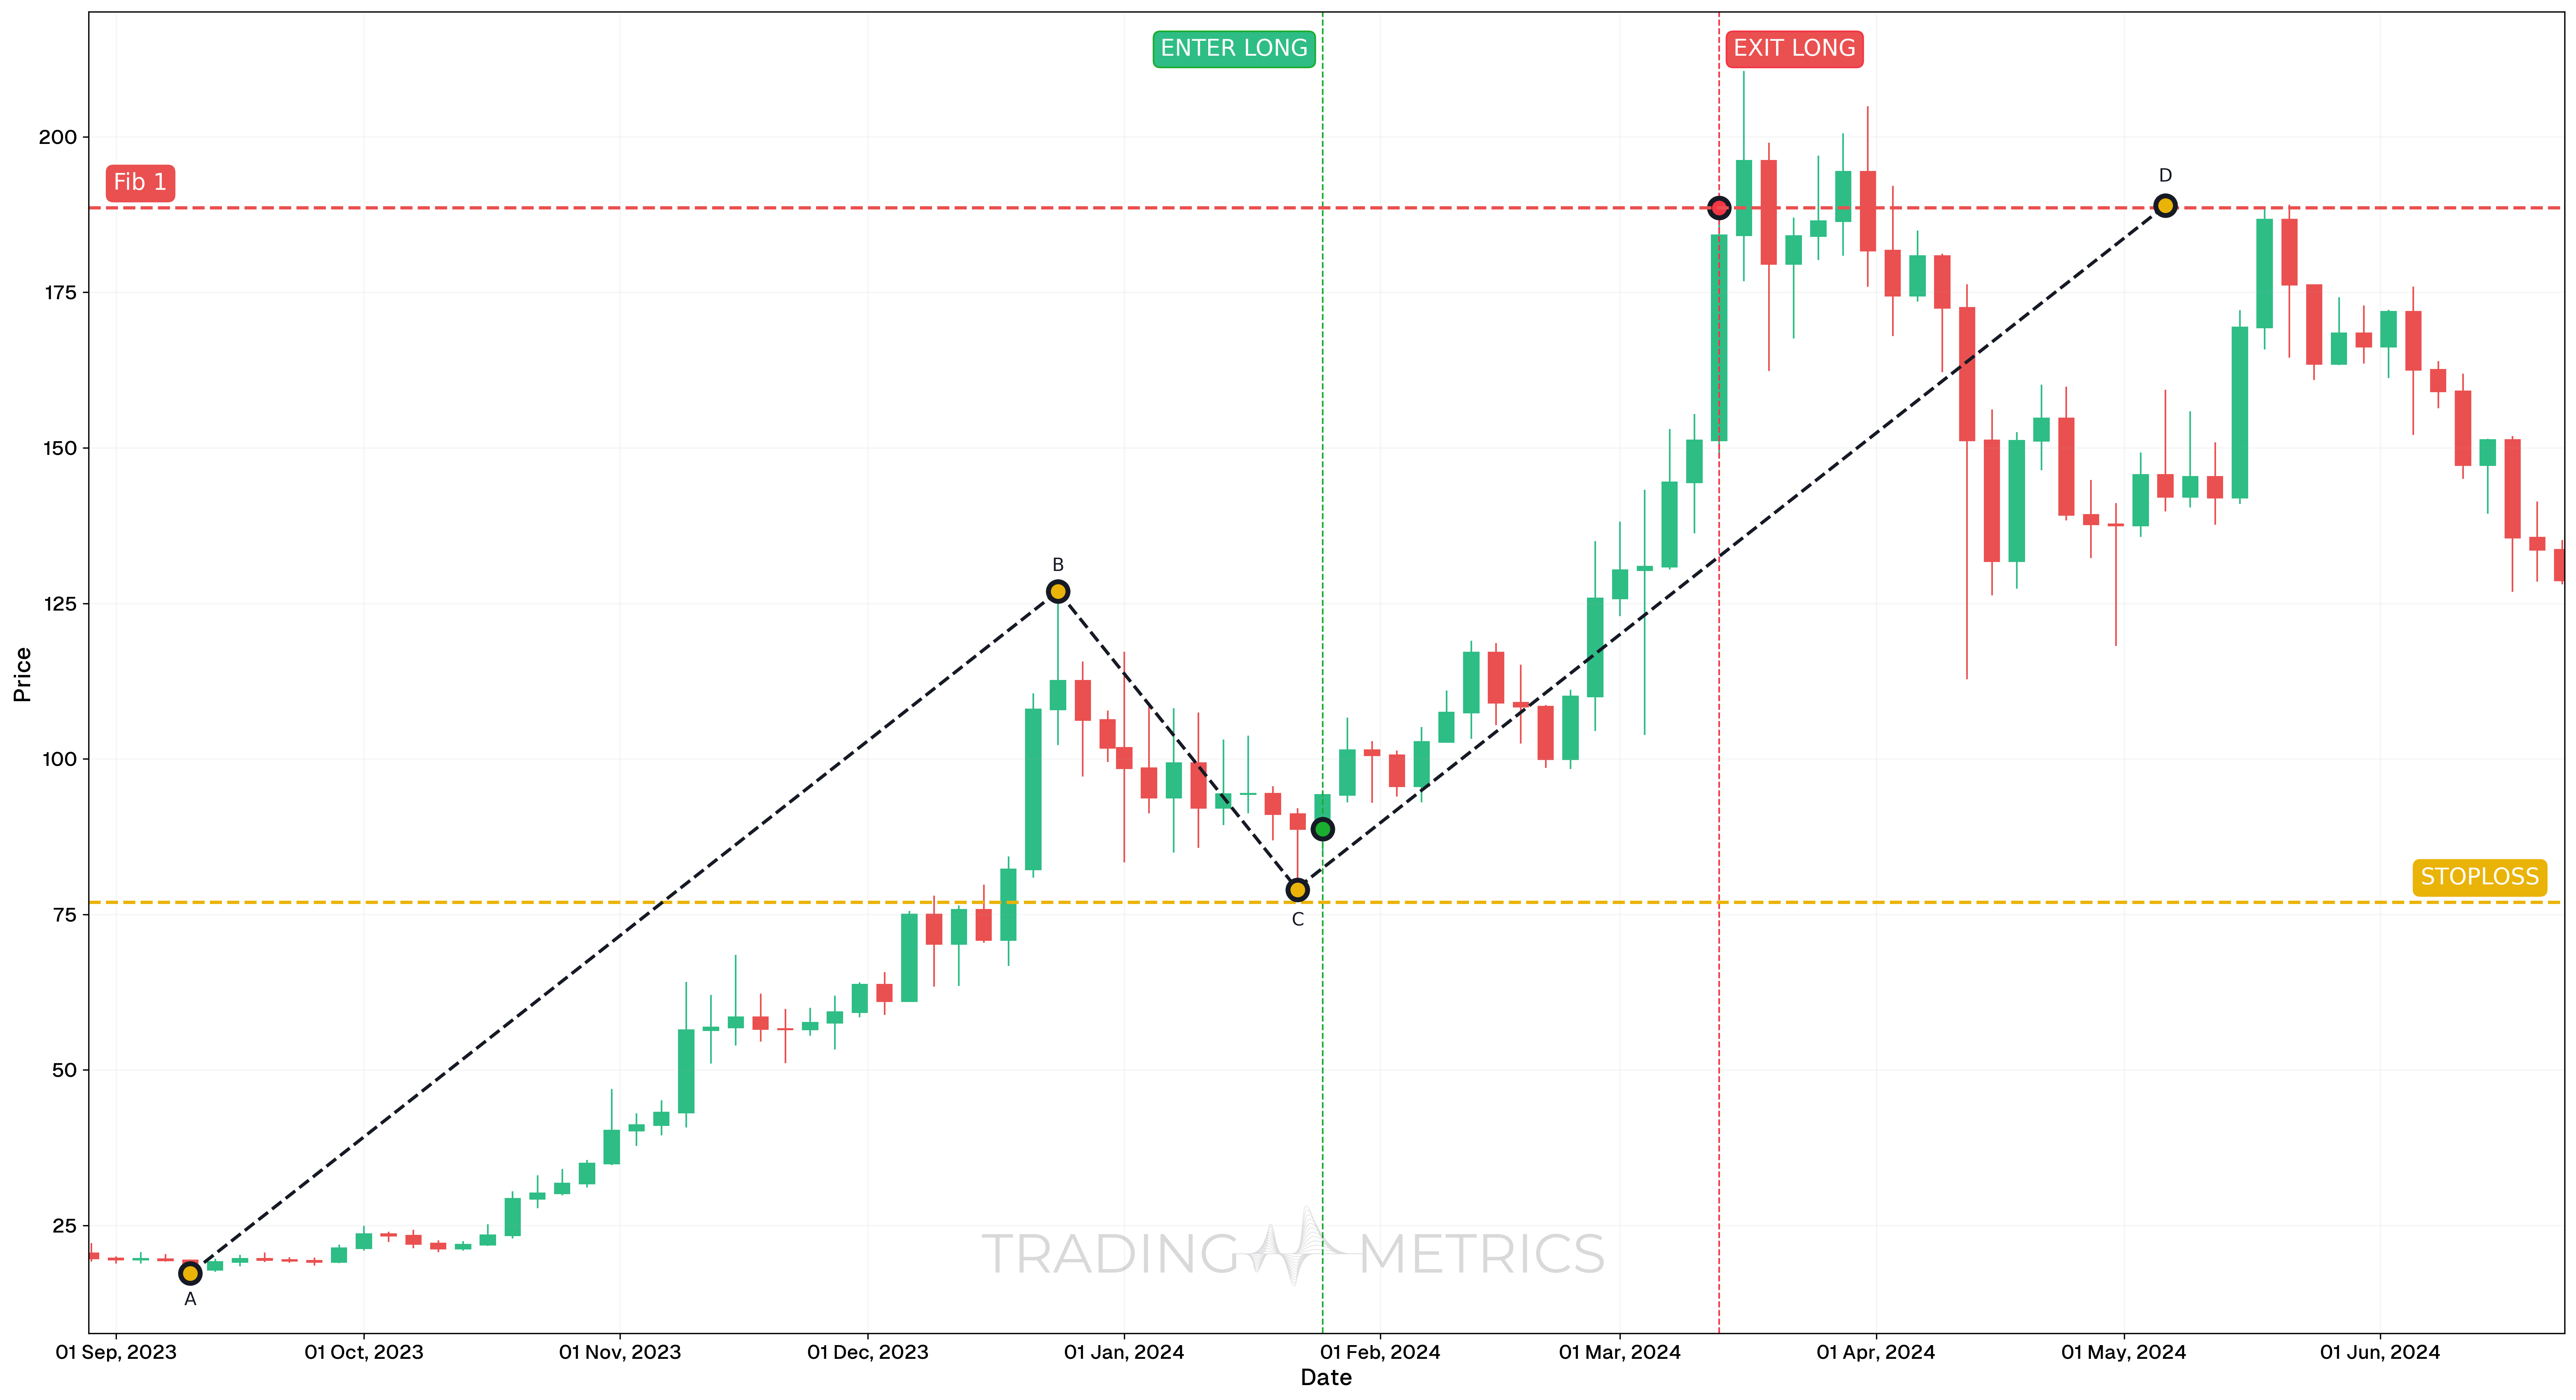
Analysis
Between August 2023 and June 2024, SOLUSDT Perp completed a textbook Measured Move Up. The pattern started with a strong impulsive rally (Wave A to B), followed by a controlled retracement (Wave B to C), and finally a second leg upward (Wave C to D) nearly equal in magnitude to the first.
Trade Setup
-
Entry: The entry was made on January 25, 2024, at $88.75, following the appearance of a Hammer candlestick at the end of the B to C retracement. Entry confirmation included:
- Hammer formation after a healthy correction
- Strong momentum recovery setting up the next impulsive wave
-
Exit: The position was exited on March 13, 2024, at $188.58, after the final leg completed and matched the projected move based on Wave A to B.
-
Outcome: The trade captured a clean continuation rally, validating the Measured Move Up structure. Exit occurred as price fulfilled the expected distance from Wave A to B, projected from Wave C.
Risk Management
- Stop-Loss placement: Stop-loss was placed at $76.97, just below the low of the retracement zone and the Hammer low that marked the potential reversal.
- Risk-Reward Ratio: 1:8.47 is a highly favorable risk-reward setup, as the distance between entry and stop was relatively small compared to the projected move. This structure allowed for large upside while controlling downside tightly.
- Position sizing: Position size was calculated using a 2% capital risk model, based on the difference between entry and stop.
- Volatility Consideration: Volatility contracted during the pullback and expanded sharply during the breakout leg. This shift confirmed continuation behavior.
- Measured Projection Logic: Using the height of the first leg (A to B) projected upward from Point C provided a reliable and objective target zone.
Volume Surge: A volume spike on the breakout lifts the pattern into a bullish climb.
Pre-Trade Checklist
Measure the Proof: Pair the pattern with volume spikes and indicators like RSI to dodge fakes and boost your odds.
Key Points
- Leg Symmetry: The second leg mirroring the first boosts accuracy - mismatched moves dilute it.
- Time Frame: Shines on daily or weekly charts in active uptrends.
- Combine with Indicators: Use moving averages or RSI to confirm the breakout.
- Breakout Confirmation: The break above consolidation high sets the second leg - don’t jump too soon.
- Price Target: Measure the first leg height, project up from the breakout for your target.
- Risk Management: Set a stop-loss below the consolidation low to limit losses if it fails.
Wait for the Break: Acting before the breakout risks a mismeasured trap - let the second leg rise.
Conclusion
The Measured Move Up pattern is a trader’s calculated tool for riding bullish continuations. Its two-leg structure, paired with volume, RSI, and moving averages, can map out big gains. Whether in crypto, stocks, or forex, this pattern sharpens your play. Stay patient, manage your risk, and let the move measure up - that second surge could climb into a winning trade.
Frequently Asked Questions
Quick answers based on this page's topic.
It represents 'Balanced Accumulation.' After an initial surge, early buyers take profits, leading to a brief consolidation. Once supply is absorbed, a second group of buyers enters with similar intensity, often resulting in a second move that mirrors the first in magnitude.
Measure the height of the first leg from its absolute low to its peak. Anchor that measurement at the bottom of the subsequent corrective pullback. The 100% projection identifies the completion point where the bullish momentum is mathematically expected to exhaust.
Absolutely. The Measured Move Up is a staple for swing traders because it provides objective targets and clear risk levels. It allows traders to enter during the pullback phase with a defined expectation of the total move's potential based on historical symmetry.