Trading Runaway Gaps: Riding the Strongest Part of the Trend
The Runaway Continuation Gap is a powerful continuation pattern in technical analysis that can occur in both uptrends and downtrends. It typically appears near the middle of a trend, signaling strong ongoing momentum.
- In a bullish scenario, the price gaps up sharply within an uptrend, showing that buyers are eager to push prices higher and the trend is likely to continue.
- In a bearish scenario, the price gaps down decisively during a downtrend, reflecting strong selling pressure and reinforcing the expectation of further downside.
This pattern highlights an acceleration of momentum, giving traders opportunities to align with the prevailing trend, whether long or short.
How to Identify the Runaway Continuation Gap Pattern in Trading
The Runaway Continuation Gap is a mid-trend gap pattern that signals strong momentum. It appears within an established trend and shows that market participants are pressing harder rather than fading. Here’s the step-by-step guide.
Start with the Big Picture
This pattern forms within an active trend. Instead of stalling, price gaps in the direction of the prevailing move mid-trend, confirming that momentum is accelerating.
- Bullish scenario: price gaps higher during an uptrend.
- Bearish scenario: price gaps lower during a downtrend.
Trace the Gap’s Structure
The pattern has two parts:
- Pre-Gap Phase: A steady trend, often already supported by an earlier breakout.
- Gap: A decisive price gap that signals fresh directional pressure.
- Bullish: the day’s low is above the previous day’s high.
- Bearish: the day’s high is below the previous day’s low.
Zero in on the Confirmation Level
Define the confirmation level by the edge of the gap nearest current price.
- Bullish: the low of the gap acts as potential support. Holding above it shows buyers are defending.
- Bearish: the high of the gap acts as potential resistance. Holding below it shows sellers are defending.
Watch the Continuation
The signal strengthens when price respects the gap and pushes further in trend direction.
- Bullish: remaining above the gap and advancing higher offers a continuation entry, with the gap as a support zone.
- Bearish: remaining below the gap and pushing lower offers a continuation entry, with the gap as a resistance zone.
Unfilled gaps increase confidence in the continuation.
Check Volume for Additional Confirmation
Volume behavior often follows this path:
- Steady during the prior trend as control persists.
- Spikes or holds high on the gap day, validating the surge in demand (bullish) or supply (bearish).
- Strong volume on follow-through candles reinforces the continuation in the respective direction.
Trend Sprint: Measure the distance from the trend’s start to the gap and project it forward in the direction of the breakout.
How to Trade the Bullish Runaway Gap Pattern (Trading Example)
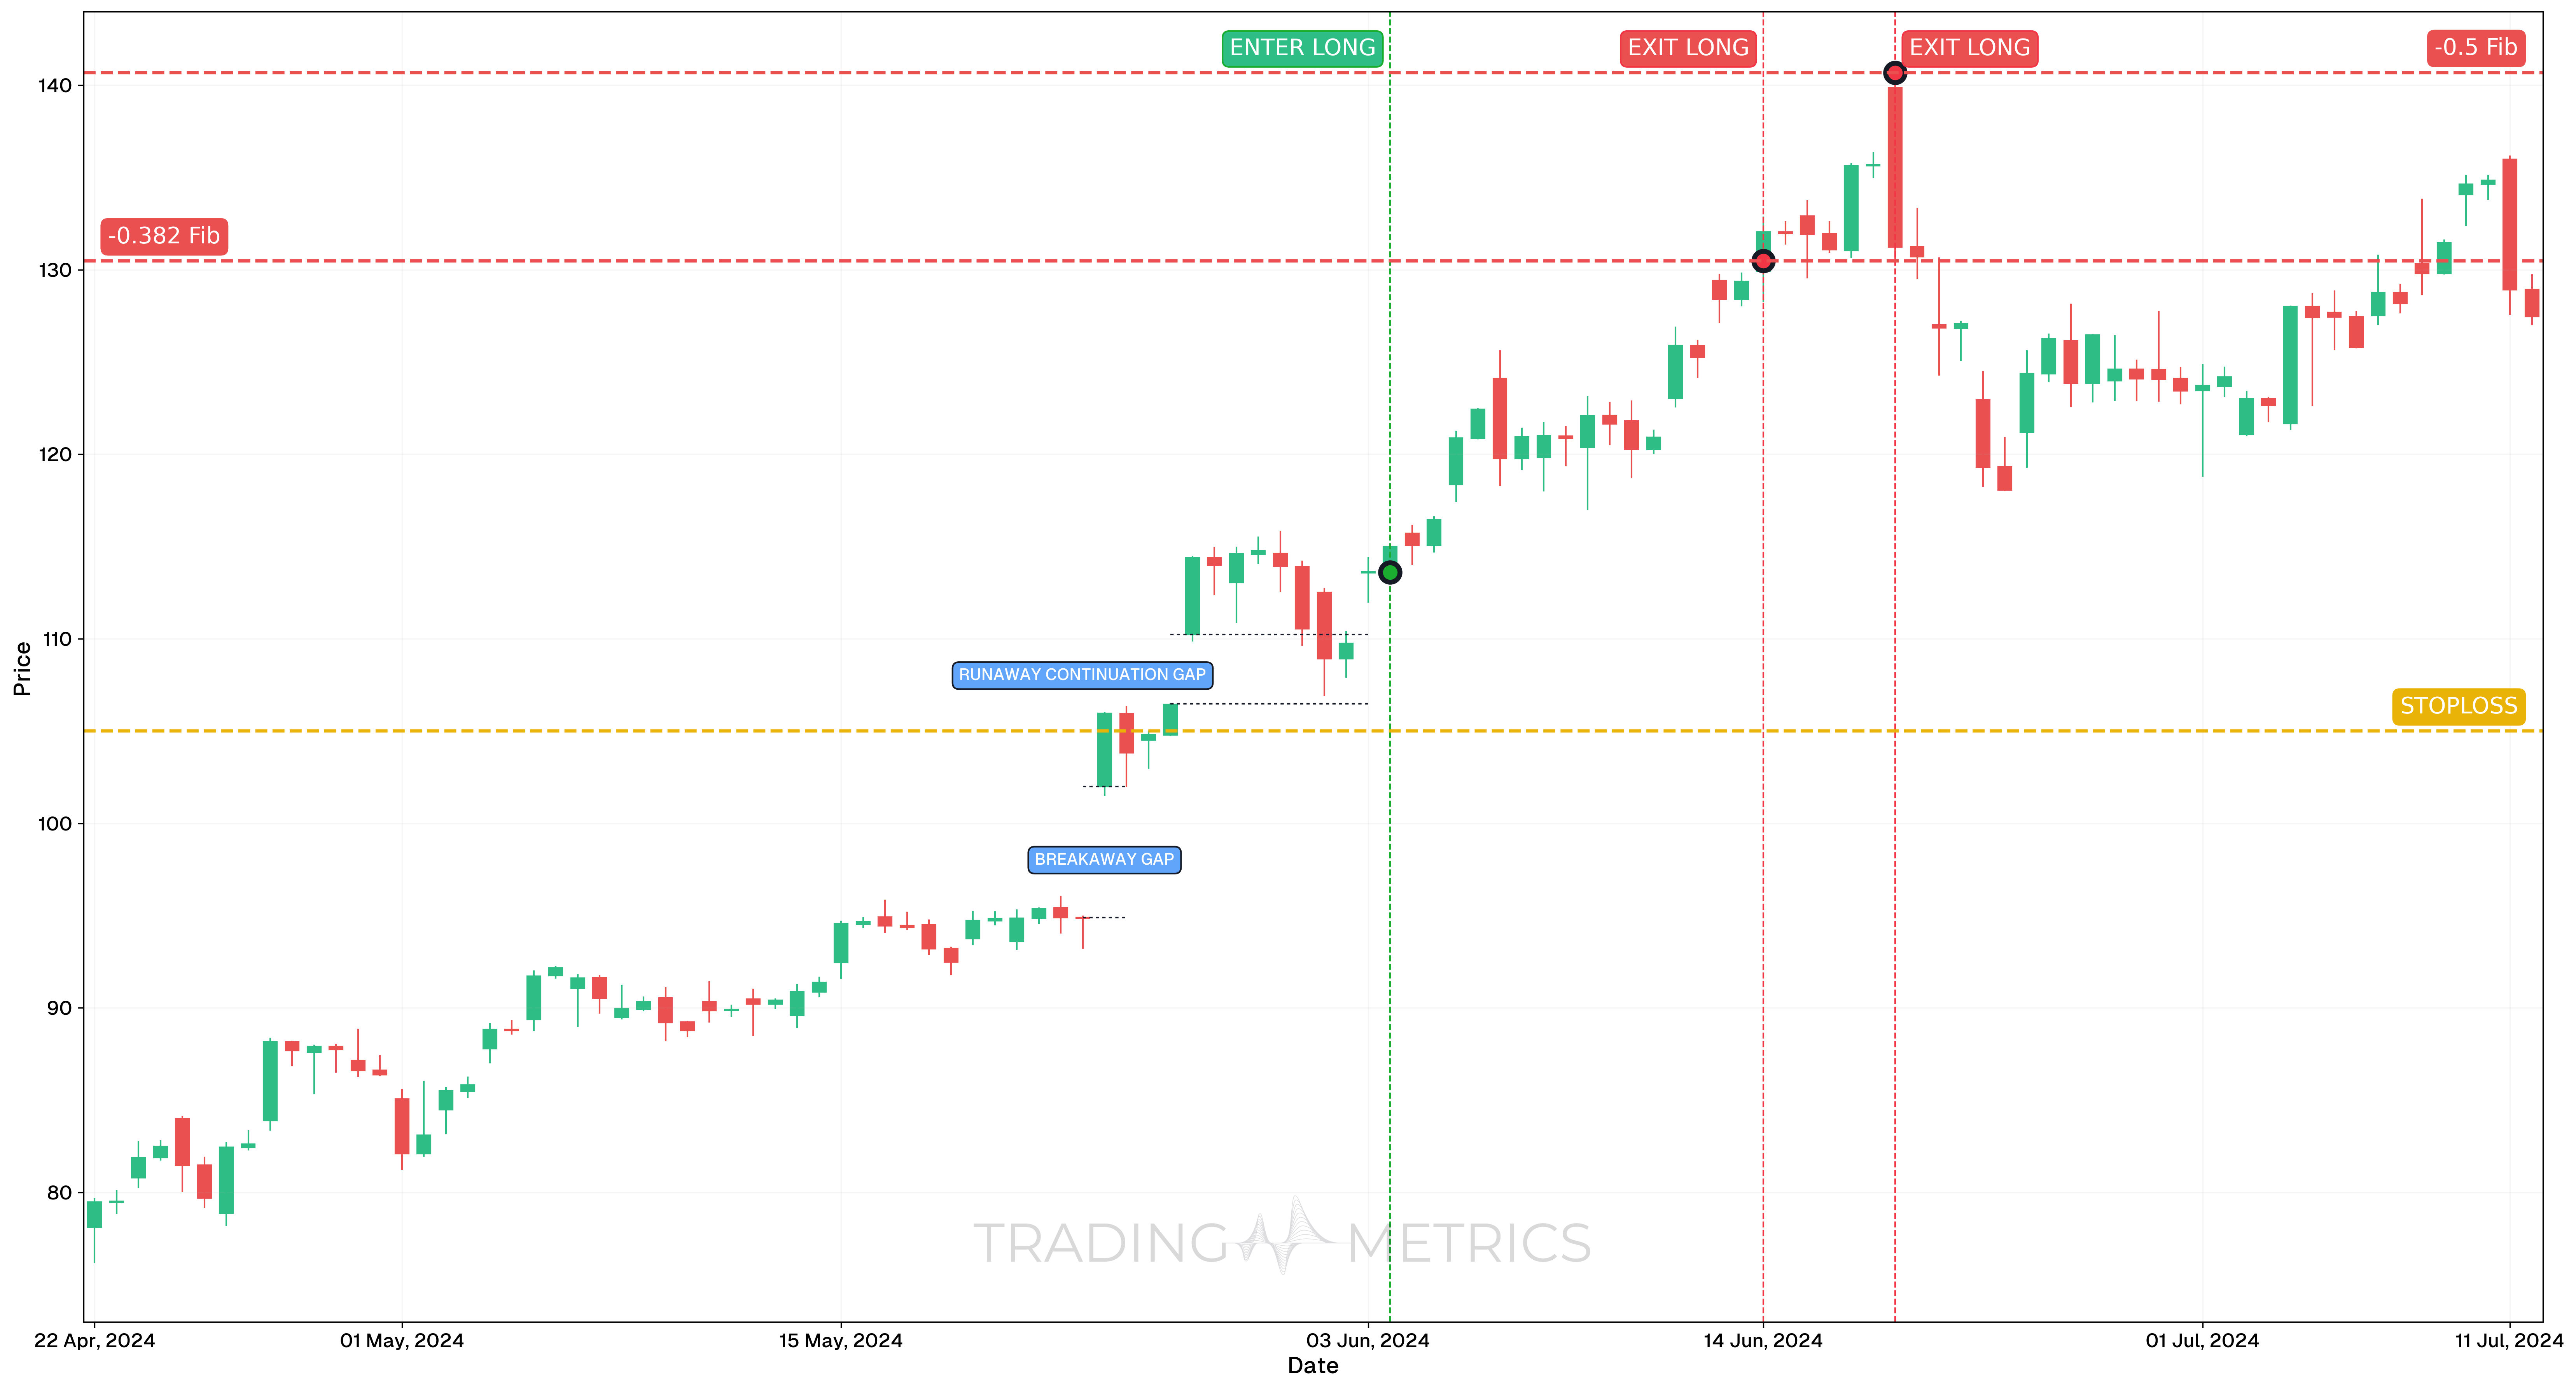
This example showcases a Runaway Gap continuation setup using the 4-hour chart, with higher-timeframe context from the weekly Fibonacci Retracement. The trade builds on a strong uptrend and confirms that the gap will not be filled, allowing for aggressive entries with clear, Fibonacci-based exits.
Analysis
A large runaway gap appeared as price surged above $100, breaking out from consolidation without immediate retracement. This type of gap signals strong continuation, especially when it aligns with volume expansion and momentum confirmation.
The broader move was measured using a weekly Fibonacci Retracement, spanning from $10.81 (October 10, 2022) to $97.40 (March 4, 2024). Using this base, negative Fibonacci mirror levels (-0.382, -0.5) were projected upward to define target zones.
Trade Setup
-
Entry: Entered long on June 3, 2024 at 19:30, at $113.61, once the gap showed signs of holding and was confirmed as a runaway continuation.
- The price did not retrace into the gap, confirming that the market viewed it as a strong impulse.
- Entry was supported by momentum indicators and breakout structure.
-
Exit: The position was exited in two stages at key Fibonacci Negative Mirror Levels:
- June 14, 2024 (TP1): -0.382 extension hit at $130.48.
- June 20, 2024 (TP2): -0.5 extension hit at $140.69.
-
Outcome: The Runaway Gap led to a powerful continuation, with both Fibonacci targets reached. Staggered exits ensured systematic profit capture.
Risk Management
- Stop-Loss Placement: Stop-loss was placed at $105.00, just under the gap zone, where a breakdown would invalidate the setup.
- Risk-Reward Ratio:
- TP1: 1:1.96 – Based on a risk of $8.61 (from $113.61 entry to $105.00 stop-loss), and a reward of $16.87 (to TP1 at $130.48).
- TP2: 1:3.07 – Same risk of $8.61 with an extended reward of $27.08 (to TP2 at $140.69).
- Position Sizing: Trade was sized using a 2% capital risk model, aligned with the $8.61 stop range.
- Volatility Consideration: Volatility had expanded during the gap and stabilized during entry. The trade used this contraction and breakout dynamic to reduce early-entry risk.
- Fibonacci Targeting: Targets were pre-defined using weekly Fibonacci Negative Mirror Levels, offering objective and technically justified exits.
Volume Sprint: A volume spike on the gap day fuels the pattern’s strength.
Pre-Trade Checklist
Sprint the Proof: Pair the pattern with volume surges and indicators like RSI to dodge fakes and boost your odds.
Key Points
- Gap Strength: A significant gap mid-trend boosts reliability - small gaps dilute its signal.
- Time Frame: Most reliable on daily or weekly charts in established trends (up or down).
- Combine with Indicators: Use EMA or RSI to confirm the continuation direction.
- Breakout Confirmation: A gap that holds without filling shows conviction - watch for sustained momentum.
- Price Target: Measure the trend’s prior leg or use the gap height, then project it forward in the trend’s direction (up in bullish, down in bearish).
- Risk Management: Place a stop-loss just inside the gap zone (below the gap’s low in bullish, above the gap’s high in bearish) to limit losses if it fills.
Wait for the Sprint: Acting before post-gap momentum risks a gap-fill trap - let it run away.
Conclusion
The Runaway Continuation Gap pattern is a powerful tool for riding trend continuations. Its mid-trend surge, when paired with volume, RSI, and EMA, can signal strong momentum. Whether in crypto, stocks, or forex, this pattern sharpens your edge. Stay alert, manage your risk, and trade in the direction of the gap — that decisive move could sprint into a winning opportunity, whether upward or downward.
Frequently Asked Questions
Quick answers based on this page's topic.
It is called a Measuring Gap because it frequently appears at the geometric midpoint of a trend leg. By measuring the distance from the initial trend breakout to the gap and projecting that same distance forward, traders can mathematically estimate the final price target for the move.
A Runaway Gap signals intense conviction. It shows that participants are so eager to enter the trend that they are buying or selling at any price, skipping over levels entirely. This 'unfilled' gap acts as a surge of momentum that confirms the trend is in its strongest phase.
Yes. Since Runaway Gaps are continuation signals, they offer high-probability entries for trend-following strategies. Traders often enter on the first minor pause after the gap, using the gap's origin as a dynamic support or resistance level for their stop-loss.