Advanced MACD Trading: Reading Divergence and Signal Crosses
The Moving Average Convergence Divergence (MACD) is a popular momentum and trend-following indicator in technical analysis, created by Gerald Appel in the late 1970s. It’s used to spot changes in the strength, direction, momentum, and duration of a trend in a stock’s price.
MACD crossovers are like market signals - they demand attention but require context.
- Anonymous
How to Use MACD?
The MACD is composed of three components:
- MACD Line: This is the difference between the 12-day and 26-day Exponential Moving Averages (EMA).
- Signal Line: A 9-day EMA of the MACD Line.
- Histogram: The difference between the MACD Line and the Signal Line.
Understand Lag: MACD is a lagging indicator, which means it follows price movements rather than predicting them. Be aware of this lag when interpreting signals.
How to Calculate MACD?
Here is a step by step guide how to Calculate MACD:
Calculate the 12-period EMA
The 12-period EMA is calculated using the following formula:
Where:
- is the current price
- is the EMA value of the previous period.
Calculate the 26-period EMA
The 26-period EMA is calculated using a similar formula:
Calculate the MACD line
The MACD line is the difference between the 12-period EMA and the 26-period EMA:
Calculate the Signal line
The Signal line is the 9-period EMA of the MACD line:
Calculate the MACD Histogram
The MACD Histogram is the difference between the MACD line and the Signal line:
Follow the Trend: Use the MACD line crossing above the signal line as a buy signal in uptrends and below it as a sell signal in downtrends.
Importance of MACD in Trading
The Moving Average Convergence Divergence (MACD) is a important tool in trading because it helps identify trends, momentum, and potential reversal points in price action. By comparing two moving averages of a security’s price, it provides clear signals for buying and selling, enhancing decision-making. Its histogram and signal line crossover allow traders to visualize changes in momentum and potential trend shifts. This versatility makes MACD applicable to various markets and timeframes, making it a important trend indicator in technical analysis.
Combine for Strength: Pair MACD with support/resistance levels or volume indicators to enhance trade accuracy.
Key Signals
Navigating the world of stock trading can sometimes feel like deciphering a secret code. Thankfully, tools like the MACD (Moving Average Convergence Divergence) make it a bit easier. Let’s dive into the key signals that the MACD offers, ensuring you have the insights to make smart trading decisions.
Crossovers: The Market’s Traffic Lights
Think of crossovers as the market’s traffic lights, guiding your buy and sell decisions.
- Bullish Signal: When the MACD Line crosses above the Signal Line, it’s like the market giving you a green light. This crossover suggests it might be a great time to buy because the trend could be moving upwards.
- Bearish Signal: On the flip side, when the MACD Line dips below the Signal Line, it’s a red light. This bearish signal suggests it might be time to sell, as a downward trend could be on the horizon.
Divergence: The Market’s Whisper
Divergence is like the market whispering secrets to those who know how to listen. It occurs when the price of a stock and the MACD are moving in opposite directions.
- Bullish Divergence: If the stock price is falling but the MACD is rising, it might indicate that a price reversal to the upside is on the way. Imagine the stock price and MACD as two dancers; when they move out of sync, it often means one is about to change direction.
- Bearish Divergence: Conversely, if the stock price is rising but the MACD is falling, this can signal a potential downward reversal. It’s like the market is hinting that the upward trend is losing steam.
Zero Line Crossovers: The Market’s Barometer
The zero line on the MACD chart is like a barometer for market trends.
-
Upward Trend Signal: When the MACD crosses above the zero line, it signals an upward trend. This is like the market announcing, “The weather is great, time to sail!” It’s often seen as a strong buy signal.
-
Downward Trend Signal: When the MACD crosses below the zero line, it indicates a downward trend. Think of it as storm clouds gathering – it might be a good time to batten down the hatches and consider selling.
Wait for Confirmation: Avoid acting immediately on MACD crossovers. Confirm the signal with price action or additional indicators.
Fast and Slow MACD
The Moving Average Convergence Divergence (MACD) can be customized to suit different trading styles and strategies. While the standard MACD settings (12, 26, 9) are widely used, adjusting the settings can provide quicker or slower signals, catering to different types of traders.
Standard MACD Settings (12, 26, 9)
The standard MACD settings are as follows:
- 12-Day EMA: Shorter-term exponential moving average.
- 26-Day EMA: Longer-term exponential moving average.
- 9-Day EMA: Signal line, an EMA of the MACD line.
These settings are generally used because they provide a good balance between sensitivity to price changes and the smoothing effect needed to reduce noise. The MACD line represents the difference between the 12-day and 26-day EMA’s, and the signal line is the 9-day EMA of the MACD line.
Faster MACD (e.g., 6, 13, 5)
A faster MACD configuration, such as (6, 13, 5), uses shorter periods for the EMA’s and the signal line. This means:
- 6-Day EMA: Very short-term exponential moving average.
- 13-Day EMA: Short-term exponential moving average.
- 5-Day EMA: Signal line, an EMA of the MACD line.
- Quicker Signals: This configuration is more responsive to recent price changes, providing quicker buy and sell signals.
- Better for Short-Term Trading: Ideal for day traders or swing traders who need to make rapid decisions based on recent price movements.
- Increased Noise: The faster settings can lead to more false signals due to the increased sensitivity to price fluctuations.
- Less Reliable for Long-Term Trends: This setting might not capture the broader trend effectively.
Slower MACD (e.g., 26, 52, 9)
A slower MACD configuration, such as (26, 52, 9), uses longer periods for the EMAs and the signal line. This means:
- 26-Day EMA: Medium-term exponential moving average.
- 52-Day EMA: Longer-term exponential moving average.
- 9-Day EMA: Signal line, an EMA of the MACD line.
- Reduced Noise: Smoother signals with fewer false positives due to the longer periods.
- Better for Long-Term Trading: More suitable for long-term investors who focus on broader market trends.
- Slower Signals: Less responsive to recent price changes, which might result in delayed buy or sell signals.
- Missed Opportunities: In fast-moving markets, slower signals might cause traders to miss optimal entry or exit points.
Adjusting MACD settings can tailor the indicator to different trading styles. Faster settings (e.g., 6, 13, 5) provide quicker signals, suitable for short-term trading but at the cost of increased noise. Slower settings (e.g., 26, 52, 9) offer smoother, more reliable signals, better for long-term investments but with delayed responsiveness. Understanding these configurations helps traders optimize their strategies, ensuring they make informed decisions aligned with their trading goals.
Zero Line Insight: When the MACD crosses the zero line, it often signals a shift in momentum. Above zero favors bulls; below zero favors bears.
Combining MACD with Other Tools
MACD is often used in conjunction with other indicators to confirm signals and enhance the accuracy of predictions:
- Relative Strength Index (RSI): Helps identify overbought or oversold conditions.
- Volume: An increase in volume can confirm the strength of a trend signaled by MACD.
- Support and Resistance Levels: These can be used to determine if the MACD signals align with key price levels.
Watch for Divergence: Divergence between MACD and price can be a powerful indicator of a potential trend change.
Key Points
- Trend and Momentum Indicator: The Moving Average Convergence Divergence (MACD) combines trend-following and momentum analysis to help traders identify potential reversals and trends.
- Crossover Signals: A bullish signal occurs when the MACD line crosses above the signal line. A bearish signal occurs when the MACD line crosses below the signal line.
- Zero Line Relevance: MACD values above the zero line indicate bullish momentum, while values below suggest bearish momentum.
- Divergence Analysis: MACD divergence from price movement can signal potential reversals, with bullish divergence indicating possible upward trends and bearish divergence signaling potential downtrends.
- Works Best in Trends: MACD performs well in trending markets but may give false signals in choppy or range-bound conditions.
- Adjustable Parameters: Traders can customize the MACD’s EMA periods to better suit their trading style or the asset’s volatility.
- Use with Other Indicators: Combine MACD with tools like RSI or support and resistance levels for more robust trading decisions.
- Lagging Nature: As a lagging indicator, MACD is most effective for confirming trends rather than predicting market moves.
- Backtesting and Fine-Tuning: Include MACD in backtesting to validate its effectiveness in various market environments and adjust parameters as needed.
MACD Consists of these key components:
- MACD Line: The difference between the 12-period EMA and 26-period EMA.
- Signal Line: A 9-period EMA of the MACD line, used to generate buy or sell signals.
- Histogram: Represents the difference between the MACD line and the signal line, indicating the strength of momentum.
Conclusion
The MACD is a versatile and widely used indicator in technical analysis. While it provides valuable insights into the momentum and direction of price trends, it should always be used in conjunction with other tools and market analysis techniques. By understanding its signals and combining them with other indicators, traders can make more informed decisions and improve their chances of success in the markets. While MACD is a powerful tool, it should not be used in isolation. It works best when combined with other indicators and a clear understanding of the overall market conditions. The signals provided by MACD can sometimes be false or delayed, so using it as part of a broader trading strategy is advisable.
Frequently Asked Questions
Quick answers based on this page's topic.
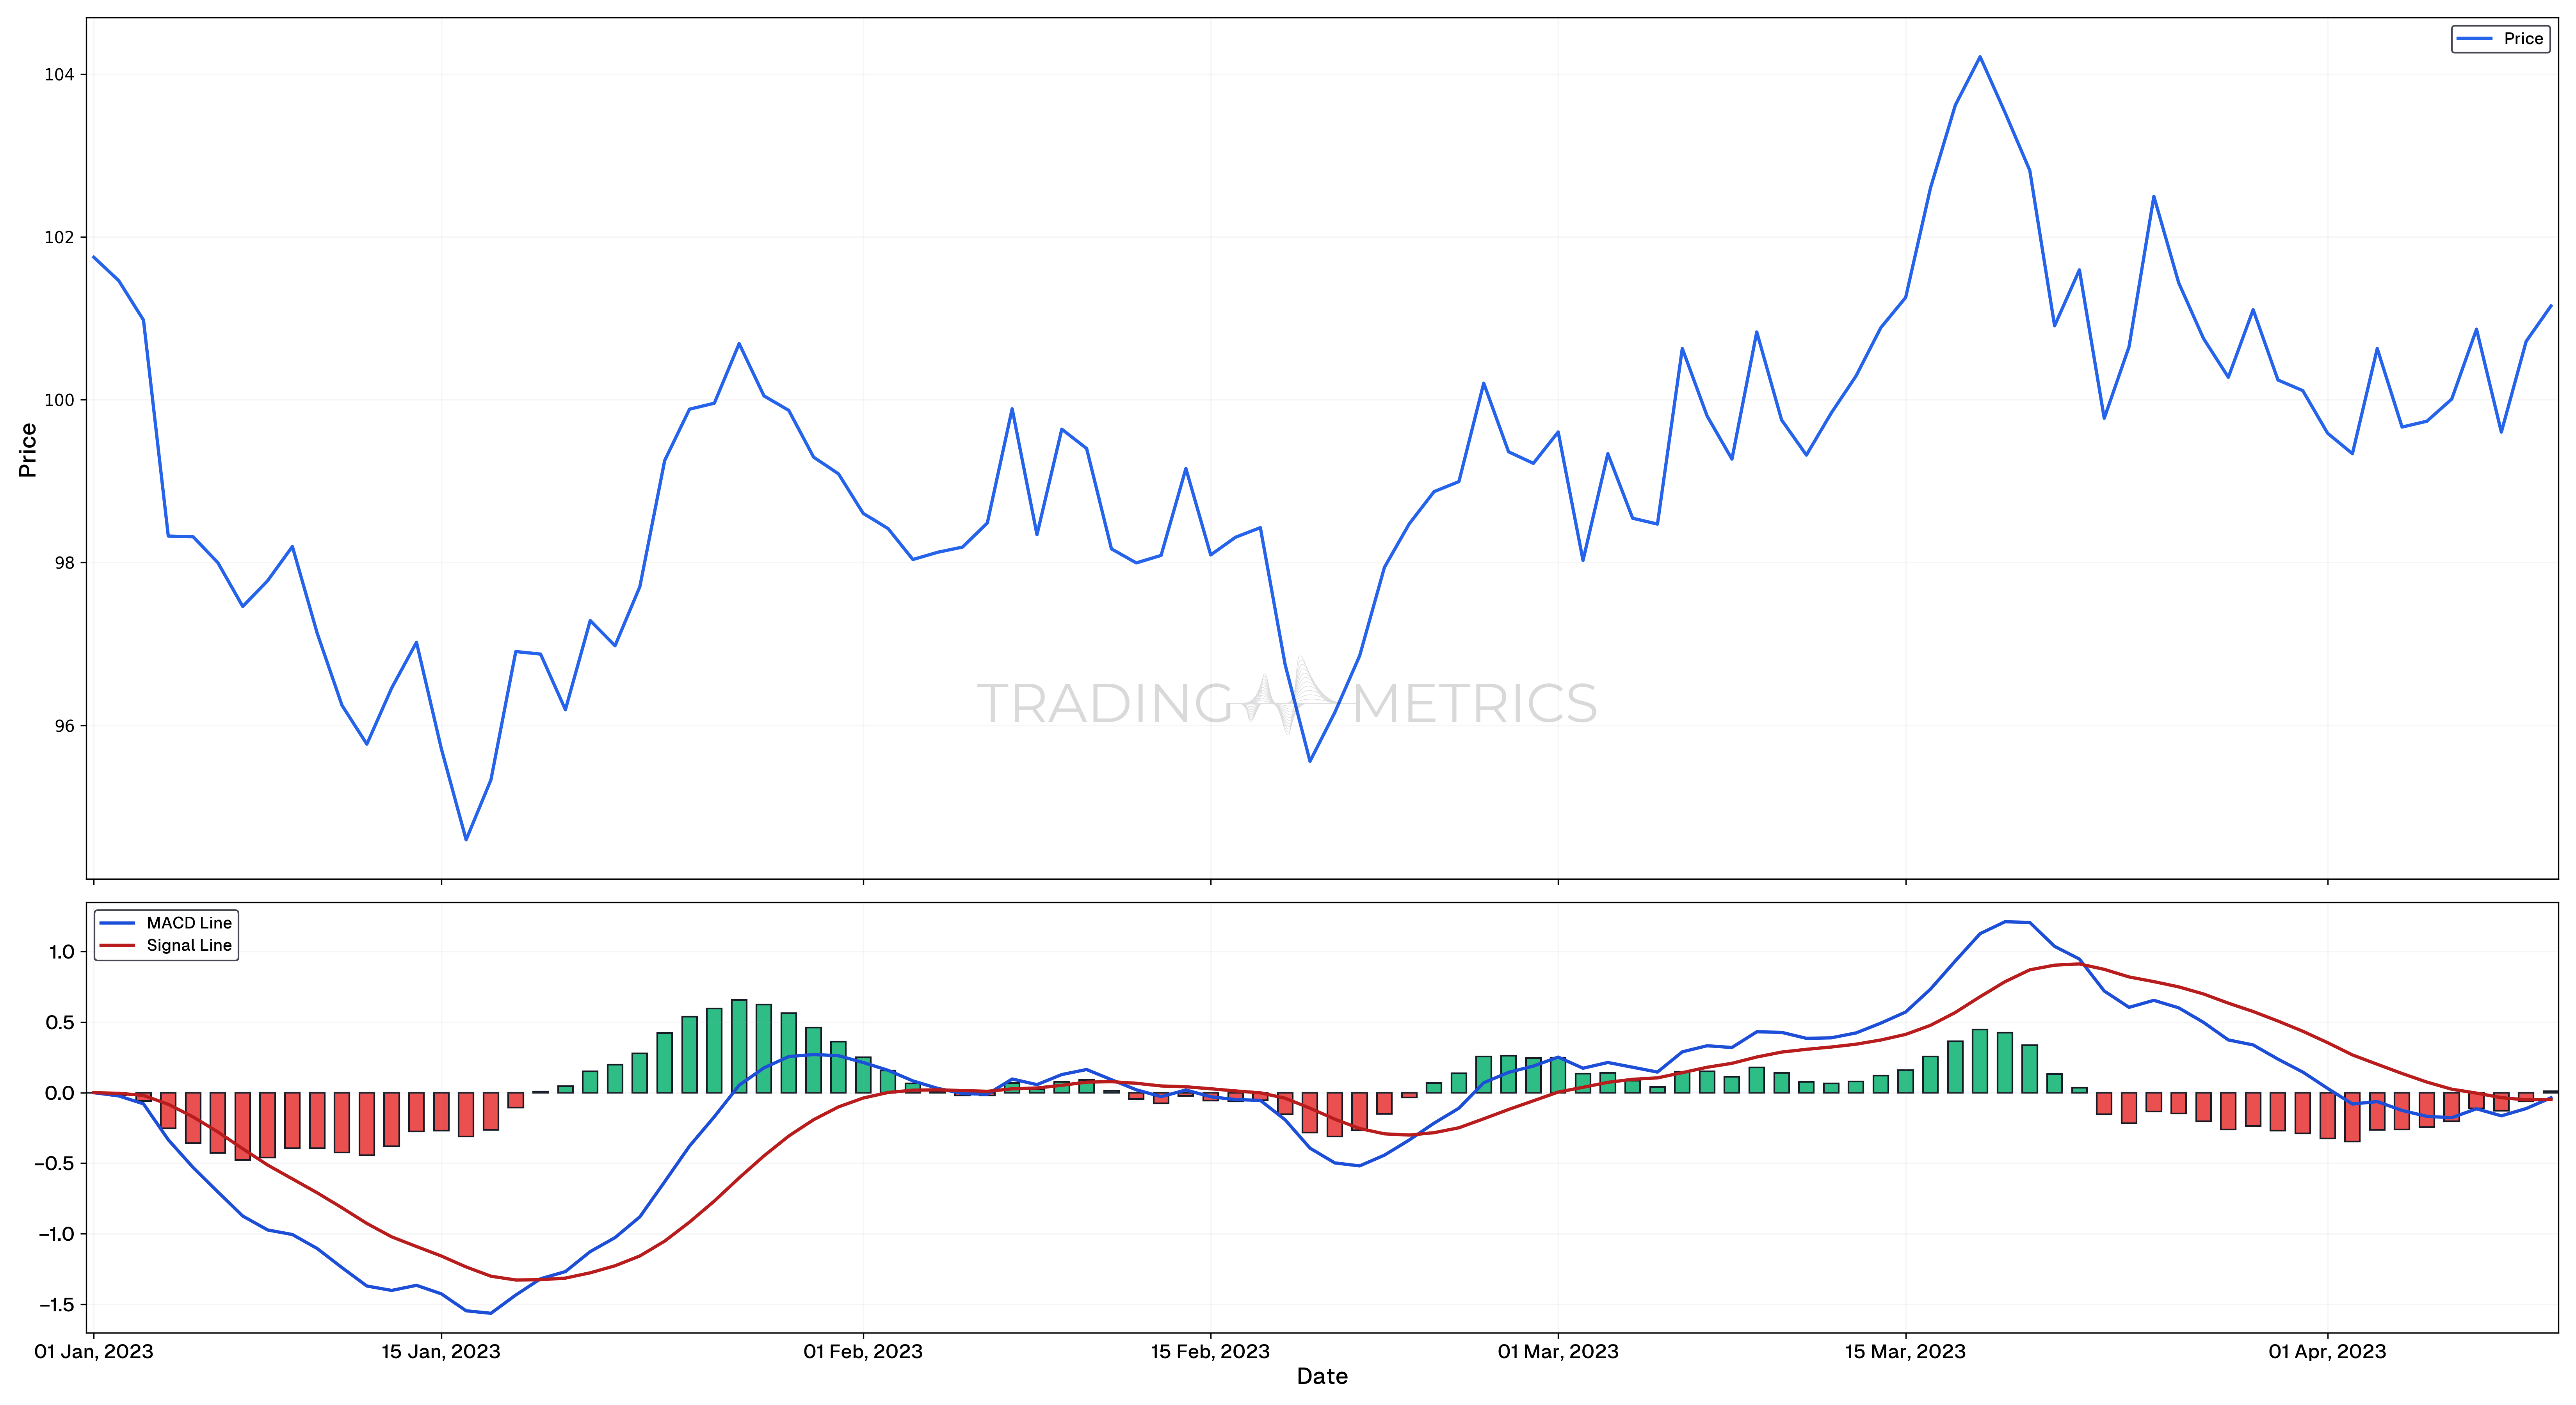
The histogram measures the distance between the MACD line and the Signal line. When the bars are growing above the zero line, bullish momentum is accelerating; when they begin to shrink, it suggests the current upward move is losing steam and a reversal may be near.
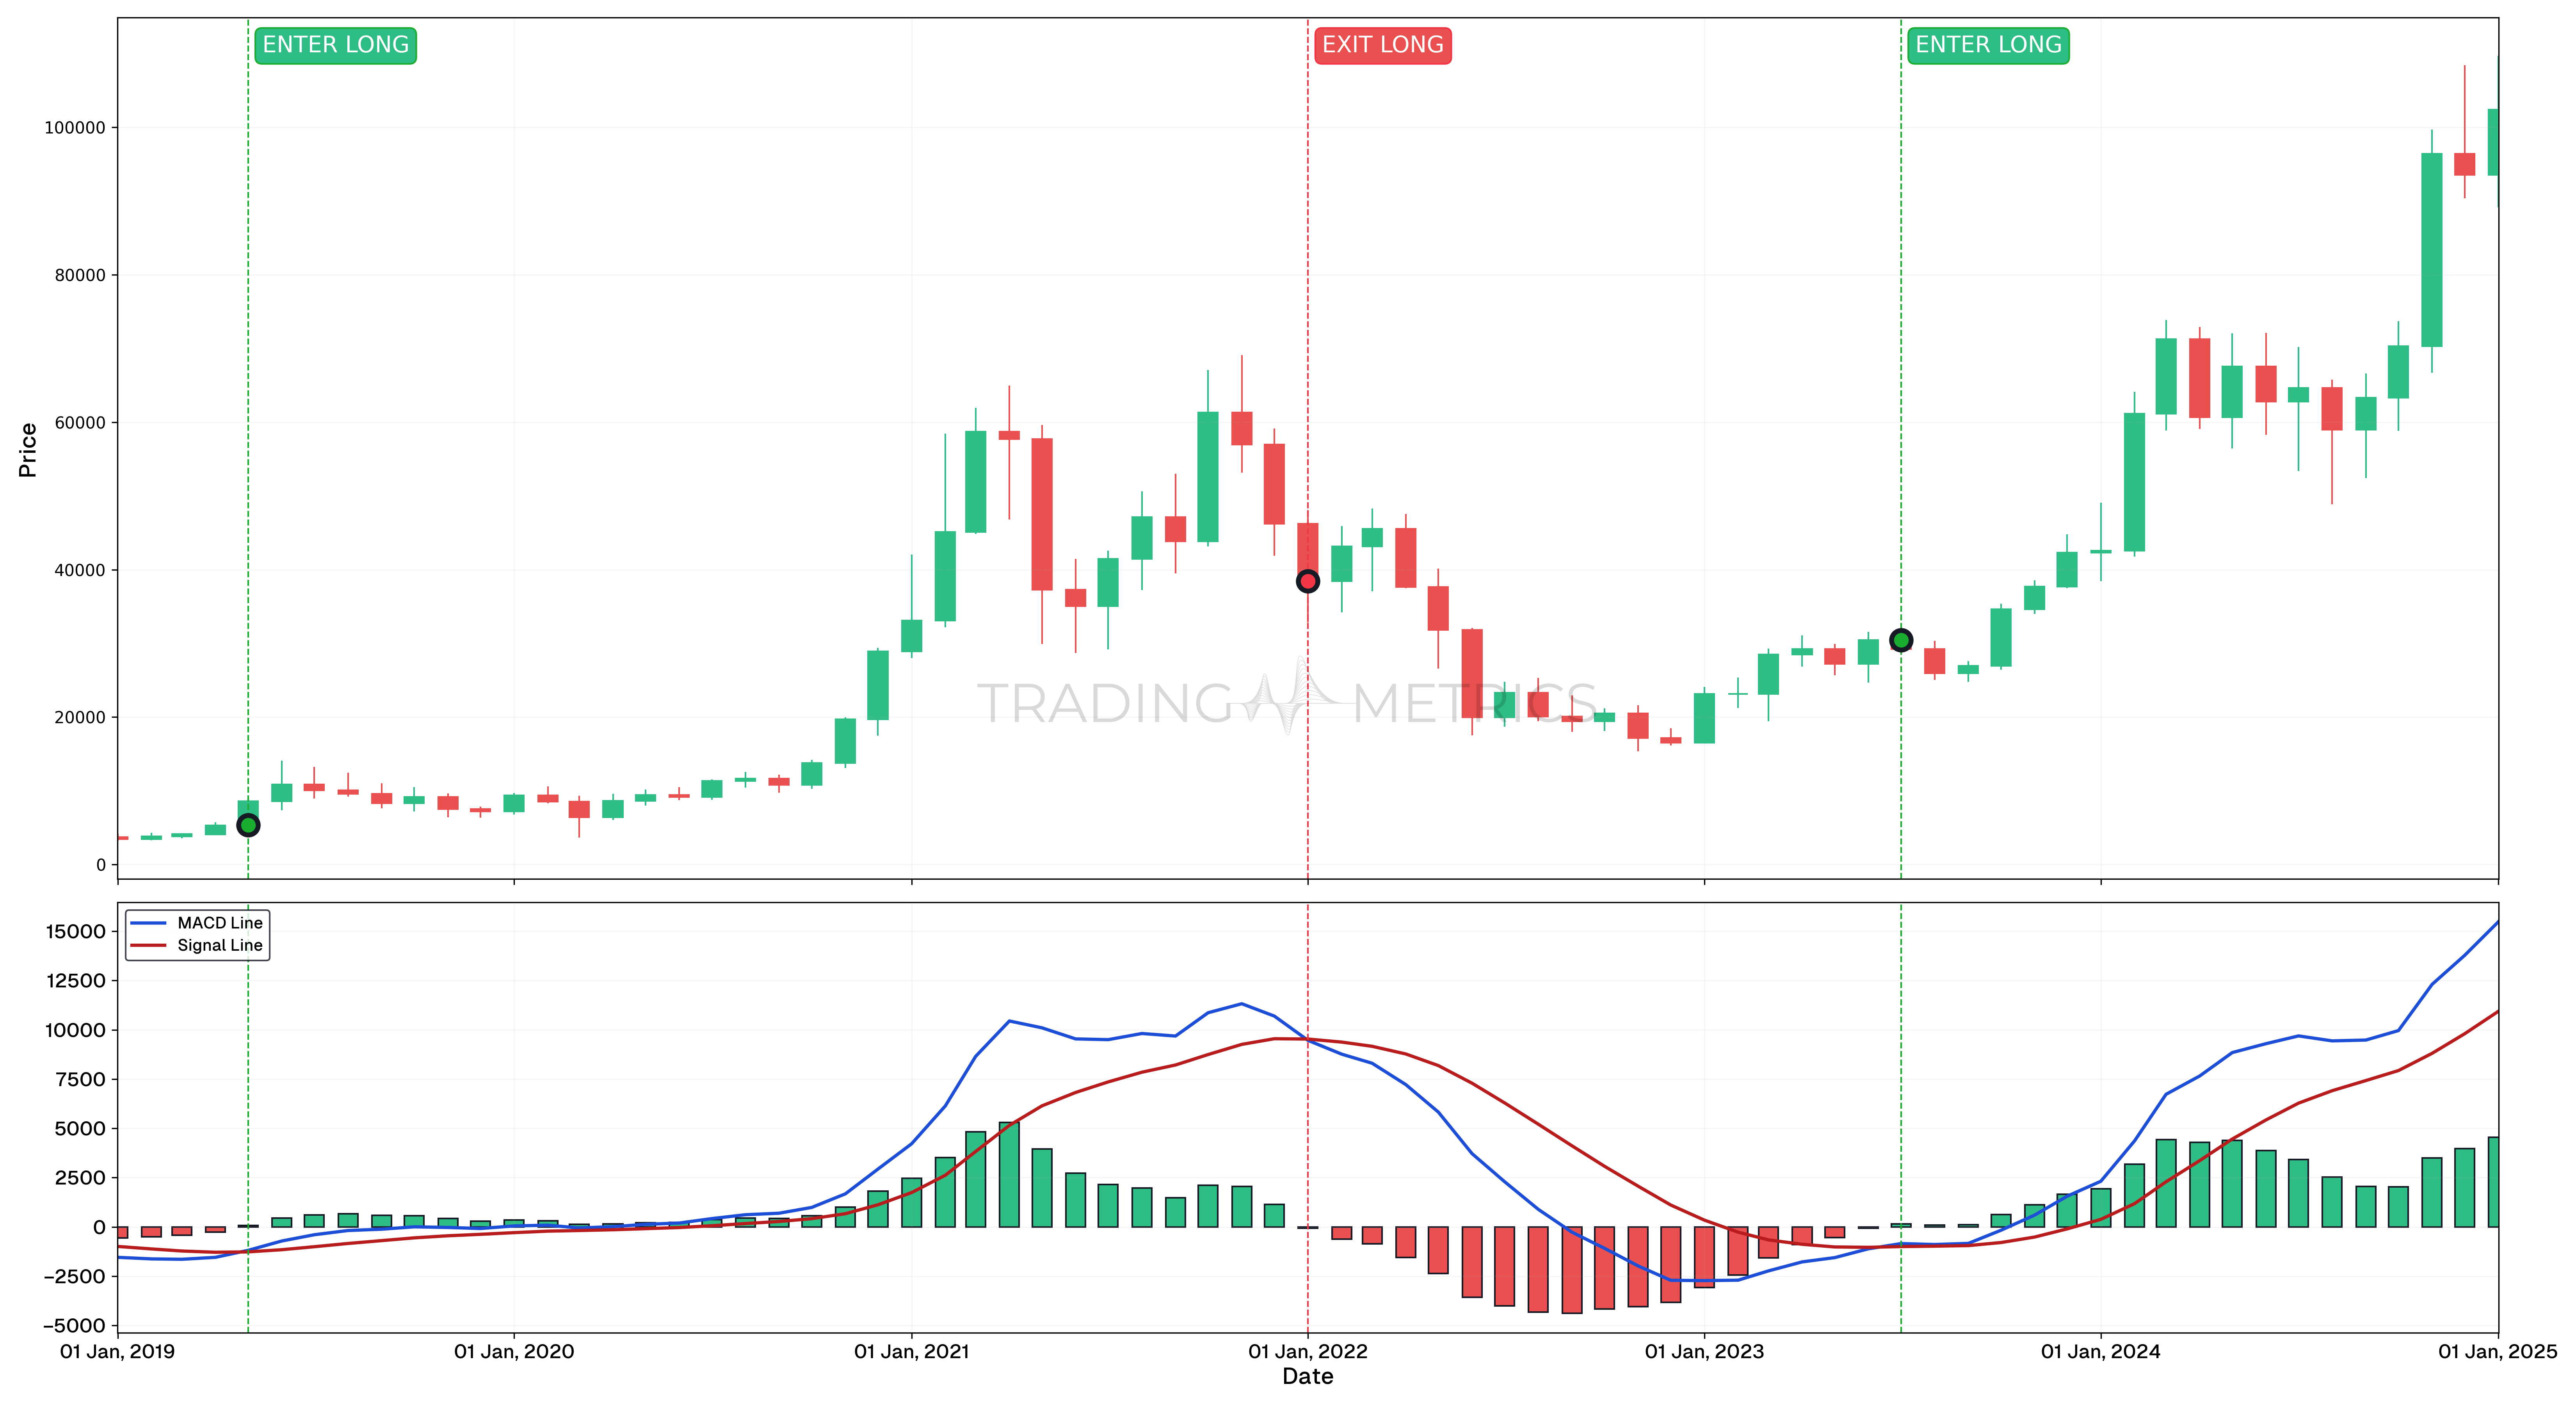
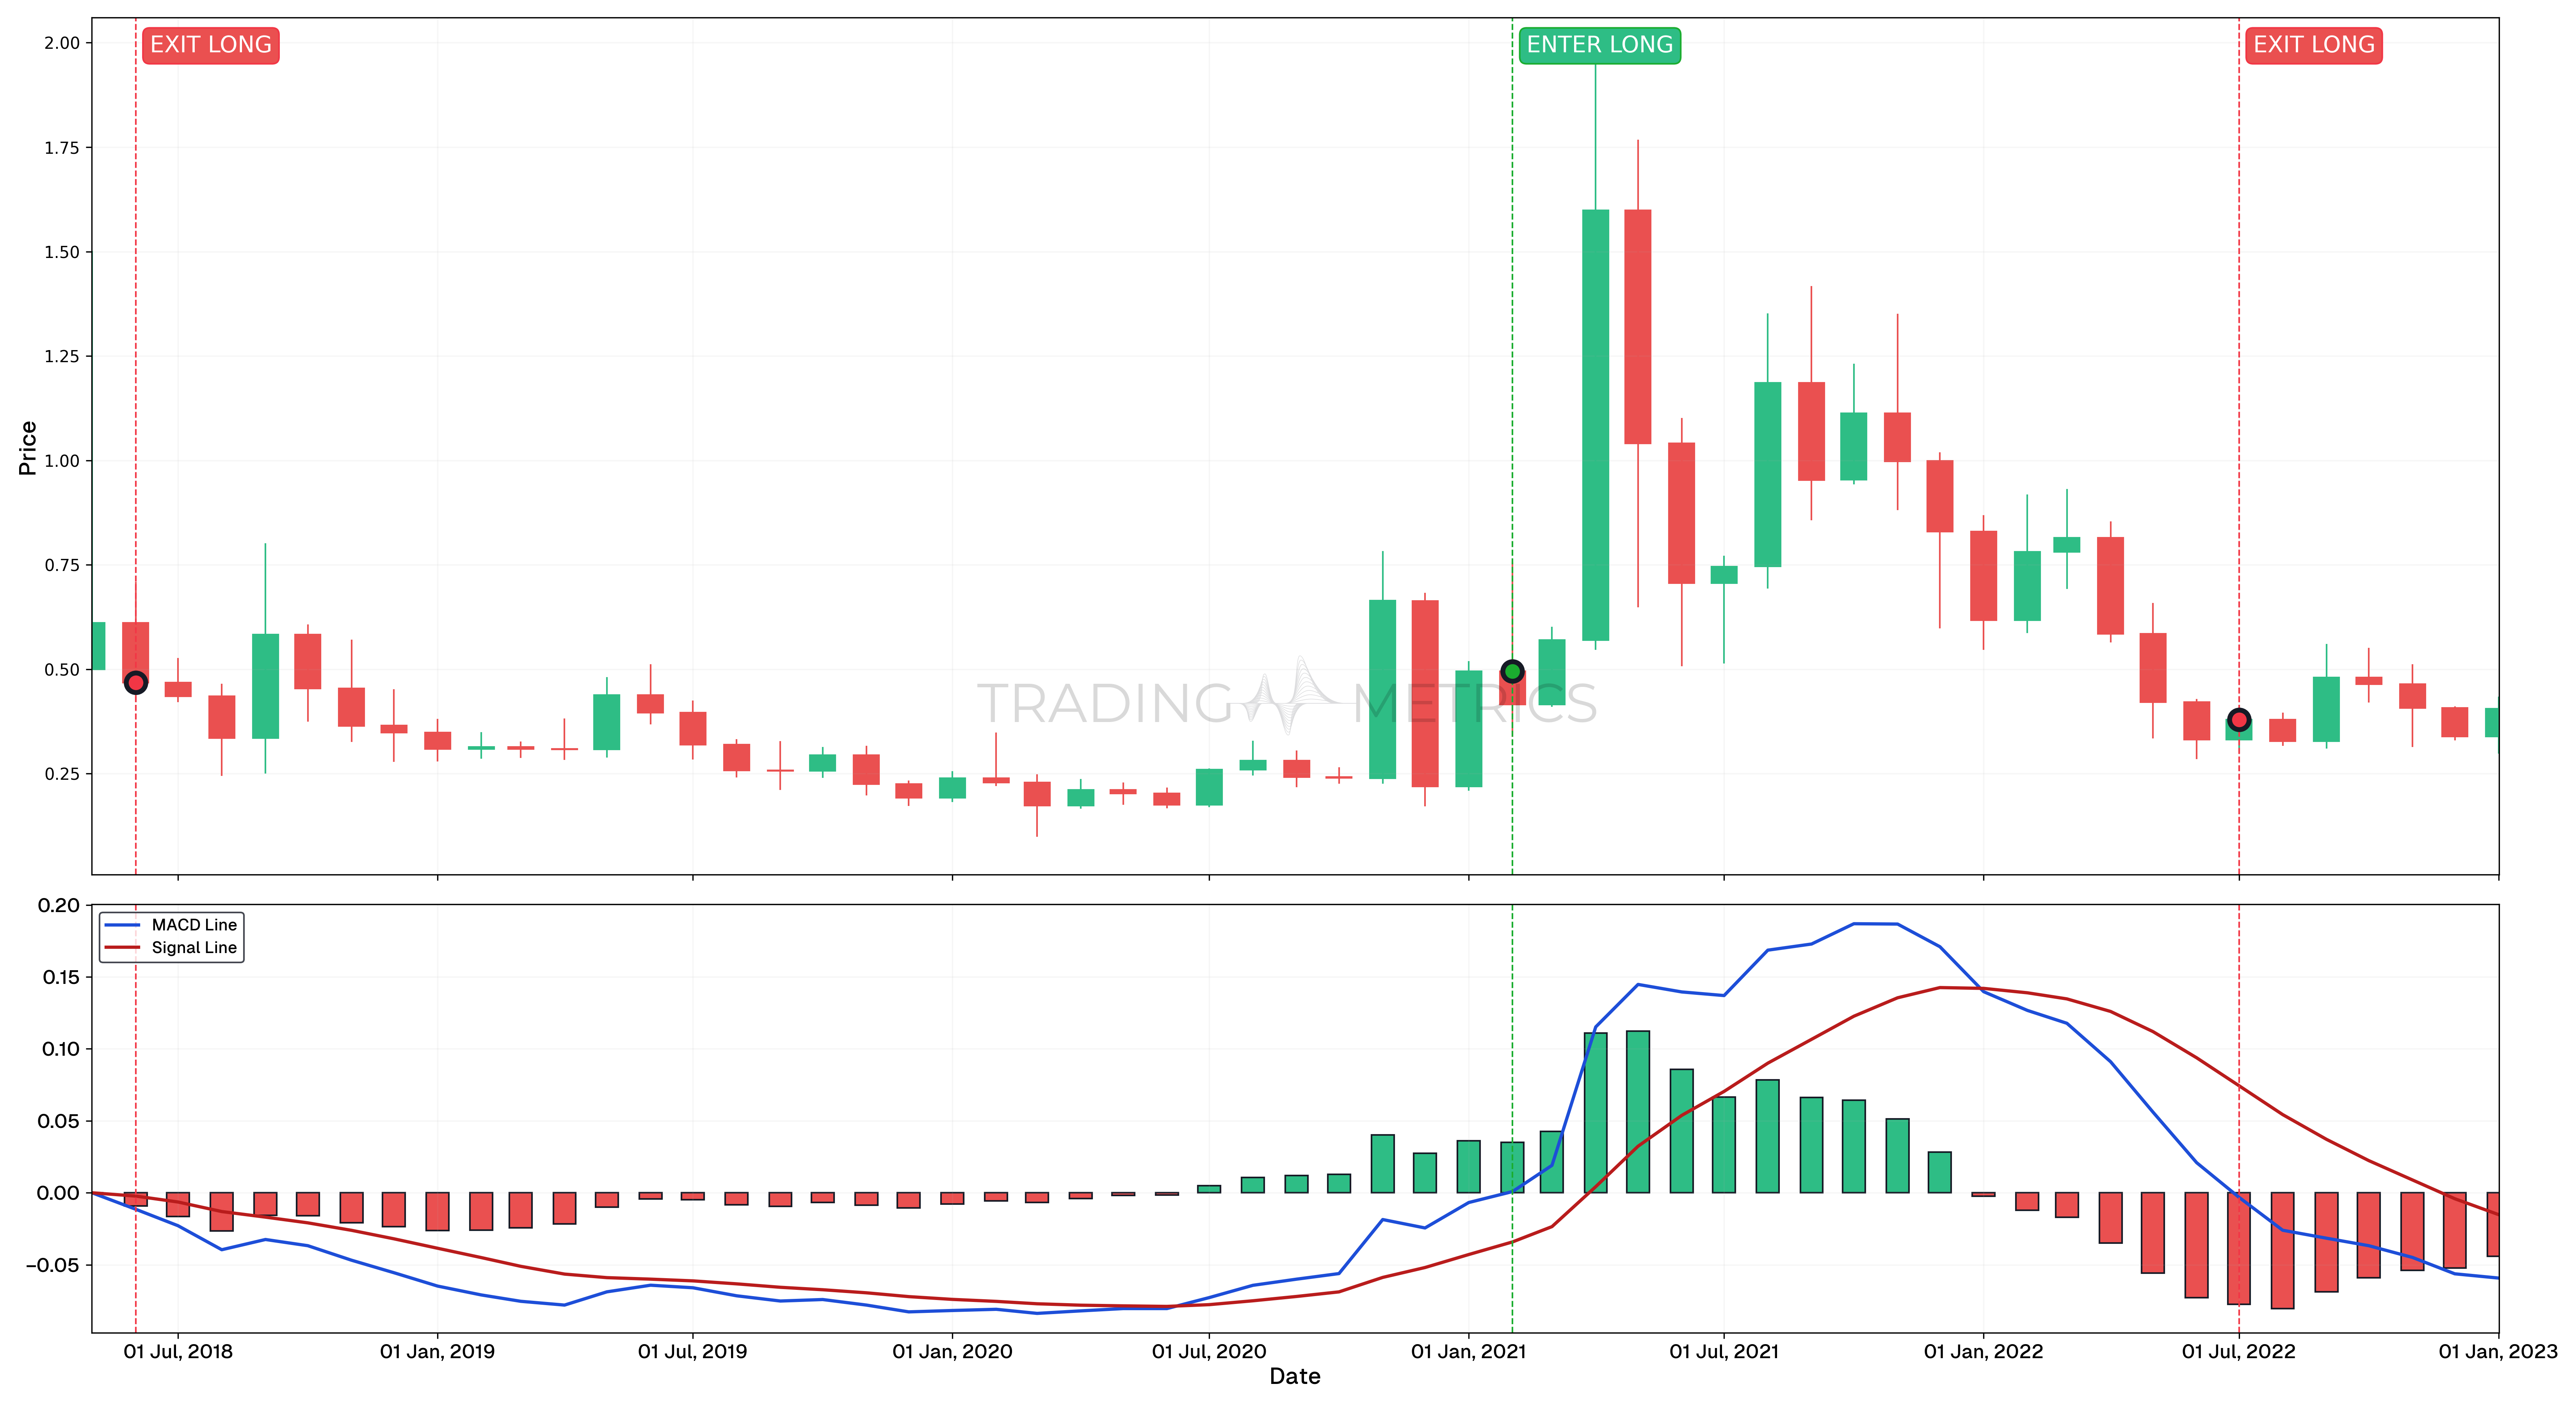
A bullish crossover occurs when the MACD line moves above the Signal line, indicating a potential buy opportunity. A bearish crossover happens when the MACD line falls below the Signal line, suggesting increasing selling pressure and a potential exit or short entry.
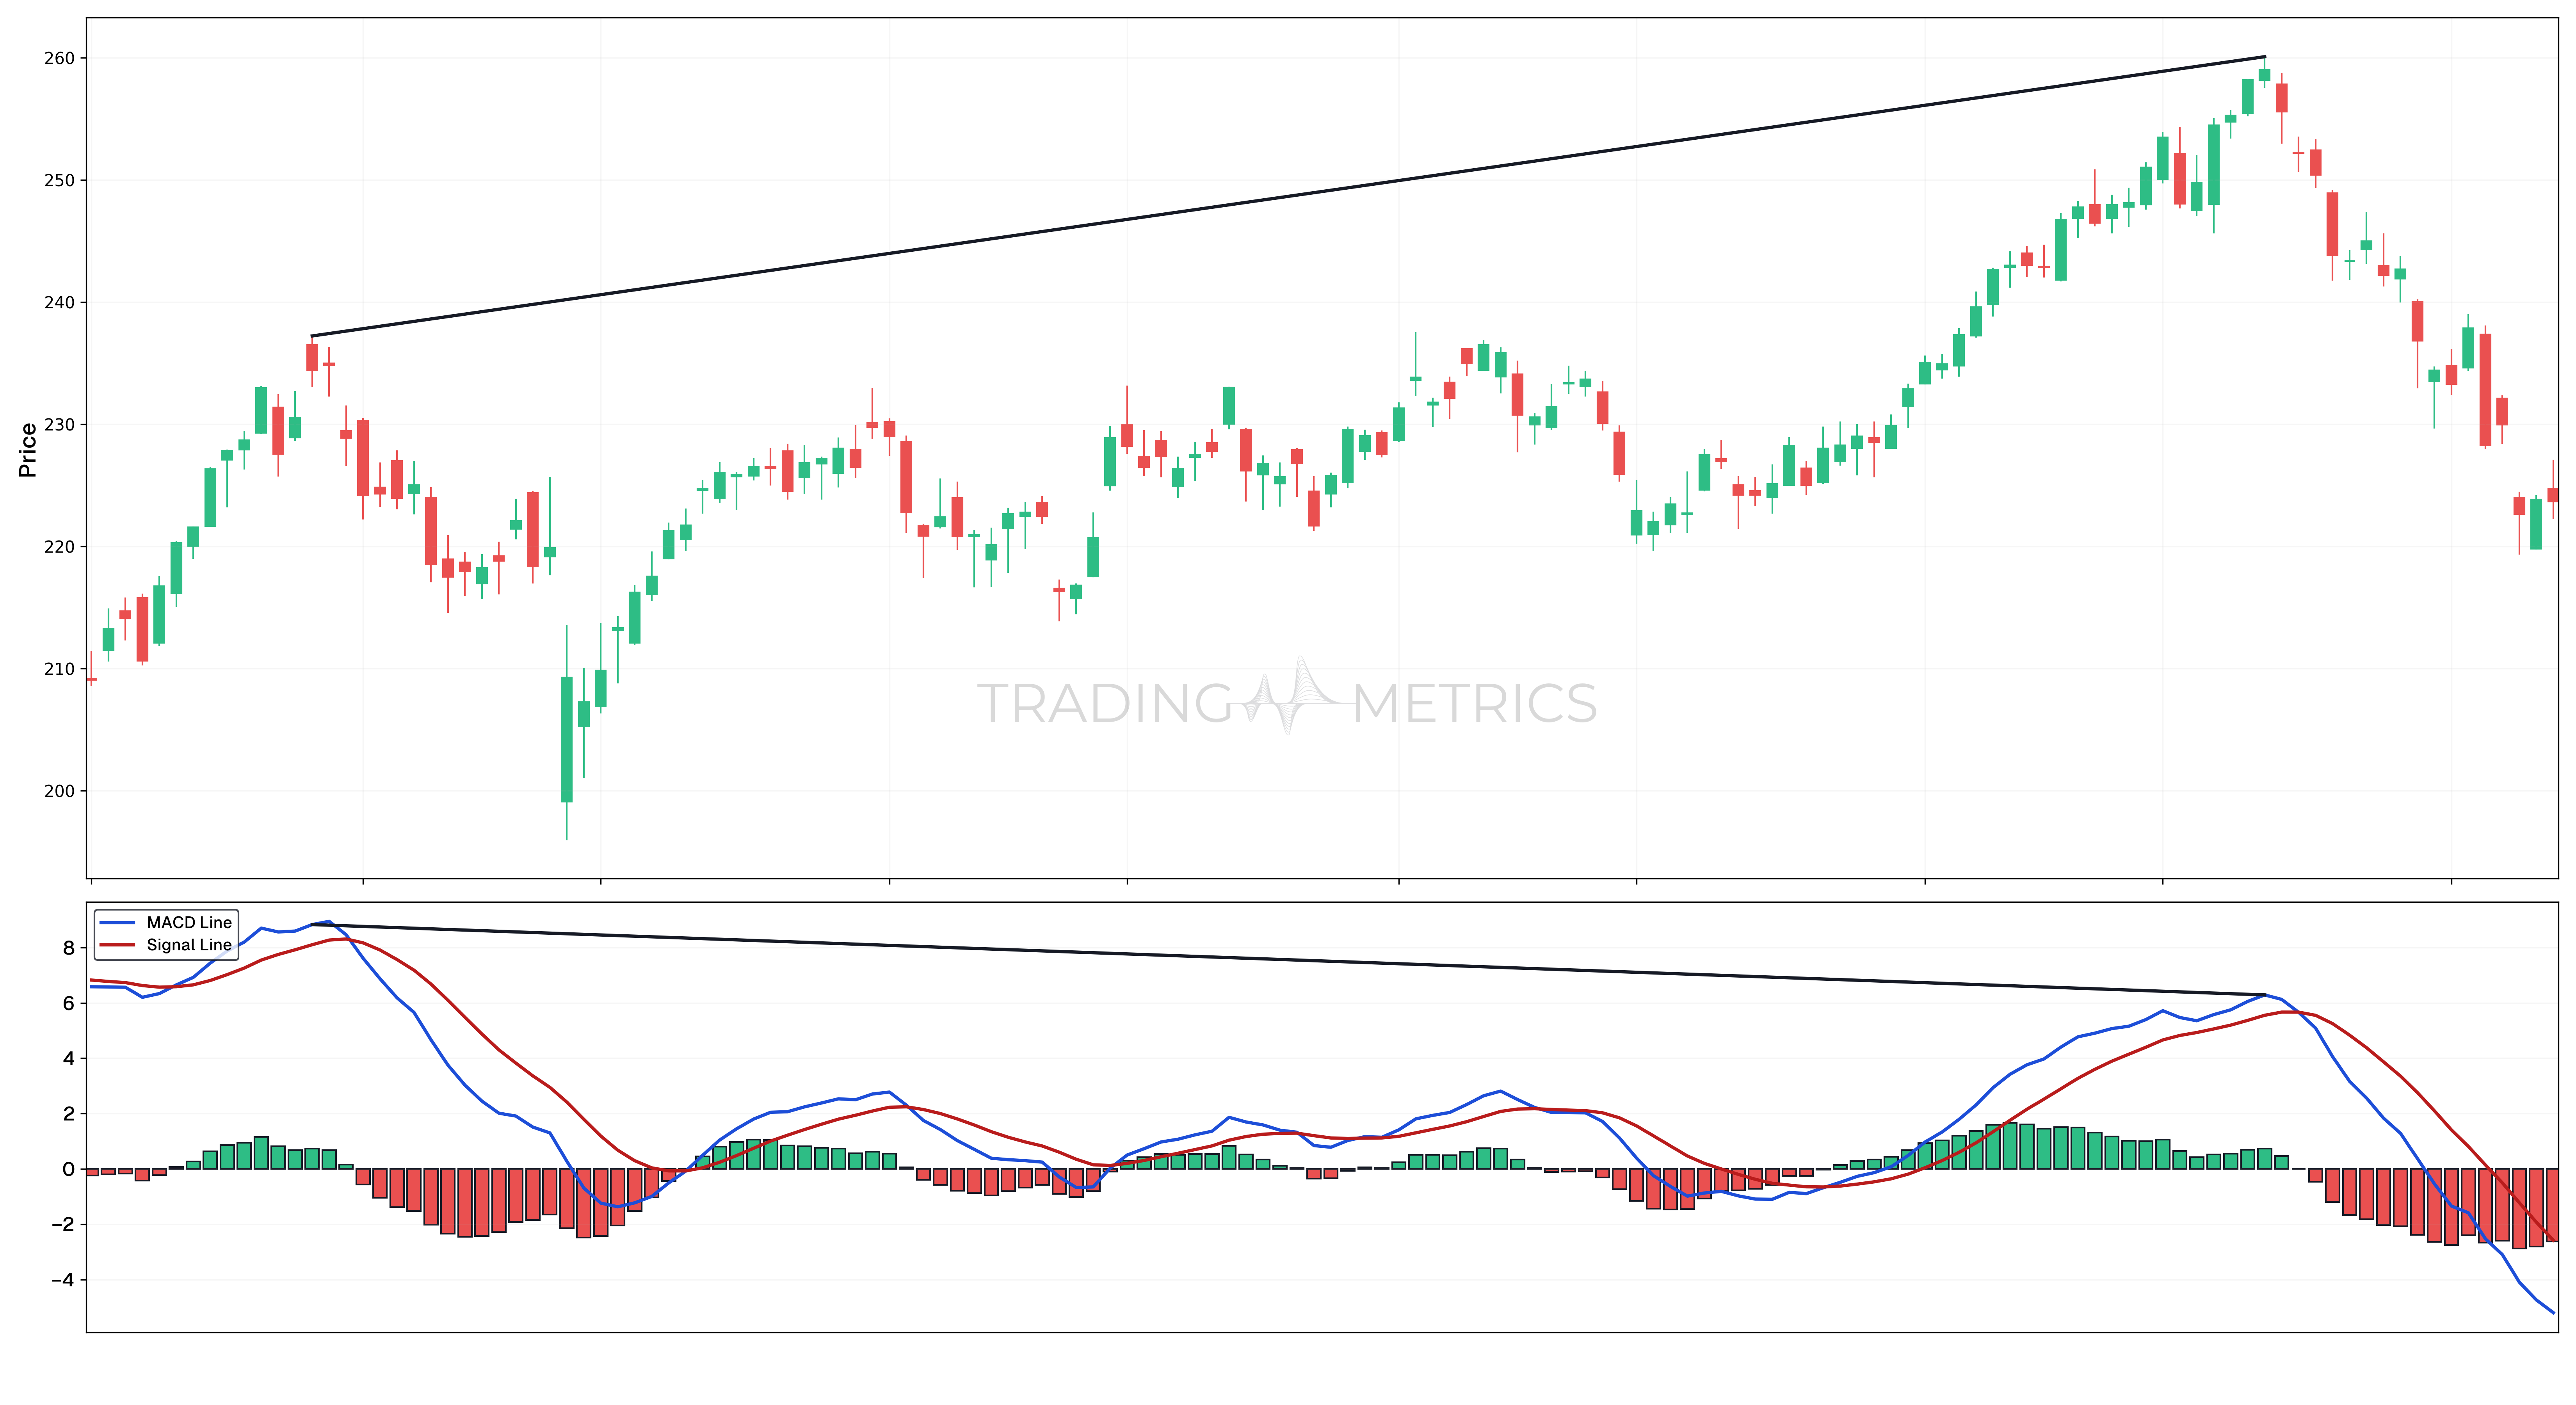
Divergence occurs when price makes a higher high, but the MACD histogram makes a lower high. This 'hidden weakness' signals that despite the rising price, the underlying momentum is fading, often acting as a leading indicator for a significant trend breakdown.
The default 12, 26, 9 settings are optimized for daily charts and swing trading. Day traders often use faster settings like 5, 13, 1 or 3, 10, 16 to capture intraday momentum shifts. Faster settings generate more signals but also more noise, so they require tighter risk management.
The zero line separates bullish from bearish territory. When the MACD line is above zero, the short-term trend is faster than the long-term trend, confirming bullish momentum. Crossovers of the zero line often signal major trend changes and are considered stronger signals than Signal Line crossovers alone.