Matching Low Pattern: When Two Lows Mark a Floor
The Matching Low pattern is a succinct bullish reversal signal in technical analysis, often appearing at the trough of a downtrend. Visualize it as a double-bottom stand - two bearish candles closing at nearly the same low - marking a floor where sellers falter. When this pattern takes shape, it’s a crisp hint that bearish momentum is bottoming out, offering traders a chance to buy or go long as an uptrend prepares to lift off.
How to Identify the Matching Low Pattern in Trading
The Matching Low is a bullish reversal candlestick pattern. It forms at the end of a downtrend when sellers try to press lower but fail, creating identical closes that highlight support. Confirmation is required to validate the shift. Here’s the step-by-step guide.
Start with the Big Picture
This pattern shows up after a downtrend. Sellers remain in control, but the Matching Low signals that strong support is emerging and buyers may soon take over.
Trace the Candle Sequence
The setup is defined by two candles:
- First Candle: A bearish candle pushing lower, continuing the downtrend.
- Second Candle: Another bearish (or neutral) candle, closing at nearly the same level as the first — showing sellers cannot drive price lower.
Zero in on the Confirmation Level
The confirmation level is the high of the second candle. A close above this level signals the bullish reversal.
Watch the Breakout
The bullish trigger comes when a subsequent candle closes above the second candle’s high. That’s your entry point, marking buyer strength.
Check Volume for Additional Confirmation
Volume adds conviction to the setup:
- Rises on the first candle with selling pressure.
- Holds steady or dips on the second candle, showing exhaustion.
- Spikes on the confirming bullish candle, reinforcing the reversal’s credibility.
Rise Gauge: Measure the range from the matching low to the second candle’s high or use nearby resistance levels to project a realistic price target upward from the confirmation close.
How to Trade the Matching Low Pattern (Trading Example)
To illustrate how the Matching Low pattern can be used to enter a trade, we will choose the DOTUSDT pair. This pattern appeared on the daily chart and signaled a potential reversal after a downward move.
Analysis
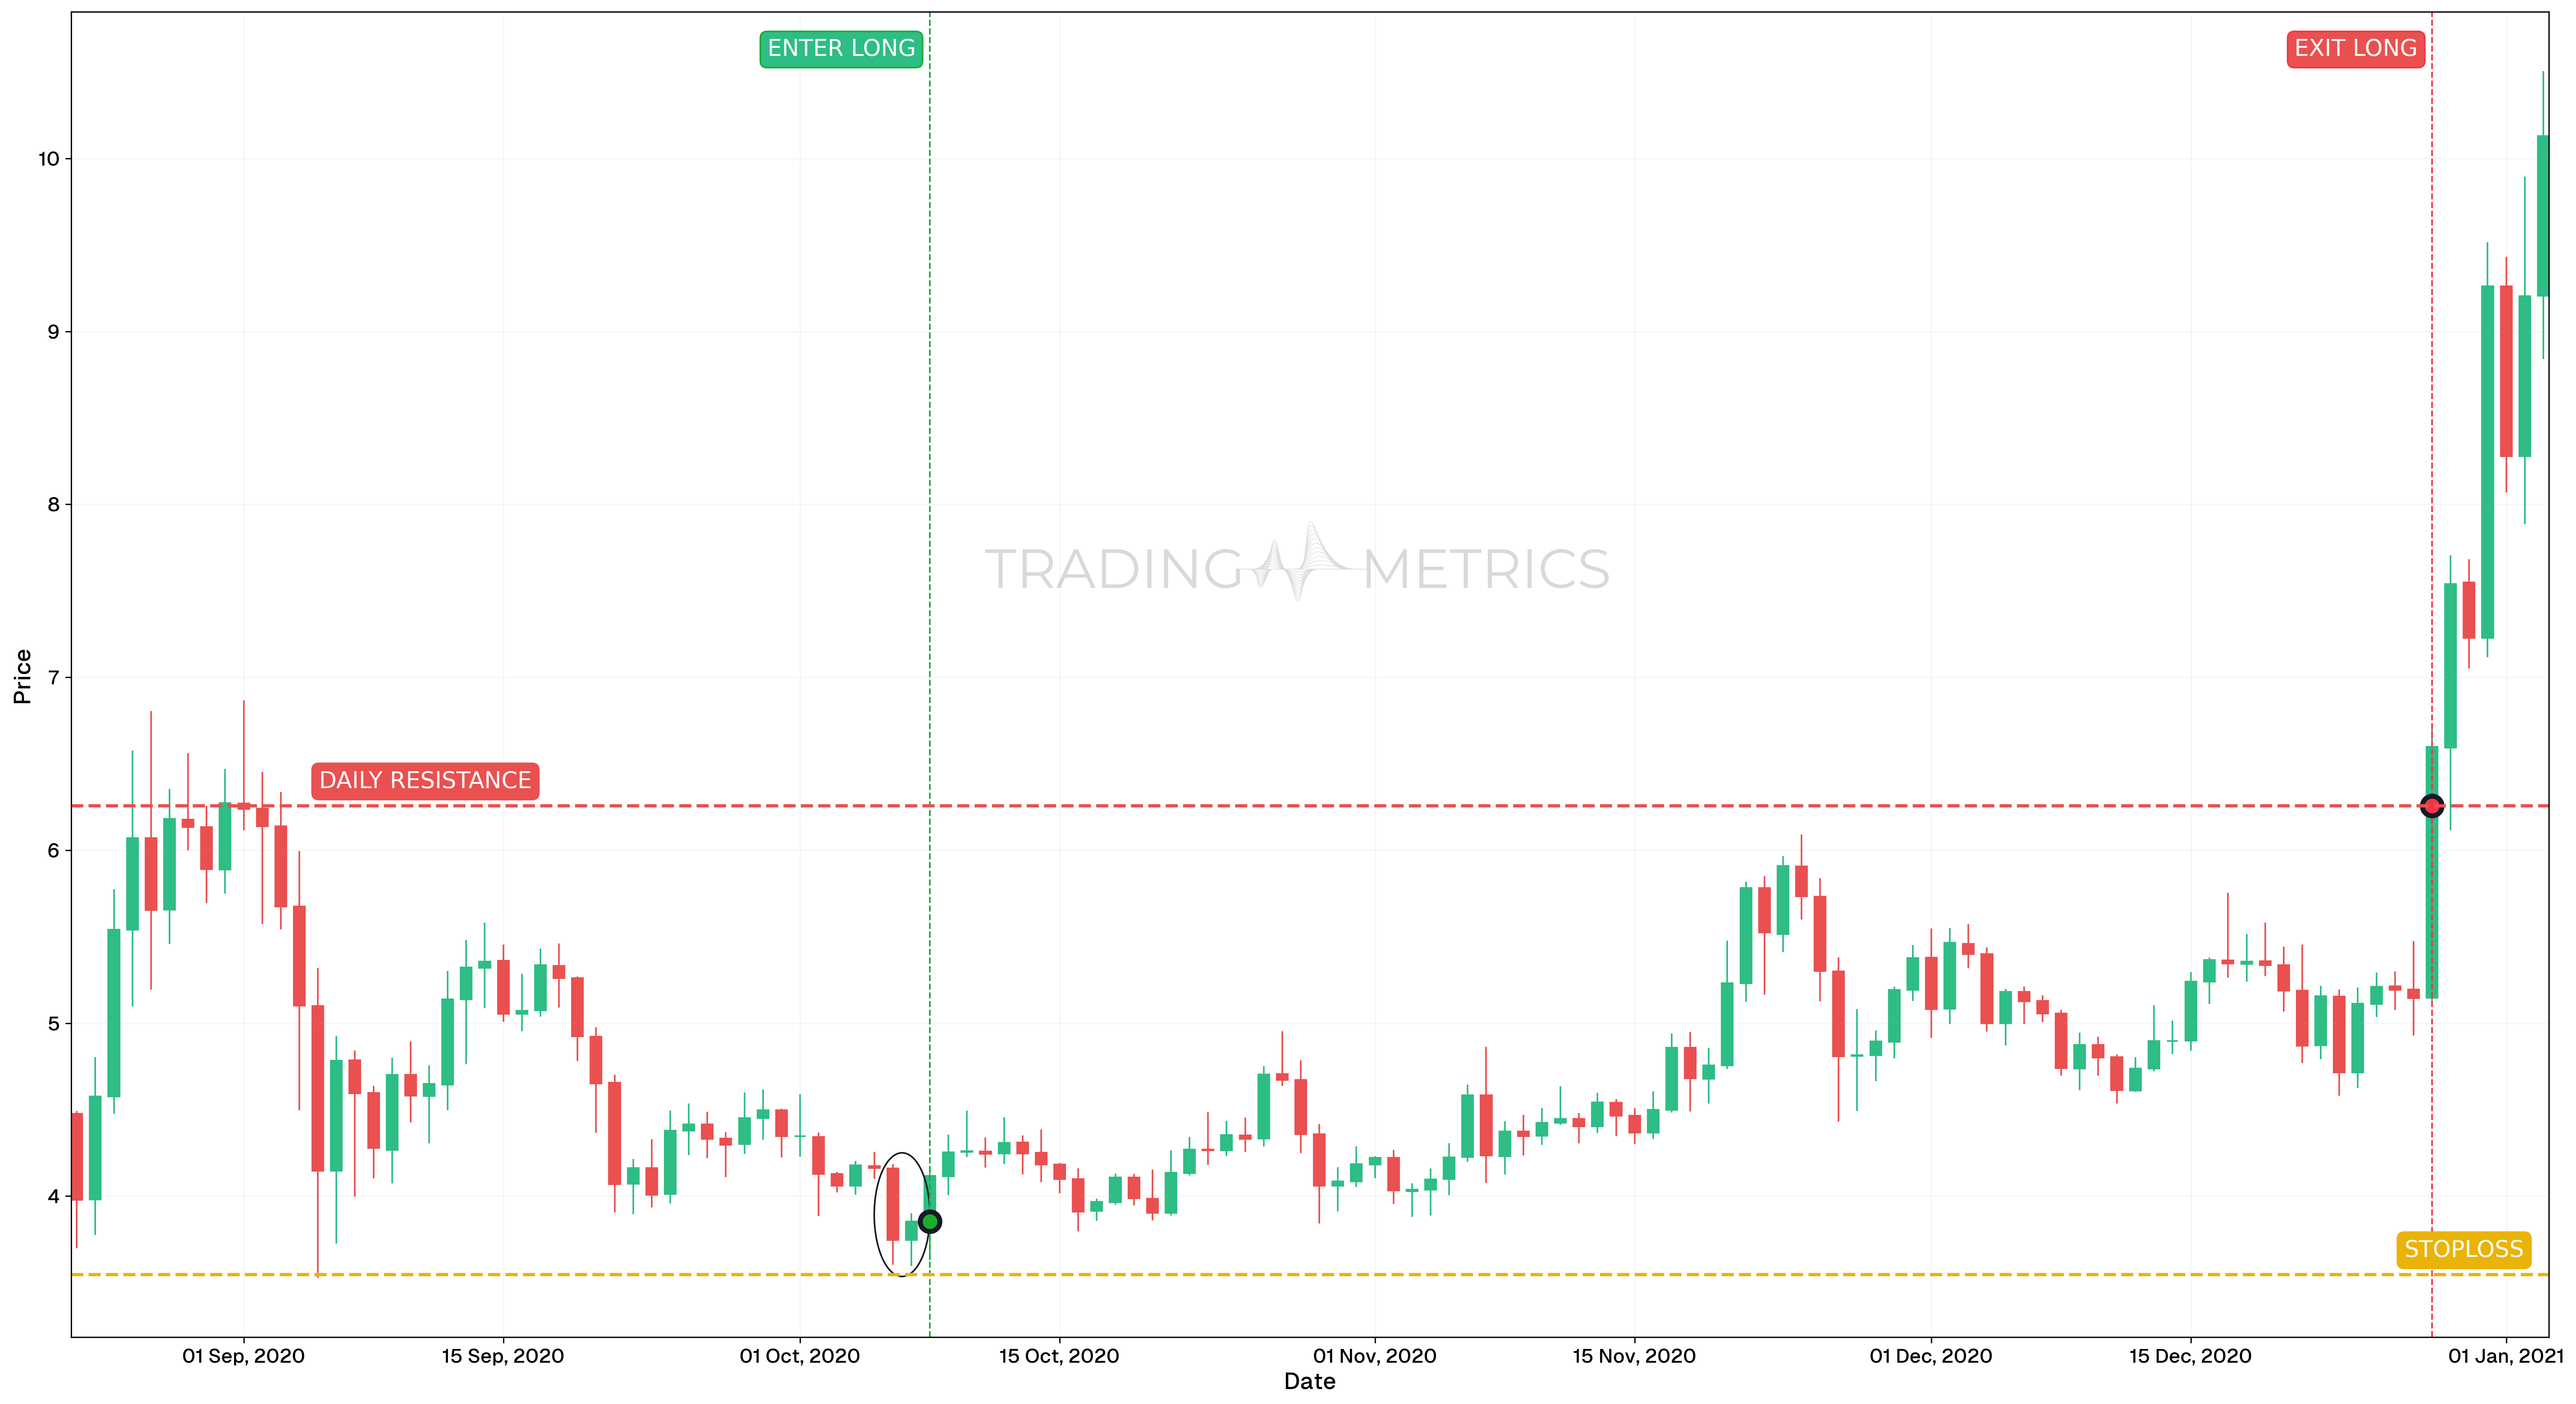
On October 8, 2020, DOTUSDT formed a Matching Low pattern, where two candles closed at nearly the same low price after a downtrend. This pattern indicated that sellers were losing strength and demand was stepping in at that level. It appeared in a zone of previous support, adding technical weight to the setup.
Trade Setup
-
Entry: The trade was entered on October 8, 2020, at $4.115, immediately following the pattern’s confirmation. Supporting confluences included:
-
Exit: The trade was closed on December 28, 2020, at $6.257, near a previous support/resistance level that had served as a pivot during prior price swings.
-
Outcome: The Matching Low reversal led to a 52% gain, capturing a substantial part of the trend with a relatively early entry.
Risk Management
- Stop-Loss placement: The stop-loss was placed at $3.546, just below the pattern’s lows, where invalidation of support would occur.
- Position sizing: A 2% capital risk model was used to calculate position size, based on the entry-to-stop risk.
- Risk-Reward Ratio: The trade delivered a strong Risk-Reward Ratio of 1:3.76, with minimal downside and a favorable structure breakout.
- Volatility Consideration: The pattern developed during a phase of contracting Volatility, which expanded sharply once buyers regained control.
- Adaptive Exit Strategy: Traders could have used a trailing stop or exited in phases at Fibonacci extension levels to scale profits efficiently.
Volume Lift: A volume spike on the confirming candle lifts the pattern into a bullish turn.
Pre-Trade Checklist
Lift the Proof: Pair the pattern with volume spikes and indicators like RSI to dodge fakes and boost your odds.
Key Points
- Low Precision: Nearly identical lows boost reliability - wide gaps dilute it.
- Time Frame: Lifts brightest on daily or weekly charts after downtrends.
- Combine with Indicators: Use moving averages or RSI to confirm the reversal.
- Breakout Confirmation: A close above the second candle’s high sets the turn - don’t jump on the match alone.
- Price Target: Measure the range from low to high or use resistance levels for a target above the confirmation.
- Risk Management: Set a stop-loss below the matching low to limit losses if it fails.
Wait for the Lift: Acting before confirmation risks a low trap - let the reversal confirm.
Conclusion
The Matching Low pattern is a trader’s crisp tool for catching bullish reversals. Its double-bottom floor, paired with volume, RSI, and moving averages, can lift big gains. Whether in crypto, stocks, or forex, this pattern sharpens your edge. Stay patient, manage your risk, and let the lows match - that stalled floor could rise into a winning trade.
Frequently Asked Questions
Quick answers based on this page's topic.
A Matching Low consists of two bearish candles with nearly identical closing prices at the bottom of a trend. It indicates that the market has hit a 'structural barrier.' Sellers tried twice to push the price to a lower close and failed both times, signaling that buyers have stepped in to absorb all available supply.
The difference lies in which part of the candle matches. In a Tweezer Bottom, the *lows* (wicks) match. In a Matching Low, the *closing prices* match. The Matching Low is a more conservative signal because it shows that the market could not sustain a lower value by the end of the session.
High-probability targets are usually set at the nearest major resistance zone or the previous swing high. Because the Matching Low represents a 'stalled' downtrend, the resulting move is often a steady recovery as trapped short-sellers are forced to buy back their positions.