Understanding Common Gaps: Trading Sideways Price Jumps
The Common Gap pattern is a subtle neutral signal in technical analysis, most often appearing during a sideways trend or consolidation phase. Think of it as a brief hiccup where price gaps slightly up or down from the previous close while keeping the range’s rhythm intact. When this pattern forms, it suggests that momentum is stalling, giving traders time to observe rather than commit, since it usually fills quickly and shows little directional bias.
How to Identify the Common Gap Pattern in Trading
The Common Gap is a neutral candlestick pattern. It appears inside a consolidation or ranging market, where price gaps slightly but without trend implications. It’s usually a short-lived blip that often fills quickly. Here’s the step-by-step guide.
Start with the Big Picture
This pattern shows up during a sideways market. Unlike breakaway or runaway gaps, a common gap doesn’t signal continuation or reversal — it reflects short-term imbalance that often gets filled.
Trace the Price Movement
The setup develops in two parts:
- Pre-Gap Phase: Price moves inside a consolidation range (rectangle or sideways band), with no strong trend.
- Gap: A small gap up or down, where the new candle’s range doesn’t overlap with the previous one, but still stays inside the broader consolidation.
Zero in on the Confirmation Level
The confirmation level is the gap fill point — the prior day’s close or range that the gap opened away from. Common gaps are usually filled quickly.
Watch the Gap Behavior
The signal comes when price fills the gap or holds inside the consolidation zone. It’s not an entry trigger by itself, but a cue to wait until the larger range resolves with a breakout.
Check Volume for Additional Confirmation
Volume behavior highlights its neutrality:
- Stays low or steady during consolidation.
- Remains muted on the gap day, lacking the surge seen in stronger gaps.
Range Watch: Measure the consolidation range height and project it from the range’s edges for potential price targets if a breakout occurs, not the gap itself.
How to Trade the Common Gap Pattern (Trading Example)
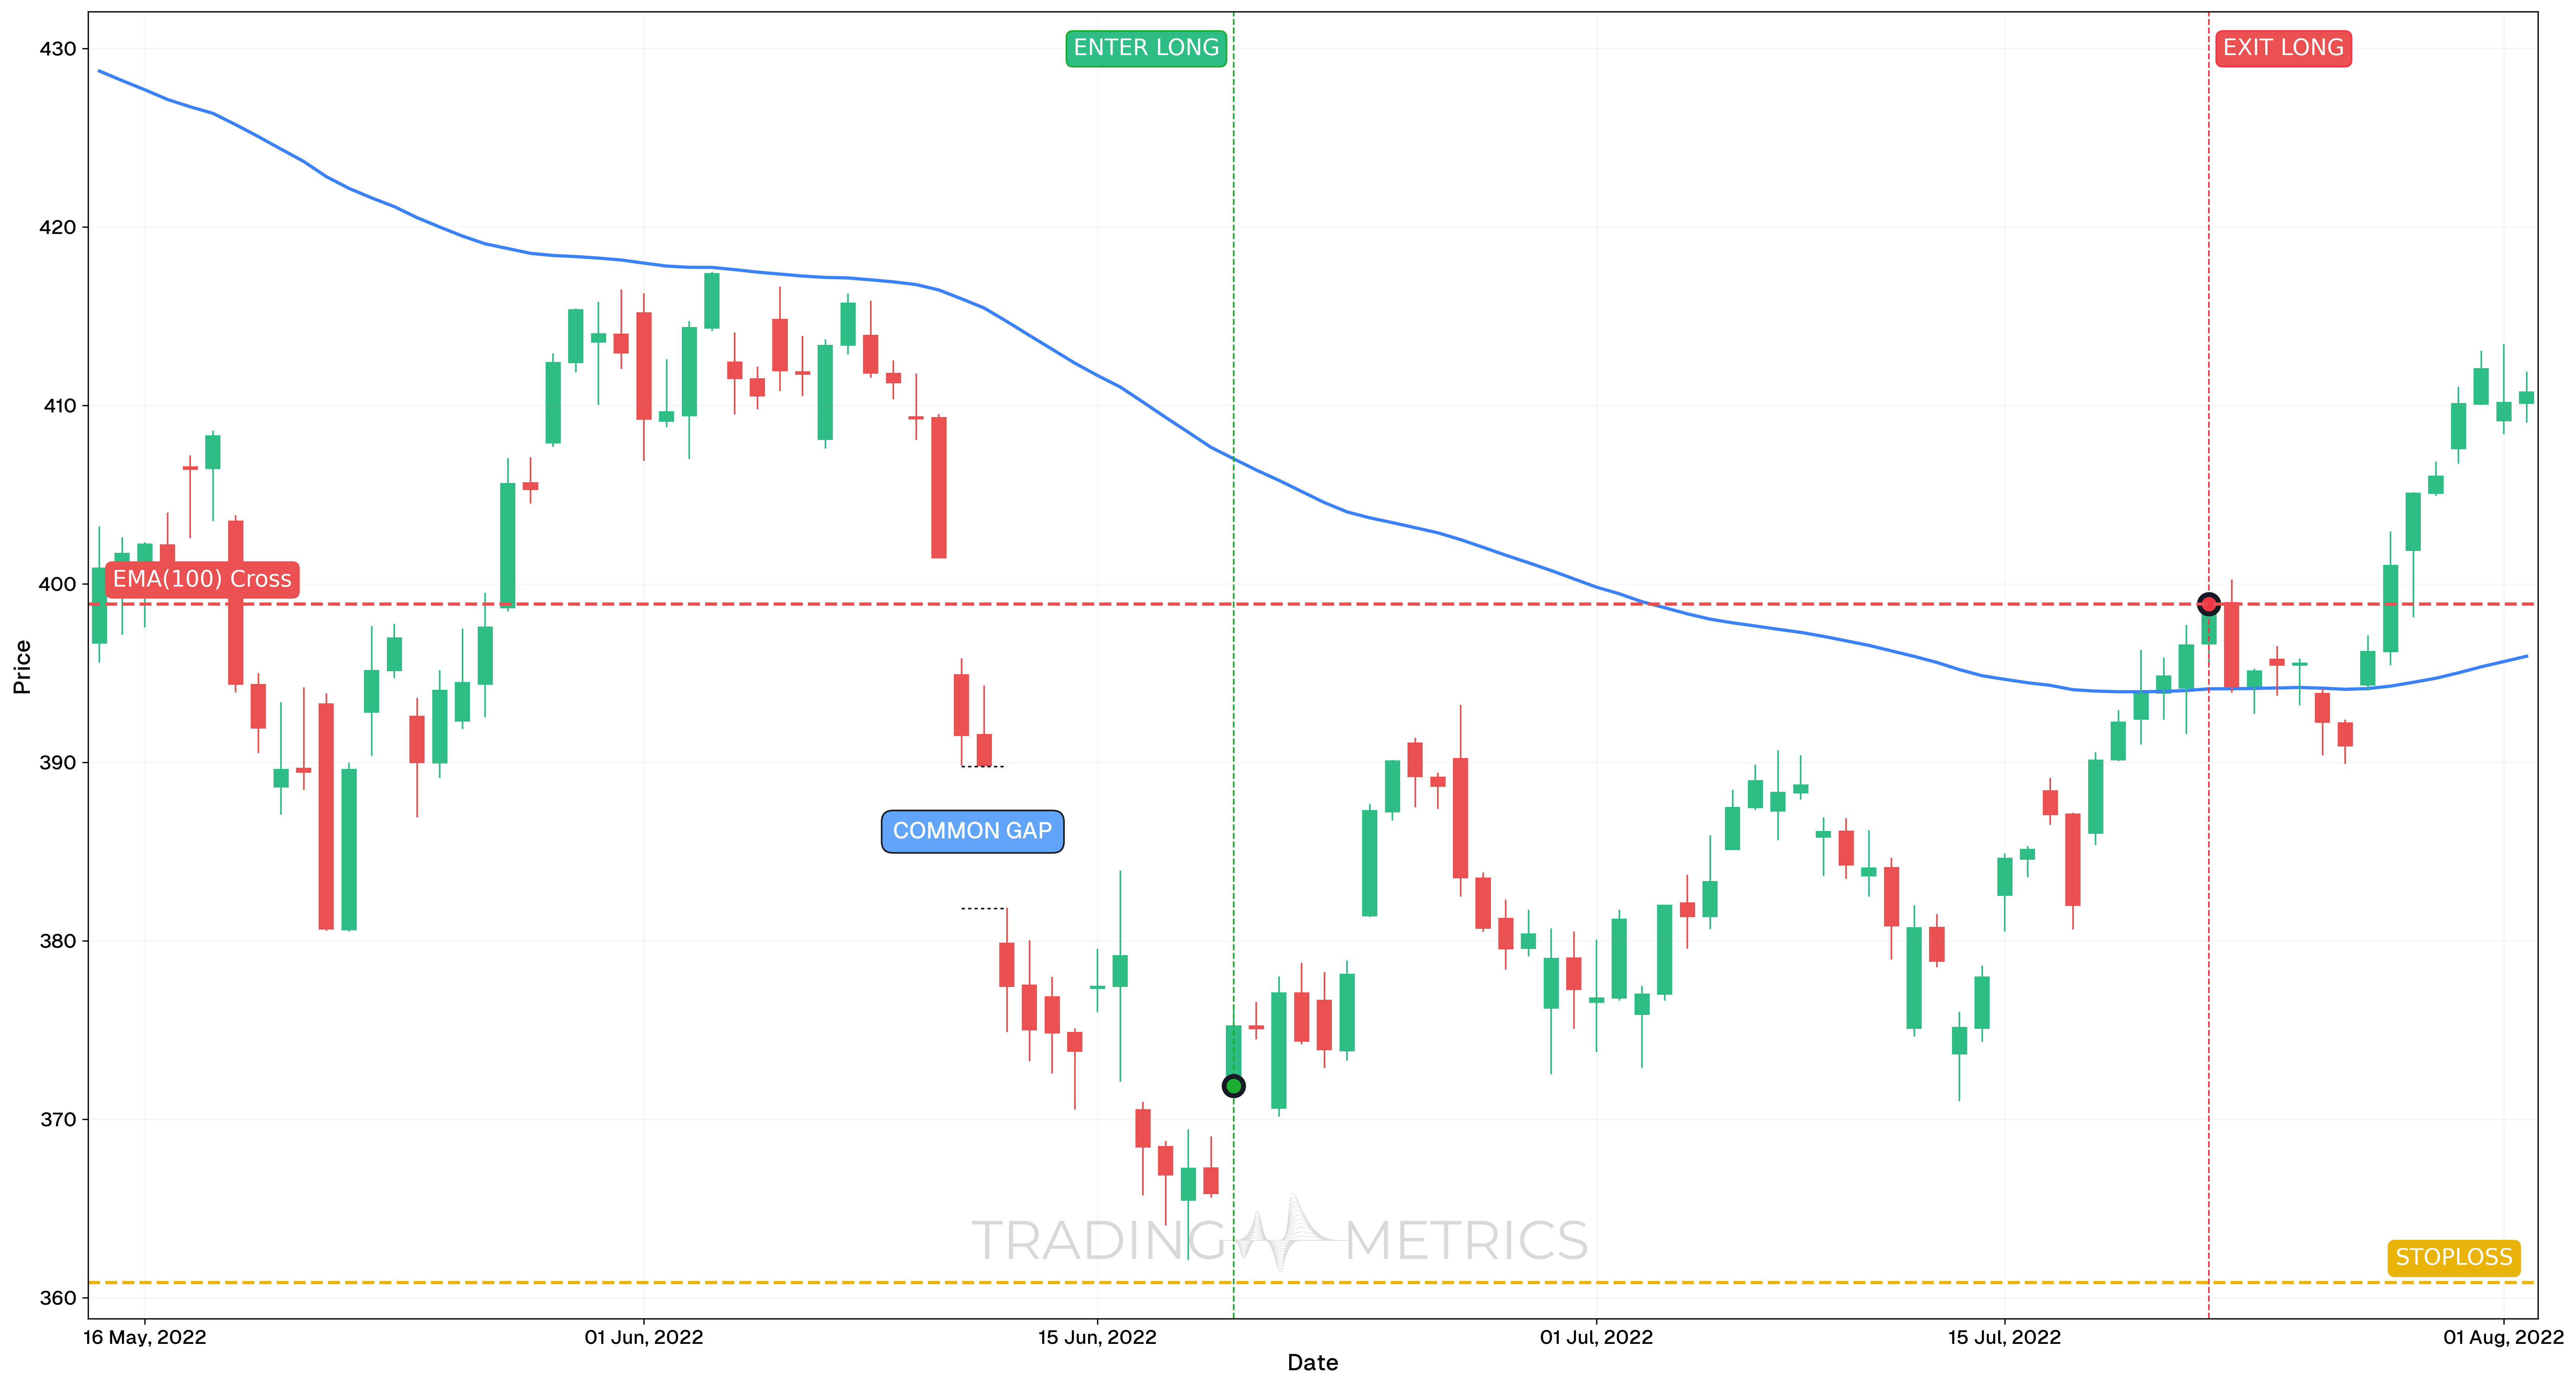
To demonstrate how a Common Gap pattern can be traded, we’ll analyze the SPY ETF on the 4-hour chart. This example captures a typical gap followed by continuation scenario during a market retracement and shows how to align it with momentum indicators.
Analysis
On June 21, 2022, a Common Gap appeared on the SPY chart, following a Spinning Top formation two candles earlier. The gap was relatively small but significant, suggesting routine repositioning by market participants rather than a major news-driven move. It was soon followed by steady price continuation.
Trade Setup
-
Entry: The trade was initiated on June 21, 2022 at 15:00, at $371.68, shortly after the gap-up candle confirmed support. Entry was validated by:
- A Spinning Top two candles earlier, suggesting indecision resolving upward
- RSI rising and nearing 50
- StochRSI rising and had already crossed bullish
-
Exit: Position was closed on July 21, 2022 at 19:30, at $398.87, after a rejection at the EMA(100), which acted as resistance.
-
Outcome: The Common Gap produced a clean continuation move. The gap acted as support while price climbed steadily until a technical ceiling was hit.
Risk Management
- Stop-Loss placement: Stop-loss was placed at $360.85, below the previous support zone and beneath the base of the gap.
- Risk-Reward Ratio: 1:2.51 means that the distance from entry to stop-loss was well-defined, with a target over twice the size of the risk. This offered a strong risk-managed reward opportunity.
- Position sizing: Calculated using a 2% risk model, based on the gap support zone.
- Volatility Consideration: Moderate Volatility and small gap size made this a safer continuation trade versus a Breakaway Gap or Exhaustion Gap.
- Confirmation Logic: Using RSI and StochRSI together with gap support improved confidence in the breakout continuation.
Volume Pause: A lack of volume surge on the gap day keeps the pattern in a neutral ripple.
Pre-Trade Checklist
Ripple the Proof: Pair the pattern with volume calm and indicators like RSI to confirm its neutrality and wait for the range’s next move.
Key Points
- Gap Size: A small gap within a range boosts its common status - large gaps suggest otherwise.
- Time Frame: Ripples clearest on daily charts in sideways markets.
- Combine with Indicators: Use moving averages or RSI to confirm consolidation, not the gap itself.
- Breakout Confirmation: The gap filling or range holding signals neutrality - trade the range breakout, not the gap.
- Price Target: Use the range’s height for targets post-breakout, not the gap’s span.
- Risk Management: Set a stop-loss at the range’s opposite edge (below support for longs) to limit losses if it breaks the wrong way.
Wait for the Ripple: Acting on the gap alone risks a range trap - let the fill or breakout confirm the next move.
Conclusion
The Common Gap pattern is a trader’s subtle cue within sideways markets, offering no strong push but a chance to prep for the range’s next shift. Its quiet ripple, paired with volume, RSI, and moving averages, can guide your stance. Whether in crypto, stocks, or forex, this pattern sharpens your patience. Stay calm, manage your risk, and let the gap play out - that brief blip could ripple into a winning trade with the right breakout.
Frequently Asked Questions
Quick answers based on this page's topic.
Common Gaps occur within established trading ranges or sideways markets. Because they lack the volume and momentum of Breakaway or Runaway gaps, they usually indicate temporary order imbalances that the market corrects quickly by returning to the prior price level.
A gap is filled when price action moves back to the level where the gap originated, effectively 'closing' the empty space on the chart. Common Gaps are filled more frequently and quickly than any other gap type, often within the same session or a few days.
While not great for trend entries, they are useful for mean-reversion strategies. Traders often look for a Common Gap as a signal that the price is temporarily overextended within a range, providing an opportunity to trade back toward the range's midpoint or moving average.