Correlation Matrix: Spottnig Hidden Risks in Your Asset Allocation
A Correlation Matrix is a table that shows the correlation coefficients between many variables. Each cell in the matrix shows the correlation between two assets. The values range from -1 to 1:
- 1 indicates a perfect positive correlation, meaning they move exactly in the same direction.
- -1 indicates a perfect negative correlation, meaning they move in opposite directions.
- 0 indicates no correlation, meaning their movements are completely independent.
Imagine you have a bunch of friends who all love different kinds of music. Some friends always seem to like the same songs you do, while others have tastes that are totally different. Now, imagine you could create a chart that shows how similar each friend’s musical taste is to every other friend’s. This chart is like a correlation matrix, but instead of comparing musical tastes, it compares how different financial assets move in relation to one another.
You must be diversified enough to survive bad times or bad luck so that skill and good process can have the chance to pay off over the long term.
- Joel Greenblatt
How to Calculate a Correlation Matrix?
Calculating a correlation matrix involves a bit of math, but don’t worry, it’s simpler than it sounds! Here’s how you can do it:
Gather the Data
Collect historical price data for the assets you’re interested in. For example, if you’re comparing Bitcoin, Ethereum, and the S&P 500, you need their daily closing prices over a certain period.
Calculate Returns
Compute the daily returns for each asset. Returns can be calculated using the formula:
Calculate Correlation Coefficients
Use statistical software or calculator to compute the Pearson correlation coefficient for each pair of assets. The formula for the Pearson correlation is:
where
- is the covariance of variables and
- and are the standard deviations of and .
Use Correlations to Diversify Risk: A correlation matrix helps you avoid overloading your portfolio with highly correlated assets that may move together in the same direction.
Importance of a Correlation Matrix in Trading
A correlation matrix is a powerful tool in data analysis, helping identify relationships between variables by quantifying their linear associations. It provides valuable insights for decision-making, such as detecting multicollinearity in regression models, uncovering patterns in datasets, and optimizing portfolio diversification by assessing asset correlations.
Correlation Between Major Stock Indices
To illustrate the concept, let’s examine the correlation matrix for major stock indices: S&P 500, NASDAQ, Dow Jones, and the Russell 2000. We’ll use historical price data from the past year.
| Stocks | S&P 500 | NASDAQ | Dow Jones | Russell 2000 |
|---|---|---|---|---|
S&P 500 | 1.00 | 0.89 | 0.94 | 0.83 |
NASDAQ | 0.89 | 1.00 | 0.85 | 0.78 |
Dow Jones | 0.94 | 0.85 | 1.00 | 0.81 |
Russell 2000 | 0.83 | 0.78 | 0.81 | 1.00 |
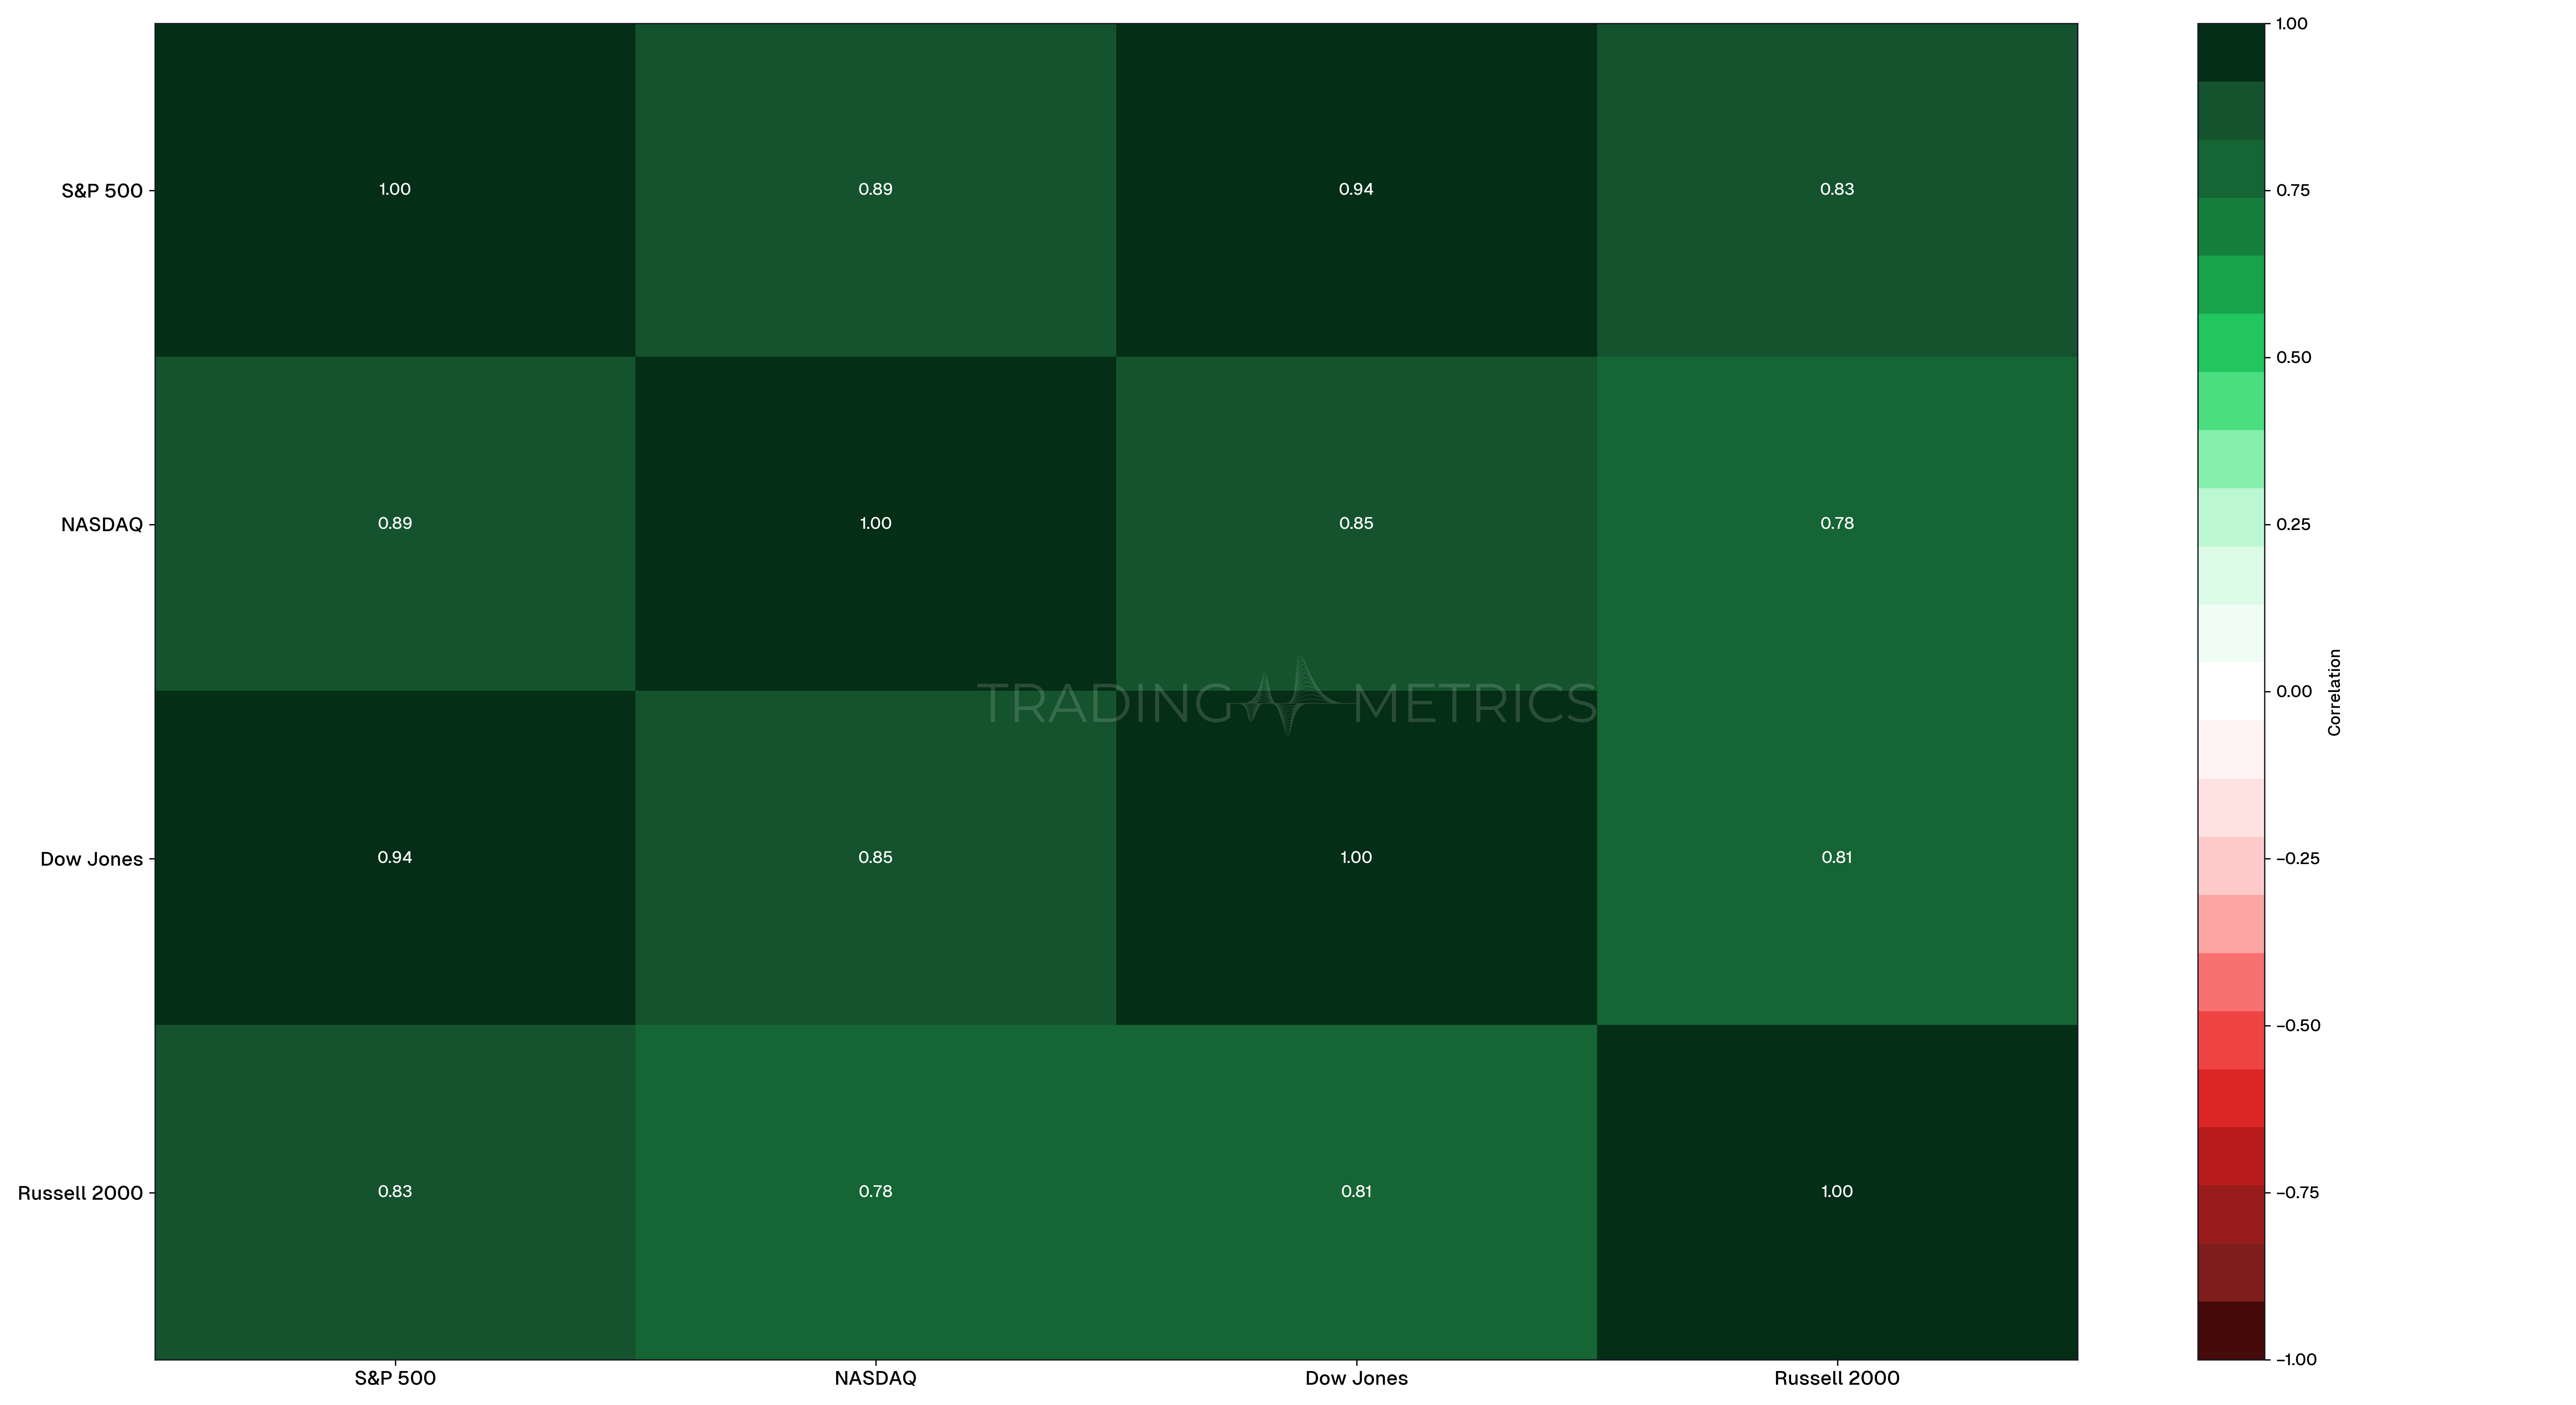
Analysis:
- S&P 500 and Dow Jones have a very high correlation (0.94), indicating that these indices often move in tandem.
- NASDAQ has a strong correlation with S&P 500 (0.89) but slightly lower with Dow Jones (0.85).
- Russell 2000 has a lower correlation with the other indices, especially with NASDAQ (0.78).
These correlations suggest that while the major indices are generally correlated, there are nuances that traders can exploit. For example, diversifying with the Russell 2000 might offer some risk mitigation due to its slightly lower correlation with the other indices.
Reassess Correlations Regularly: Market dynamics evolve, so update your correlation matrix periodically to stay aligned with current trends.
Correlation Between Different Asset Classes
Next, let’s examine the correlation between different asset classes: equities (S&P 500), bonds (U.S. 10-Year Treasury), gold, and oil. This will help us understand how these assets interact, particularly during different market conditions.
| Assets | S&P 500 | U.S. 10-Year Treasury | Gold | Oil |
|---|---|---|---|---|
S&P 500 | 1.00 | -0.30 | -0.20 | 0.60 |
U.S. 10-Year Treasury | -0.30 | 1.00 | 0.50 | -0.10 |
Gold | -0.20 | 0.50 | 1.00 | 0.20 |
Oil | 0.60 | -0.10 | 0.20 | 1.00 |
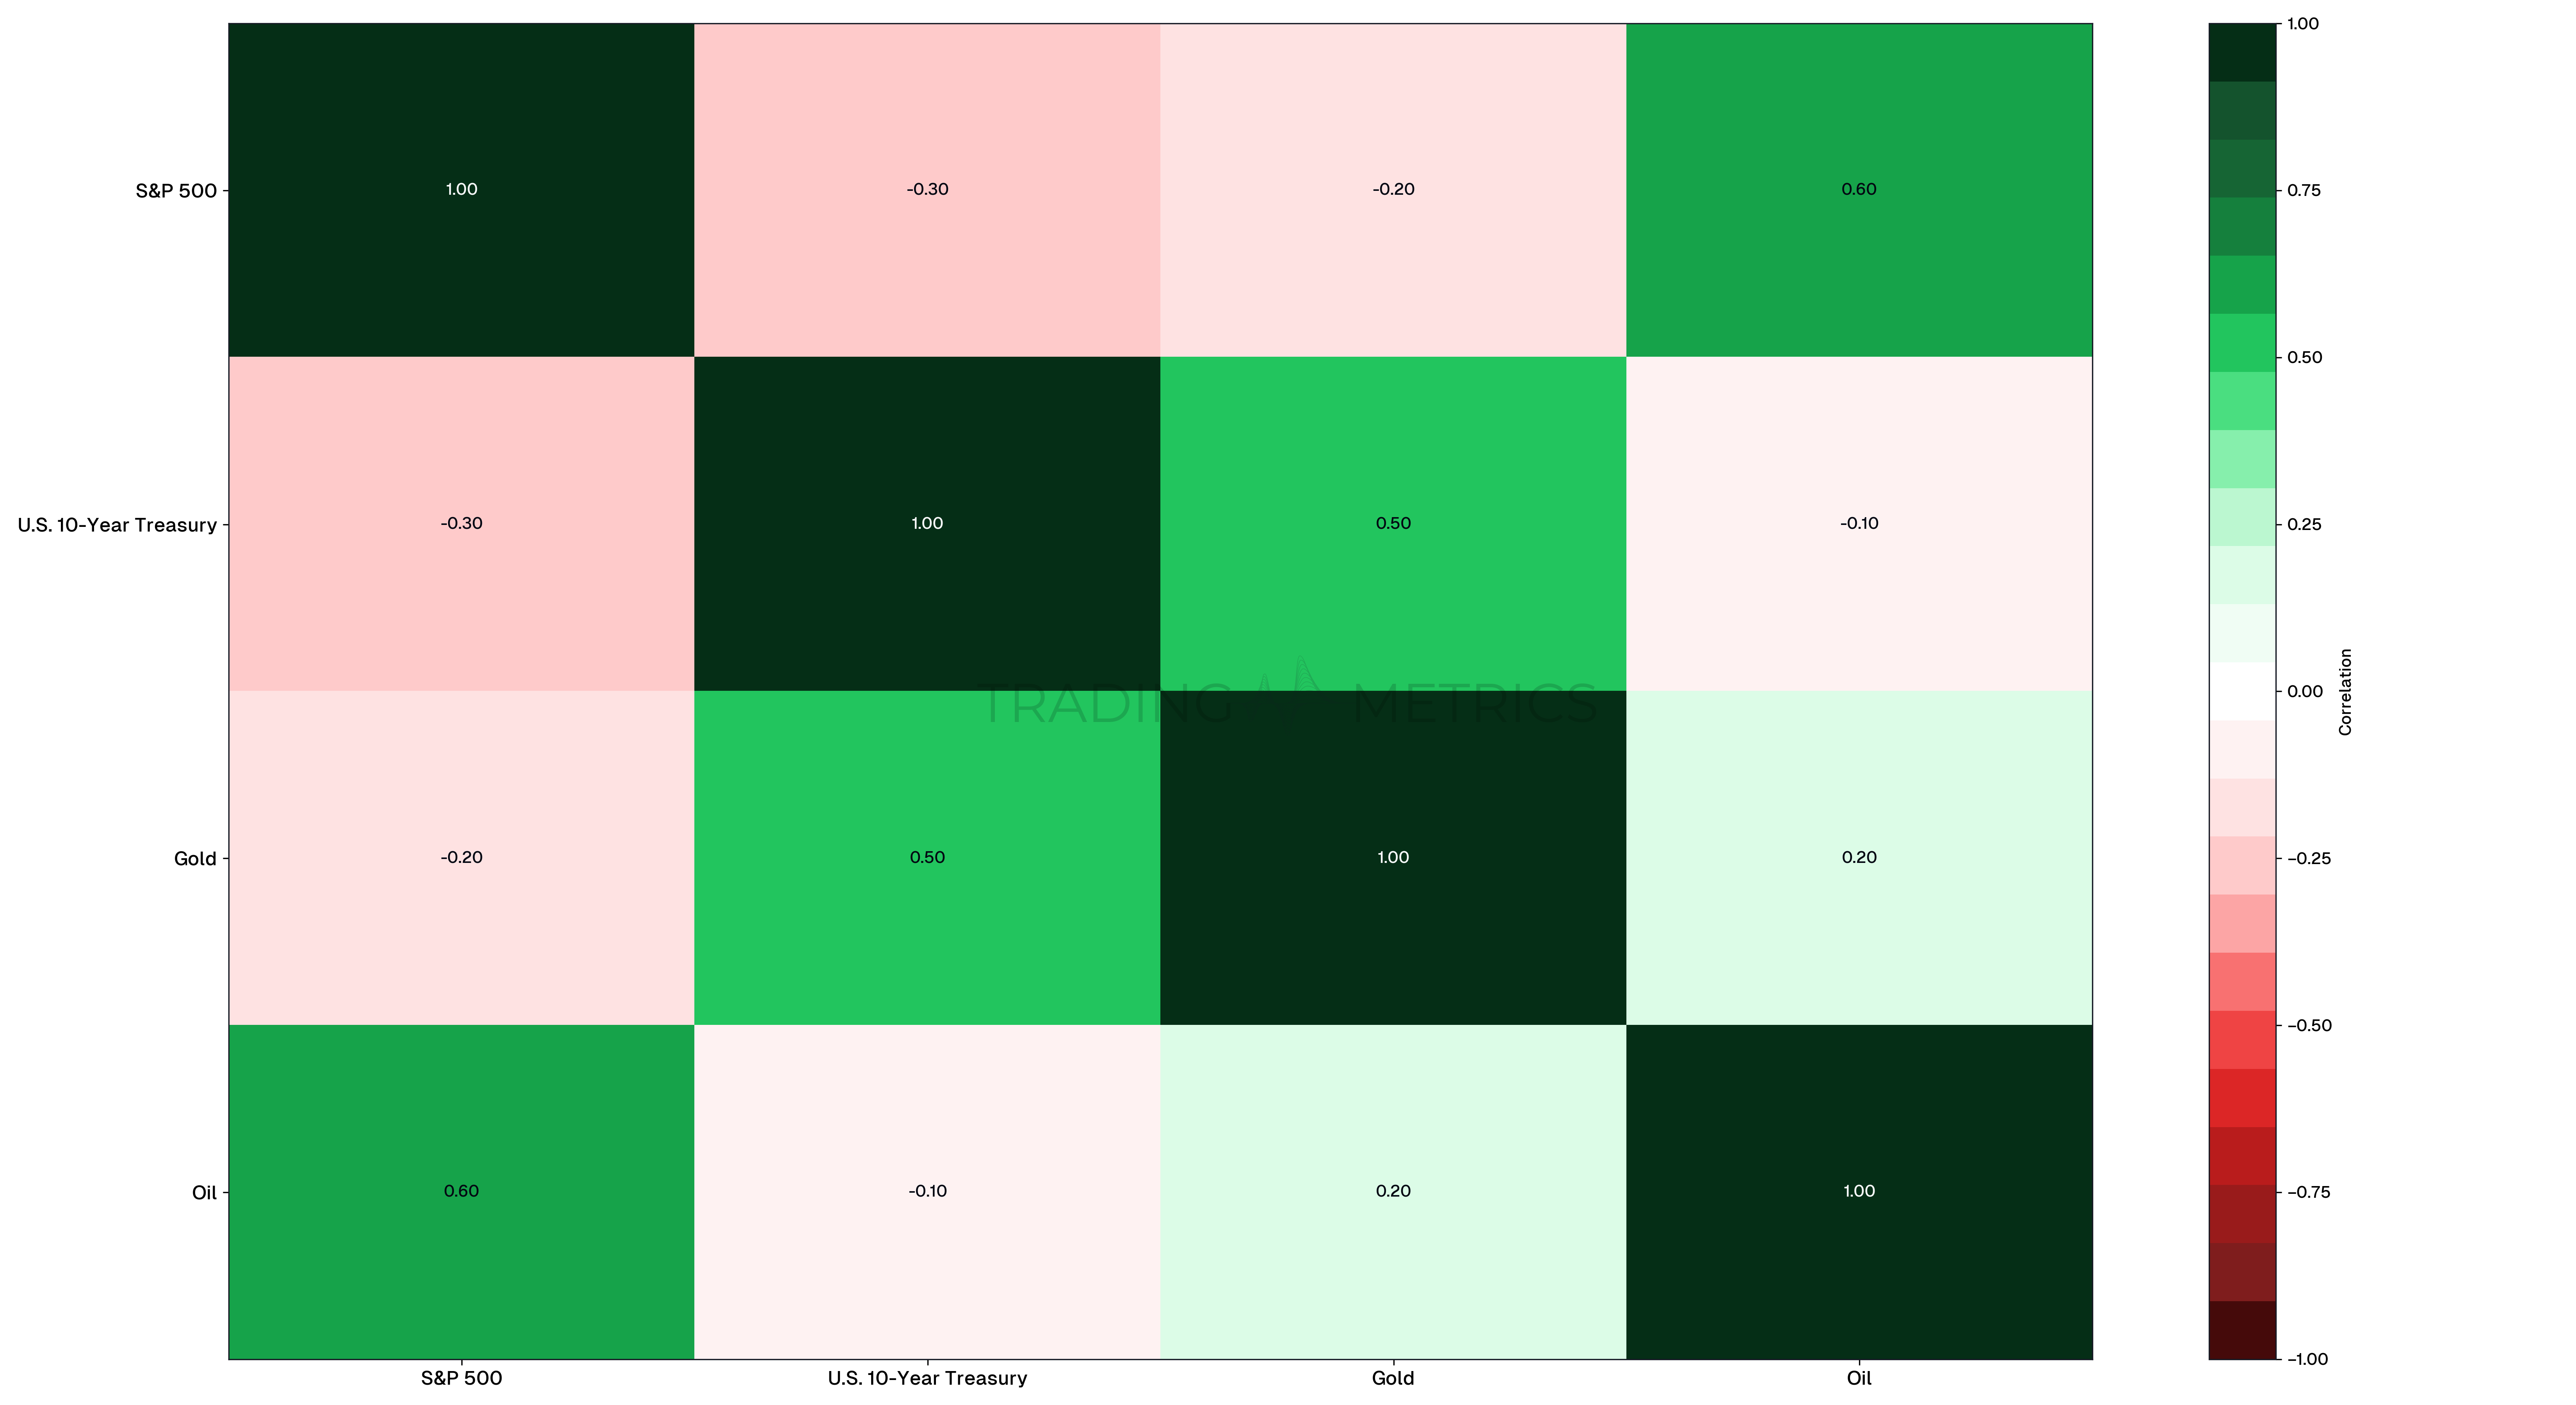
Analysis:
- S&P 500 and U.S. 10-Year Treasury have a negative correlation (-0.30), indicating that they often move in opposite directions. This is typical during economic uncertainty where bonds are considered safer investments.
- Gold has a moderate positive correlation with U.S. 10-Year Treasury (0.50) but a slight negative correlation with S&P 500 (-0.20).
- Oil has a positive correlation with S&P 500 (0.60), reflecting its ties to economic growth and industrial demand.
These correlations provide valuable insights for portfolio diversification. For example, holding a mix of equities and bonds can reduce overall portfolio risk due to their negative correlation.
Reassess Correlations Regularly: Market dynamics evolve, so update your correlation matrix periodically to stay aligned with current trends.
Combining the Correlation Matrix with Other Tools
To gain deeper insights, traders often combine the correlation matrix with other tools:
- Technical Analysis: Combining correlation analysis with technical indicators (e.g., moving averages, Relative Strength Index (RSI)) helps in timing trades better.
- Fundamental Analysis: Understanding the correlation in the context of macroeconomic factors and news events can enhance decision-making.
- Statistical Tools: Using advanced statistical techniques like Principal Component Analysis (PCA) can help in understanding the underlying factors driving the correlations.
Pair Correlations with Other Tools: Use a correlation matrix alongside other risk management tools to develop a robust trading strategy.
Key Points
- Relationship Insight: A correlation matrix displays the relationships between multiple assets, helping identify how they move relative to one another.
- Diversification Tool: Use the correlation matrix to select uncorrelated or negatively correlated assets, which can reduce overall portfolio risk.
- Dynamic Nature: Asset correlations can change over time due to market conditions, requiring regular updates to the matrix for accurate analysis.
- Sector and Asset Class Analysis: Correlation matrices are useful for understanding relationships within sectors, asset classes, or geographic regions.
- Risk Management: Identifying highly correlated assets helps avoid overconcentration, improving portfolio balance.
- Stress Testing: During market downturns, correlations often increase, limiting diversification benefits; use the matrix to stress-test potential scenarios.
- Strategic Allocation: A well-analyzed correlation matrix guides Asset Allocation decisions, ensuring a balance between return and risk.
- Supplementary Metric: Combine the correlation matrix with metrics like volatility and Diversification Ration for a comprehensive portfolio analysis.
- Visualization Advantage: The matrix format provides a clear and quick overview of relationships, aiding in decision-making and portfolio adjustments.
Conclusion
A correlation matrix is a powerful tool in a trader’s toolkit. It helps in understanding relationships between different assets, managing risk, and constructing diversified portfolios. By leveraging the power of a correlation matrix, you can make more informed trading decisions and better navigate the complexities of the financial markets.
Frequently Asked Questions
Quick answers based on this page's topic.
A correlation matrix shows how closely assets move together on a scale of -1 to 1. If you own ten different cryptocurrencies but they all have a 0.95 correlation with Bitcoin, you aren't diversified—you are simply exposed to the same risk ten times over.
Negative correlation means two assets move in opposite directions. For example, if the US Dollar falls, Gold often rises. Including negatively correlated assets in a portfolio creates a 'hedge,' where gains in one asset can offset losses in another during market stress.
Yes. During extreme market crashes, correlations often 'tend toward 1,' meaning almost everything sells off at once as investors rush to cash. This is why it is critical to use a correlation matrix to find assets that remain independent even during high-volatility events.