Special Candlestick Patterns: When Buyers and Sellers Pause
Special candlestick patterns highlight unique market behaviors that reveal shifts in trend strength, momentum, or indecision. Recognizing these setups can help traders anticipate potential breakouts, reversals, or trend continuations with greater confidence.
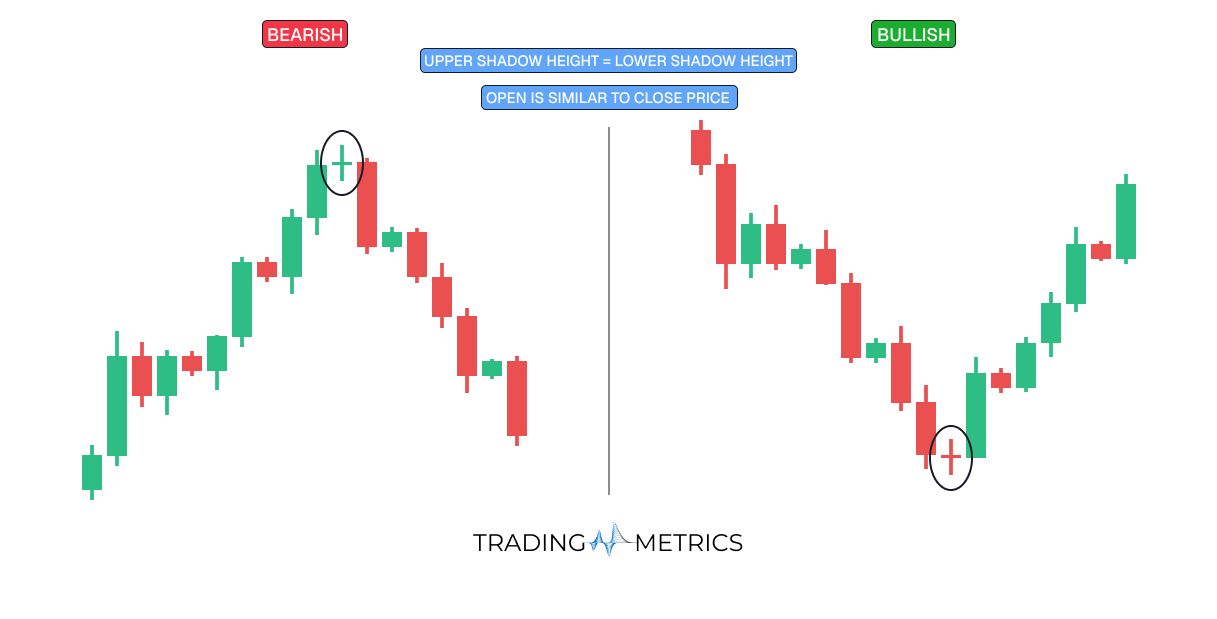
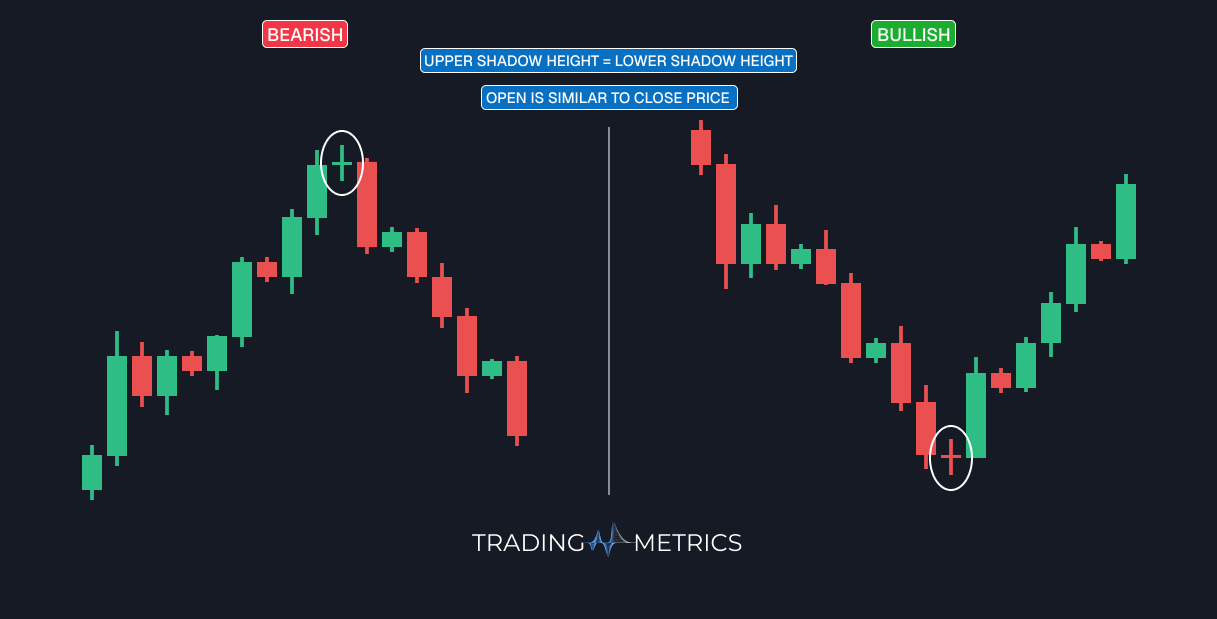
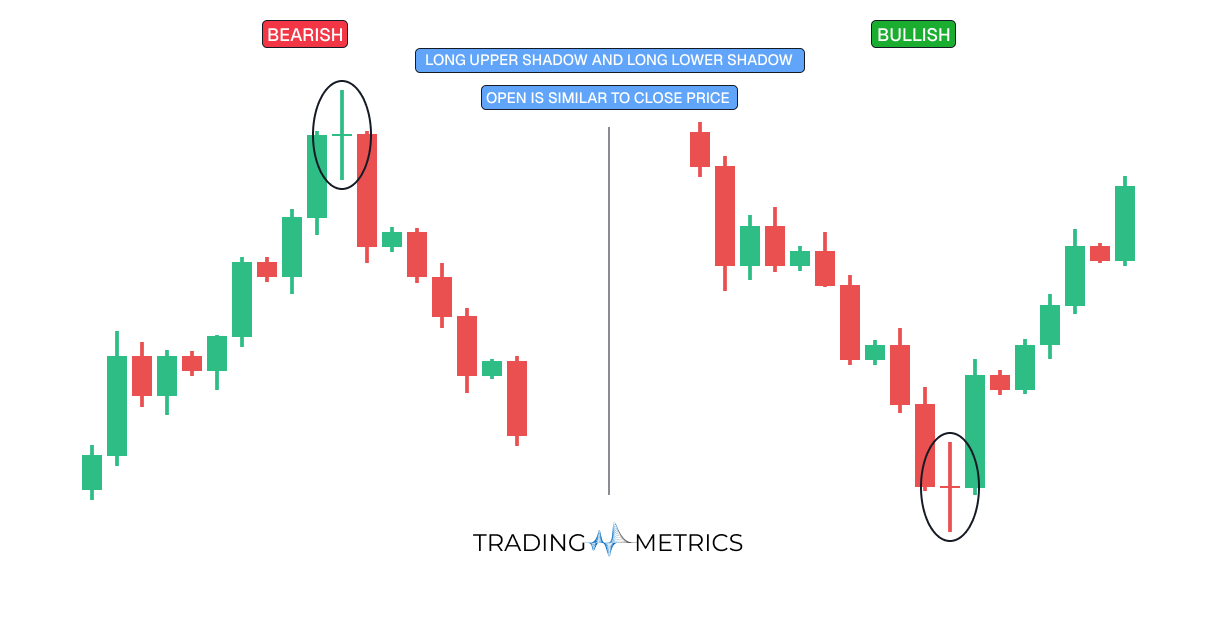
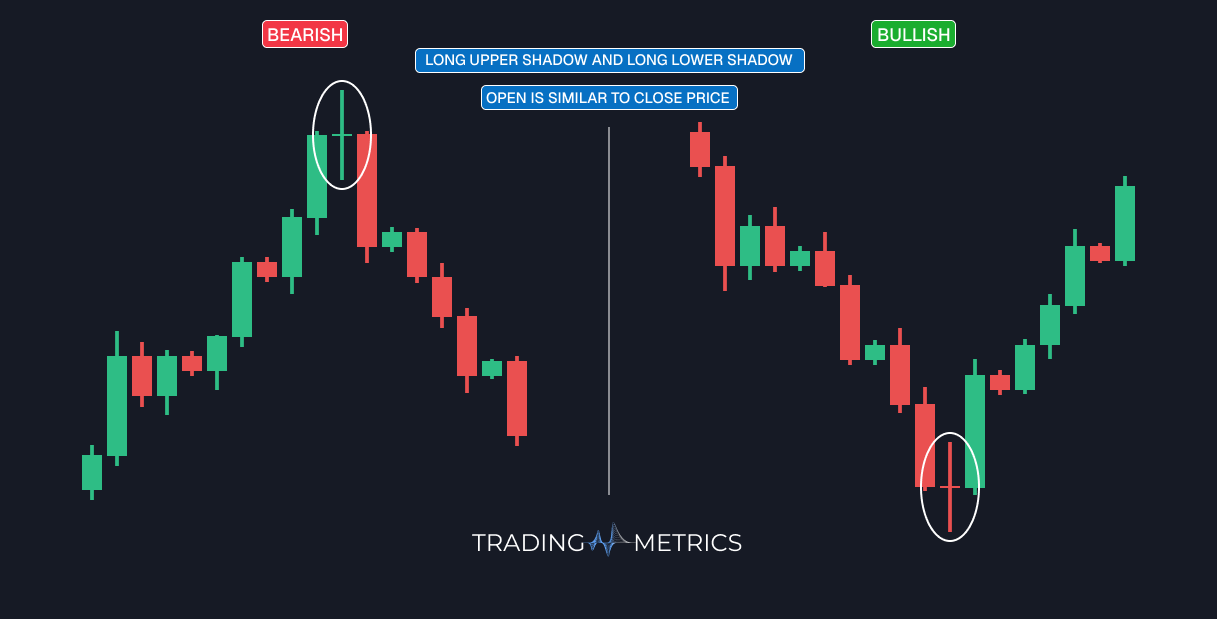
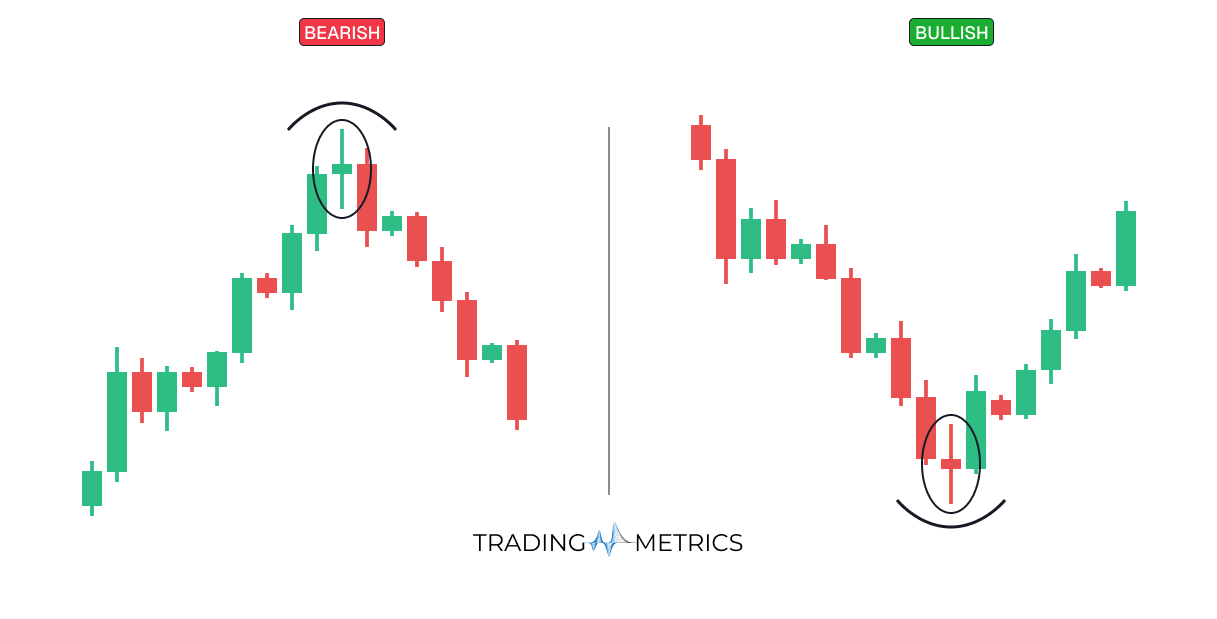
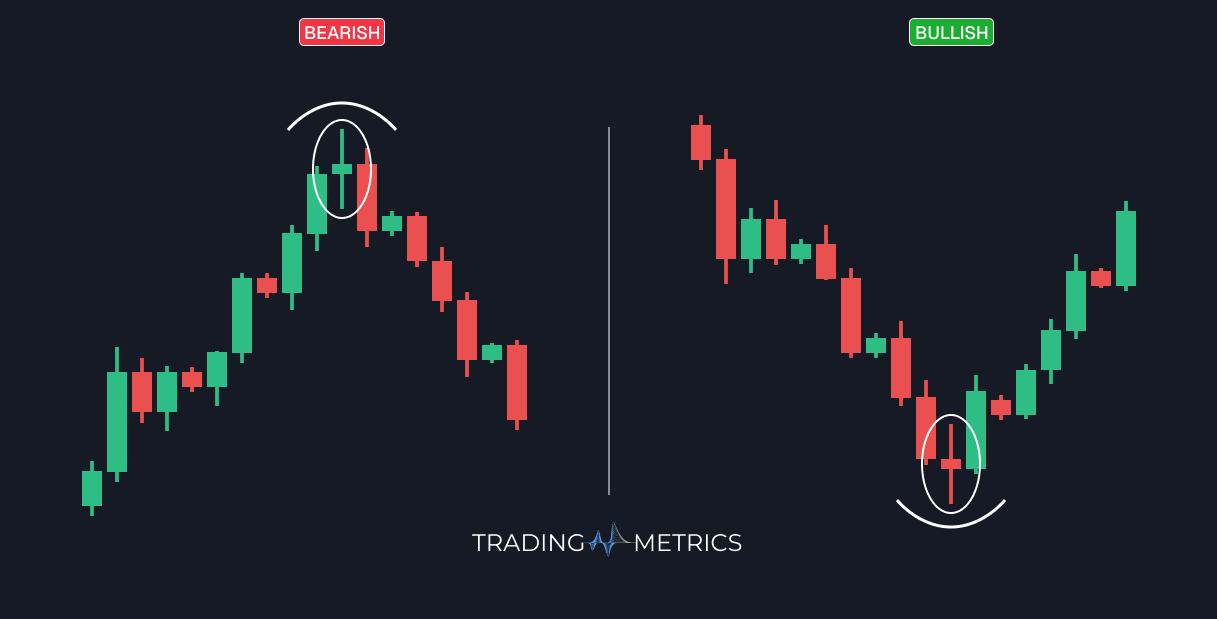
Neutral Candlestick Patterns
Neutral candlestick patterns reflect market indecision, where neither buyers nor sellers hold a clear advantage. These formations often appear during consolidation phases or near significant support and resistance zones. While they don’t strongly signal direction, they can indicate potential breakouts or trend pauses.
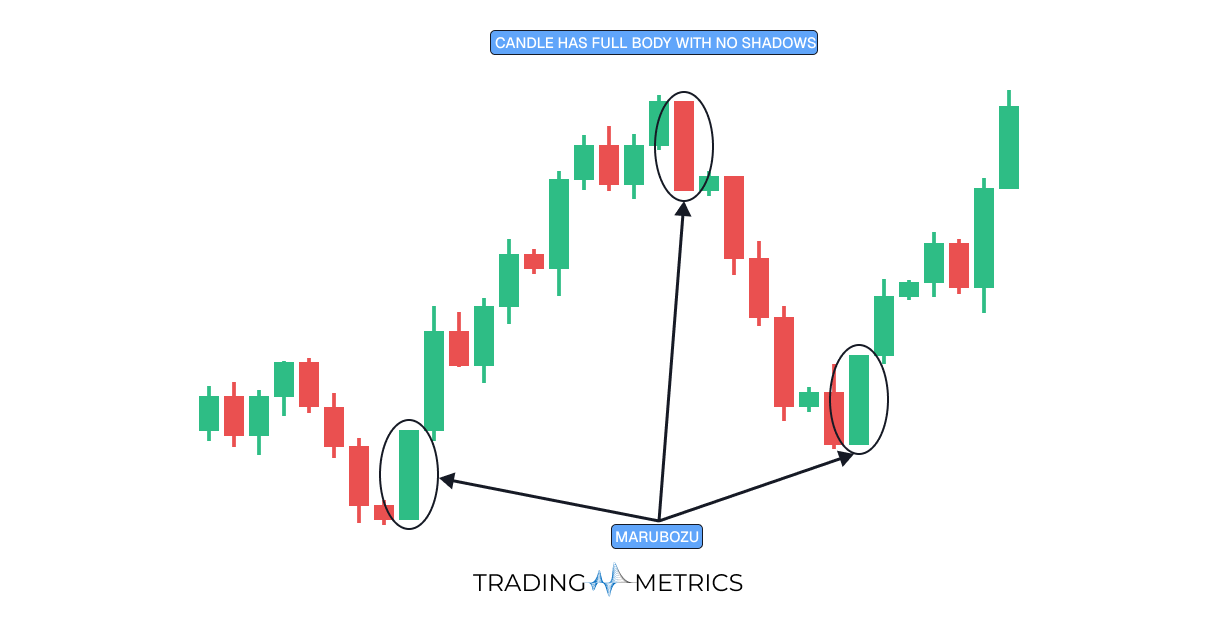
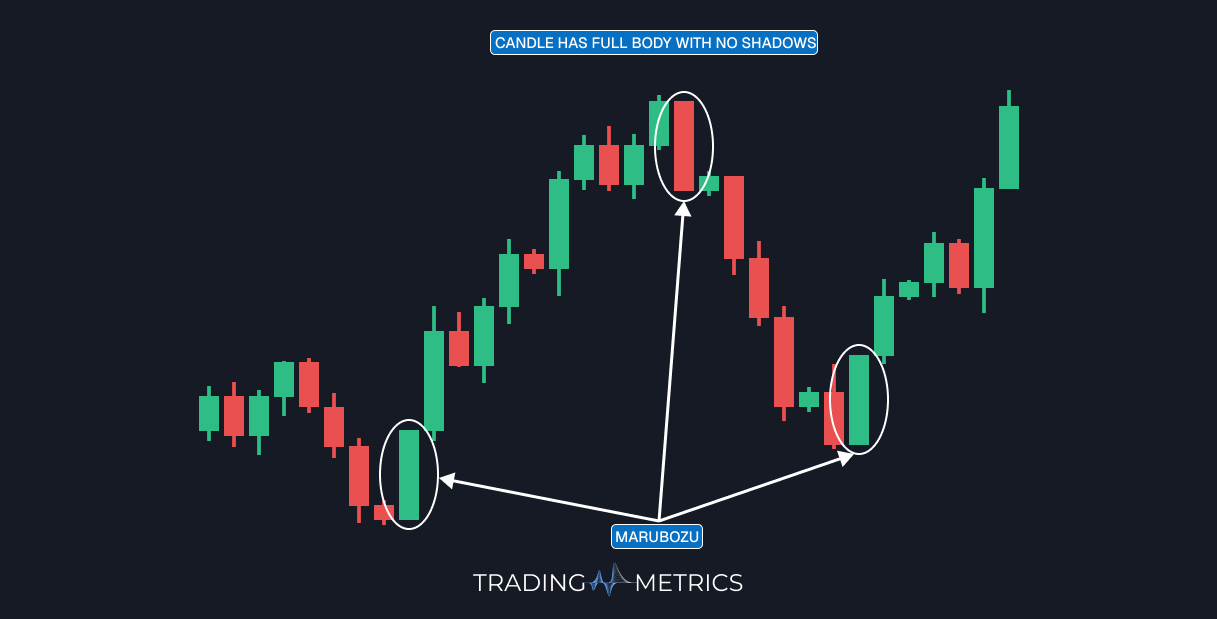
Momentum Candlestick Patterns
Momentum candlestick patterns reveal strong market conviction, where either buyers or sellers dominate price action. These patterns often appear at the start of powerful trends, signaling potential continuation and intensity of movement.
The Marubozu is a prime example of a momentum candlestick pattern. With no shadows (wicks) on either end, it reflects pure buying or selling pressure, suggesting strong directional momentum without hesitation.
Frequently Asked Questions
Quick answers based on this page's topic.
A Doji represents a state of perfect equilibrium where the opening and closing prices are almost identical. It signals that neither buyers nor sellers could gain control, often serving as a warning that the current trend is exhausting and a breakout or reversal is coming.
A Marubozu has little to no wicks, meaning the price opened at one extreme and closed at the other. This signals absolute conviction; a bullish Marubozu shows buyers were in control from the first second to the last, often leading to immediate trend continuation.
The Spinning Top has a small body with long upper and lower wicks, showing that there was significant price movement in both directions but very little actual progress. It warns traders that the market is 'churning' and looking for a new catalyst to define the next directional move.