Dragonfly Doji Pattern: A Long Lower Wick That Signals Reversal
The Dragonfly Doji pattern is a hopeful bullish reversal signal in technical analysis, often landing at the bottom of a downtrend. Picture it as a dragonfly’s graceful hover - a candlestick with a long lower shadow, little to no upper shadow, and an open and close near the high - signaling a lift after a steep decline. When this pattern forms, it’s a buoyant cue that bearish momentum is weakening, offering traders a chance to buy or go long as an uptrend prepares to take flight.
How to Identify the Dragonfly Doji Pattern in Trading
The Dragonfly Doji is a bullish reversal candlestick. It forms after a downtrend when sellers drive the price lower, but buyers pull it back to close near the open. It’s a clear sign of a rejected plunge. Here’s the step-by-step guide.
Start with the Big Picture
This pattern appears after a downtrend. Sellers look dominant, but the Dragonfly Doji shows buyers stepping back in, hinting at a reversal.
Trace the Candle’s Shape
The candlestick features three defining traits:
- Long lower shadow: Shows sellers pushed strongly lower.
- Small or no body: The open and close are at or near the same level.
- Little to no upper shadow: Buyers managed to hold the recovery.
Zero in on the Confirmation Level
The confirmation level is the high of the Dragonfly Doji. A close above this level signals that buyers are reclaiming control.
Watch the Breakout
The bullish trigger comes when the next candle closes above the Dragonfly Doji’s high, often with a strong bullish candle. That’s your entry point. (Some traders wait for added bullish confirmation.)
Check Volume for Additional Confirmation
Volume helps confirm conviction:
- Volume should be elevated during formation and spike on the confirmation candle, validating the reversal signal.
- A surge on the confirming bullish candle reinforces the strength of the reversal.
Rise Hover: Measure the lower shadow height or use nearby resistance levels to project a realistic price target upward from the confirmation close.
How to Trade the Dragonfly Doji Pattern (Trading Example)
To illustrate how the Dragonfly Doji pattern can be used to enter a trade, we will choose the VeChain USDT pair. This reversal setup occurred on the 8-hour chart, indicating a potential bottom during oversold conditions.
Analysis
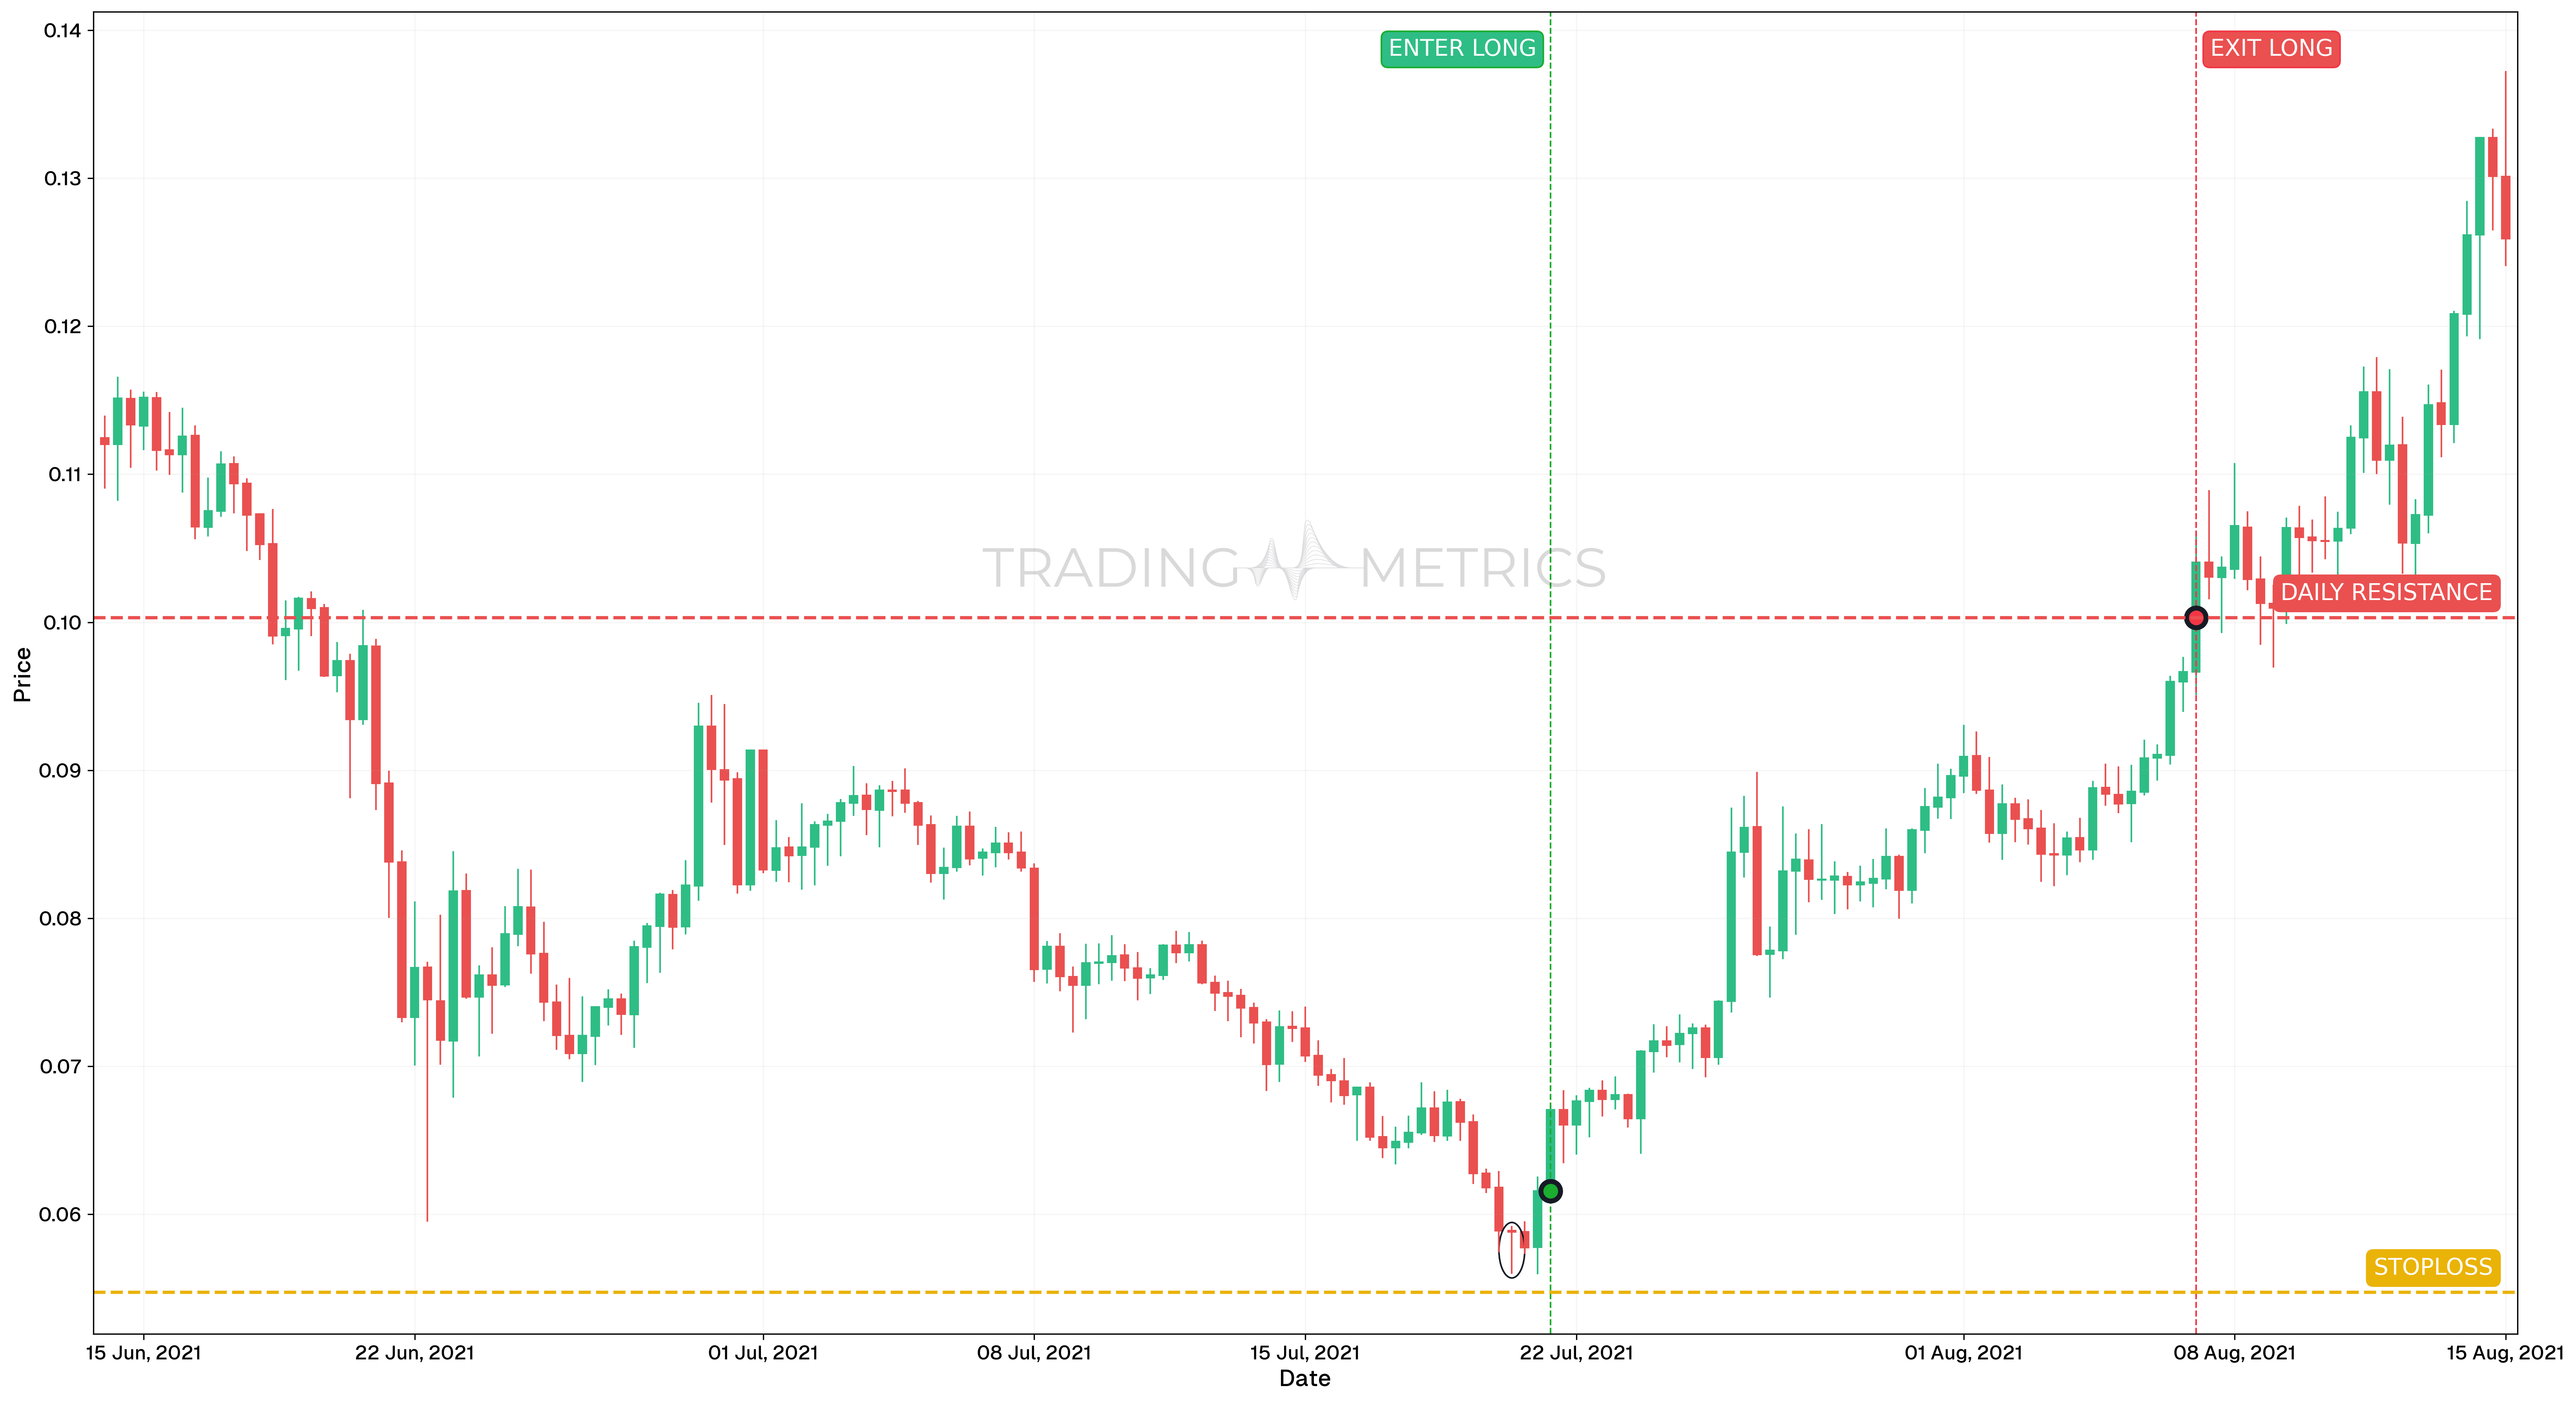
On July 21, 2021, VeChain printed a Dragonfly Doji after a prolonged downtrend. The long lower wick and nearly flat open-close range showed strong buying pressure stepping in near the lows. The context following selling exhaustion made this candle a valid reversal candidate.
Trade Setup
-
Entry: The long was entered on July 21, 2021, at 08:00, at $0.06155, directly after the DragonFly Doji confirmation. Supporting signals included:
-
Exit: The trade was exited on August 7, 2021, at 00:00, at $0.10031, just below a major previous support/resistance level. This area had been structurally important in earlier price action and served as a natural take-profit target.
-
Outcome: The Dragonfly Doji pattern produced a 63% gain, offering a clean and fast-moving reversal with multiple confluences supporting the entry.
Risk Management
- Stop-Loss placement: The stop-loss was placed at $0.05472, just under the Doji’s lower wick and structural low, where pattern failure would be confirmed.
- Position sizing: The position followed a 2% capital risk model, with size determined by the distance between entry and stop-loss.
- Risk-Reward Ratio: The setup delivered a Risk-Reward Ratio of 1:5.67, marking it as a high-quality reversal opportunity.
- Volatility Consideration: The Doji formed following a period of expanding Volatility, which compressed slightly before the reversal. This shift helped define a low-risk zone for re-entry.
- Adaptive Exit Strategy: While this trade closed at key structure, additional upside could have been captured with trailing exits or Fibonacci-based extension targets.
Volume Lift: A volume spike on the Doji day, followed by bullish follow-through, lifts the pattern into a bullish surge.
Pre-Trade Checklist
Lift the Proof: Pair the pattern with volume spikes and indicators like RSI to dodge fakes and boost your odds.
Key Points
- Shadow Clarity: A long lower shadow with a near-zero body boosts reliability - short shadows dilute it.
- Time Frame: Lifts strongest on daily or weekly charts after downtrends.
- Combine with Indicators: Use moving averages or RSI to confirm the reversal.
- Breakout Confirmation: A close above the Doji’s high sets the turn - don’t jump on the Doji alone.
- Price Target: Measure the lower shadow height or use resistance levels for a target above the close.
- Risk Management: Set a stop-loss below the Doji’s low to limit losses if it fails.
Wait for the Lift: Acting before confirmation risks a Doji trap - let the reversal take flight.
Conclusion
The Dragonfly Doji pattern is a trader’s hopeful tool for catching bullish reversals. Its dragonfly hover, paired with volume, RSI, and moving averages, can lift into big gains. Whether in crypto, stocks, or forex, this pattern sharpens your edge. Stay alert, manage your risk, and let the Doji land - that rejected plunge could rise into a winning trade.
Frequently Asked Questions
Quick answers based on this page's topic.
It represents 'Seller Exhaustion' and total rejection of lower prices. Sellers aggressively drove the price lower during the session, but buyers entered with equal or greater force to push it back to the open. This round-trip proves that demand has completely absorbed the available supply.
The difference is the candle body. A Dragonfly Doji has virtually no real body (open and close are identical), indicating extreme indecision. A Hammer has a small real body near the top. Both are bullish reversal signals, but the Doji indicates a more fragile market state.
Yes. While very bullish, it is a single-candle signal. Professional traders wait for the subsequent candle to break and close above the Doji's high. This move confirms that the rejection of lows has successfully transitioned into sustained upward momentum.