Decoding Market Momentum: A Complete Guide to Divergence Concepts
Divergence is a powerful tool in technical analysis that compares price movement with indicator behavior to reveal momentum shifts. It helps traders anticipate trend reversals or continuations before they become obvious on price charts. Divergences are grouped into Regular and Hidden, with each having Bullish and Bearish variations.
How to Use Divergence in Trading
Divergence is not an indicator but it’s a concept. Traders manually analyze price action in comparison with a chosen indicator (like RSI, MACD, or Stochastic Oscillator) to spot moments where momentum and price disagree. This disagreement can reveal early signals of weakening or strengthening trends.
When using divergence, you’re not reading a signal line like with other indicators. Instead, you’re interpreting the relationship between two elements:
- Price Structure: The formation of higher highs, lower lows, or consolidations on the chart.
- Momentum or Indicator Levels: The behavior of a momentum oscillator, which should ideally mirror price action.
If price makes a new high or low but the indicator fails to confirm it, this divergence may suggest that momentum is not supporting the price movement, which could lead to a reversal or continuation.
Identify Clear Swing Points on Price
Start by marking swing highs and swing lows on the price chart. Divergence is best spotted at significant market turning points, not during choppy sideways conditions.
Compare Price with an Oscillator
Look for matching highs or lows on your chosen indicator. If the indicator fails to confirm a price move, this creates a divergence signal.
- A higher high in price but a lower high in the indicator = bearish divergence.
- A lower low in price but a higher low in the indicator = bullish divergence.
Interpret Context
Divergence alone is not a trade signal; it’s a warning or confirmation tool.
- In an uptrend, hidden bullish divergence can validate trend strength.
- In a downtrend, hidden bearish divergence shows sellers remain dominant.
Always analyze divergence in the context of trend and support/resistance zones.
Use as Confirmation, Not Entry
Professional traders rarely trade based solely on divergence. Instead, they use it to:
- Confirm trend exhaustion before entering reversals.
- Validate pullback entries during trends.
- Strengthen confidence in technical setups (like Double Top, triangles, or wedges).
Combine with Market Structure
Pair divergence with price action patterns, volume analysis, or key levels for better results. For example:
- A bearish divergence at major resistance = Stronger reversal probability.
- A hidden bullish divergence at trendline support = Confidence to hold long positions.
Divergence is a visual concept. It requires discretion, practice, and a good understanding of trend structure.
It should never be used as a standalone entry trigger.
Types of Divergence
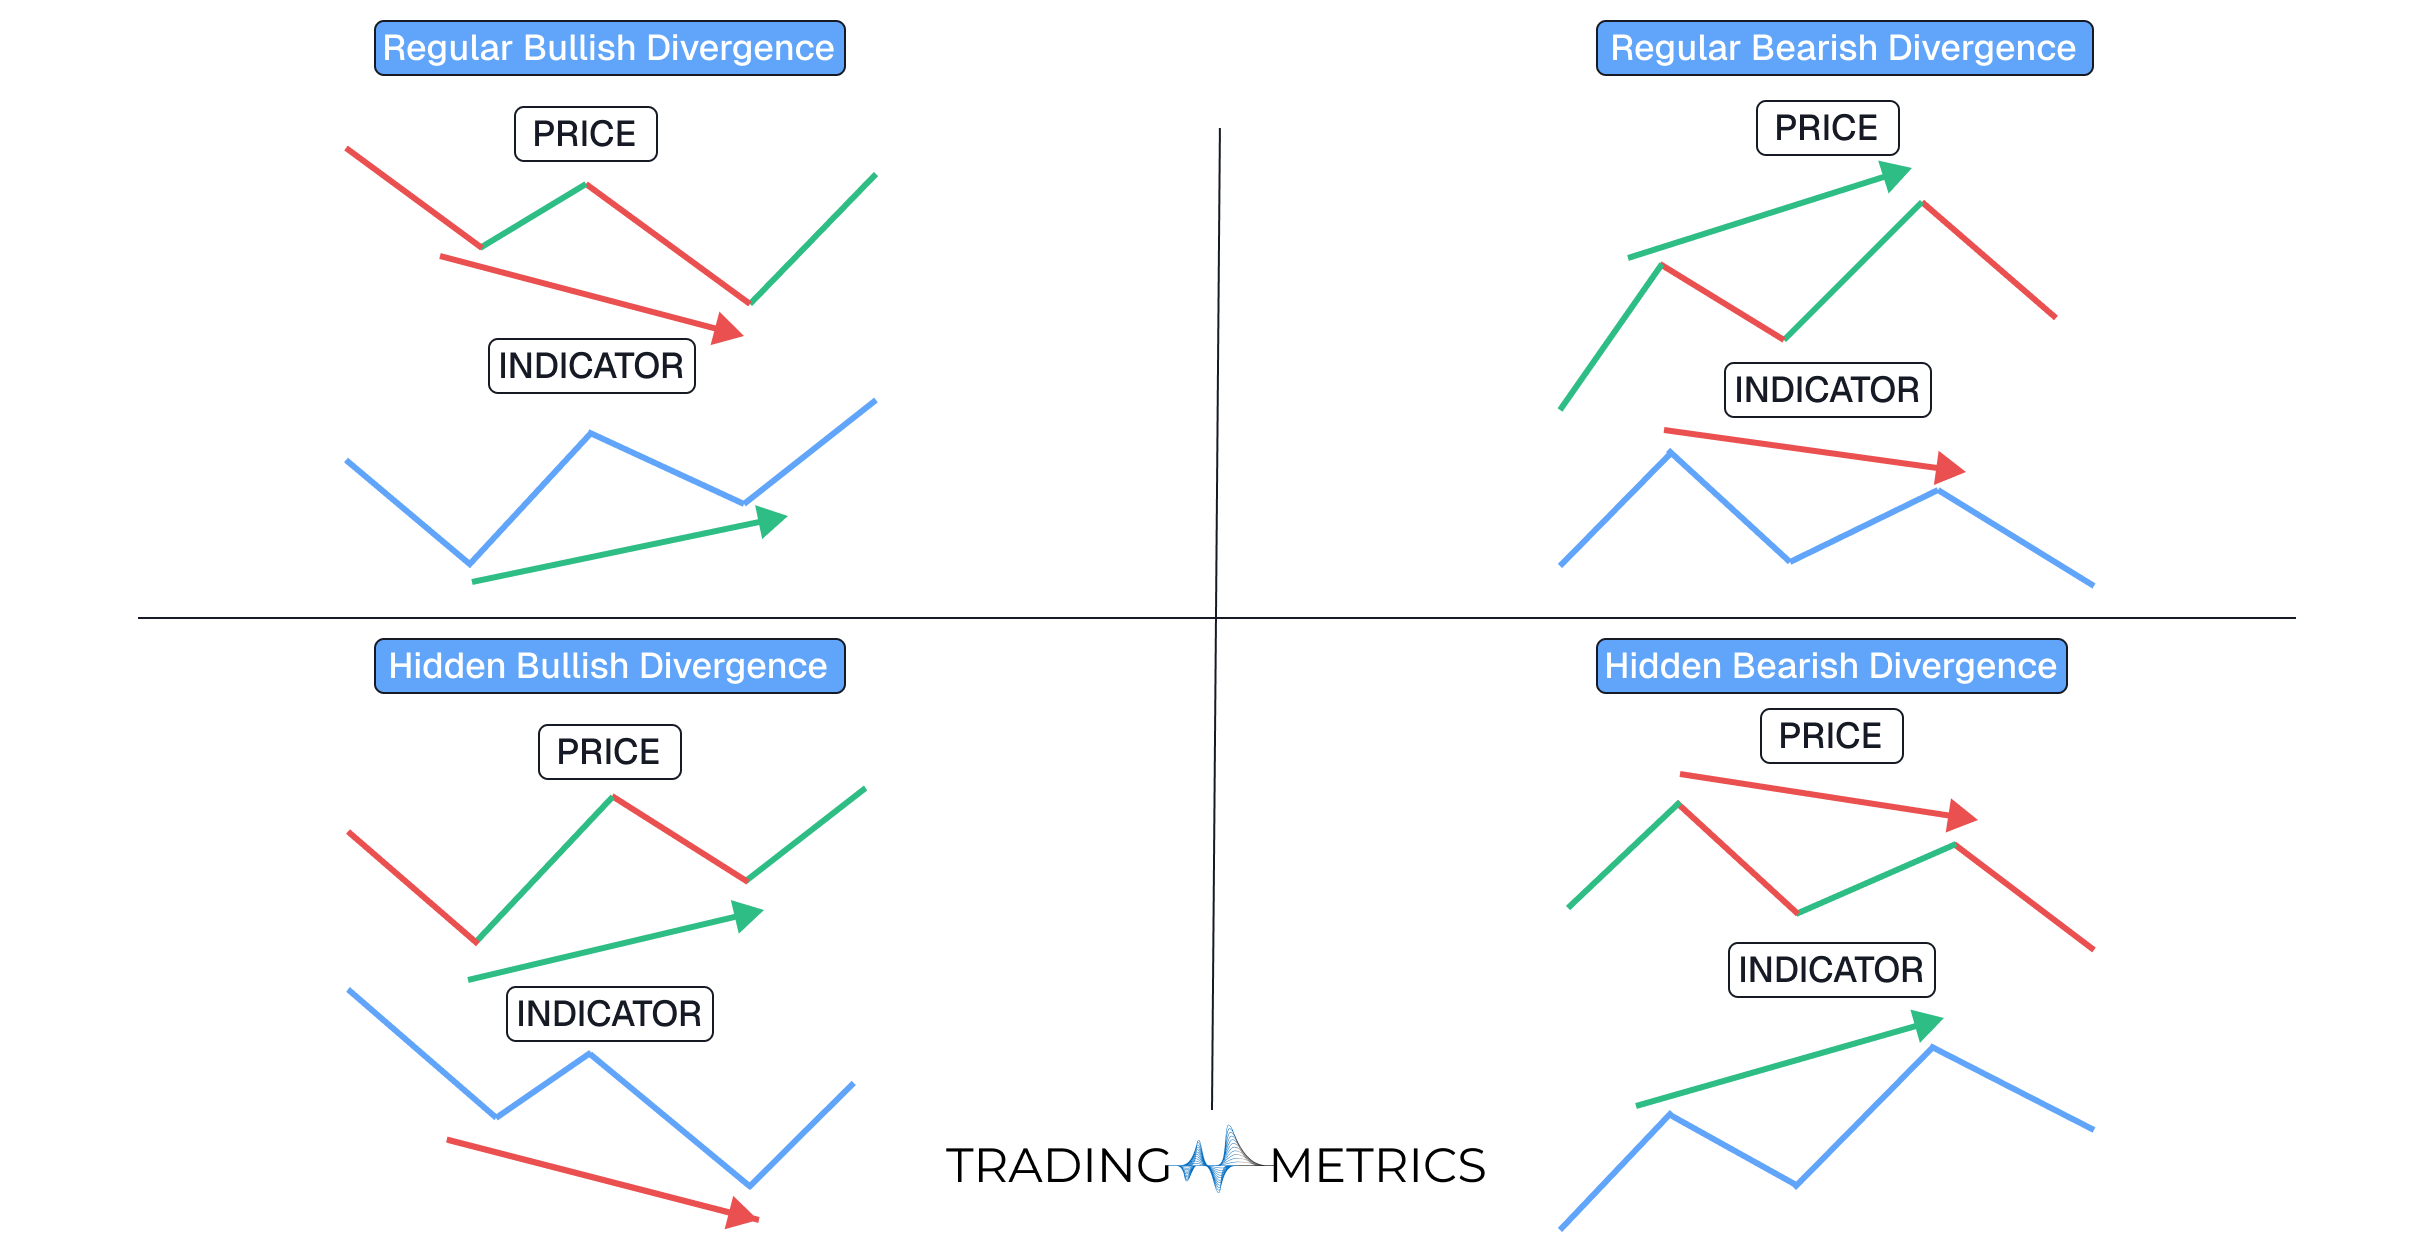
Regular Bullish Divergence
Regular bullish divergence occurs when momentum strengthens even as price declines. This often signals a potential trend reversal to the upside.
- Price: Lower lows
- Indicator: Higher lows
- Signal: Potential reversal to the upside.
Regular Bearish Divergence
Regular bearish divergence happens when price rises but momentum weakens. It often indicates a trend reversal to the downside.
- Price: Higher highs
- Indicator: Lower highs
- Signal: Potential reversal to the downside.
Hidden Bullish Divergence
Hidden bullish divergence suggests that the uptrend is intact, even when momentum temporarily dips. It’s a strong trend continuation signal.
- Price: Higher lows
- Indicator: Lower lows
- Signal: Possible continuation of an uptrend.
Hidden Bearish Divergence
Hidden bearish divergence indicates that a downtrend remains strong despite a momentum spike. This is often a continuation signal for bears.
- Price: Lower highs
- Indicator: Higher highs
- Signal: Possible continuation of a downtrend.
Divergence vs. Price Action
While divergence focuses on momentum signals, price action focuses purely on chart structure. Combining both offers a well-rounded strategy.
Key Takeaways
- Divergence compares Momentum Indicators with price to anticipate market moves.
- Regular Divergence: Predicts reversals.
- Hidden Divergence: Validates continuations.
- Works best in trending markets; less effective in sideways conditions.
- Combine with other tools for confirmation and improved accuracy.
Conclusion
Divergence is not an indicator, but a technical analysis concept that compares price action with Momentum Indicators to reveal shifts in market strength. It helps traders spot potential reversals, confirm trend continuation, and understand when a move is losing steam.
When applied with volume analysis, trend tools, and key price levels, divergence becomes a powerful addition to a trader’s strategy offering context and clarity rather than direct buy/sell signals.
Frequently Asked Questions
Quick answers based on this page's topic.
Regular divergence signals a potential trend reversal, occurring when price and an oscillator move in opposite directions. Hidden divergence, however, signals trend continuation, suggesting that the primary move still has enough underlying strength to resume after a brief consolidation.
Divergence acts as an early warning system because momentum usually shifts before price does. When an indicator fails to reach a new extreme alongside price, it reveals a loss of internal strength, often alerting traders to a trend change before it becomes obvious on the chart.
To increase accuracy, always confirm divergence with price action, such as a trendline break or a candlestick reversal pattern. Divergence on higher timeframes, like the daily or 4-hour chart, is significantly more reliable than signals found on lower intraday timeframes.