Bullish Flag Pattern: Trading the Continuation Setup
The Bullish Flag pattern is a crisp bullish continuation signal in technical analysis, often appearing during an uptrend. Imagine it as a short breather - price consolidating in a small, downward-sloping channel - before resuming its climb. When this pattern takes shape, it’s a quick sign that bullish momentum is still kicking, giving traders a chance to buy or go long as the uptrend powers on.
How to Identify the Bullish Flag Pattern in Trading
The Bullish Flag is a continuation formation. It forms when price pauses briefly after a steep rise, consolidating in a small channel before resuming the uptrend. The setup confirms when price breaks above resistance. Here’s how to spot it:
Start with the Big Picture
This pattern develops during an uptrend. Buyers drive price higher with a strong surge, then the market consolidates in a Bullish Flag before pushing upward again.
Trace the Flagpole and Flag
The Bullish Flag is built from two clear parts. Recognizing both confirms the structure.
- Flagpole: A sharp, steep rally driven by heavy buying.
- Flag: A short consolidation that slopes downward or moves sideways, forming a tight rectangle or parallelogram.
Zero in on the Resistance Line
The resistance line is the upper boundary of the Bullish Flag. Sellers defend it briefly, but once this line breaks, the pattern nears completion.
Watch the Breakout
The bullish trigger comes when price closes above resistance.
- A decisive break over the upper boundary or
- A strong bullish candle
Both confirm continuation of the uptrend and provide the entry.
Check Volume for Additional Confirmation
Volume action adds weight to the breakout.
- Spikes on the flagpole as buyers dominate.
- Drops during the Bullish Flag as activity cools.
- Surges on the breakout, confirming renewed bullish momentum.
Aim Up: Measure the height of the flagpole and project it upward from the break for a realistic price target.
How to Trade the Bullish Flag Pattern (Trading Example)
To illustrate how the Bullish Flag pattern can be used to enter a trade, we will use the BTCUSDT pair on the daily chart. This continuation pattern emerged during a strong uptrend and resolved with a high-momentum breakout.
Analysis
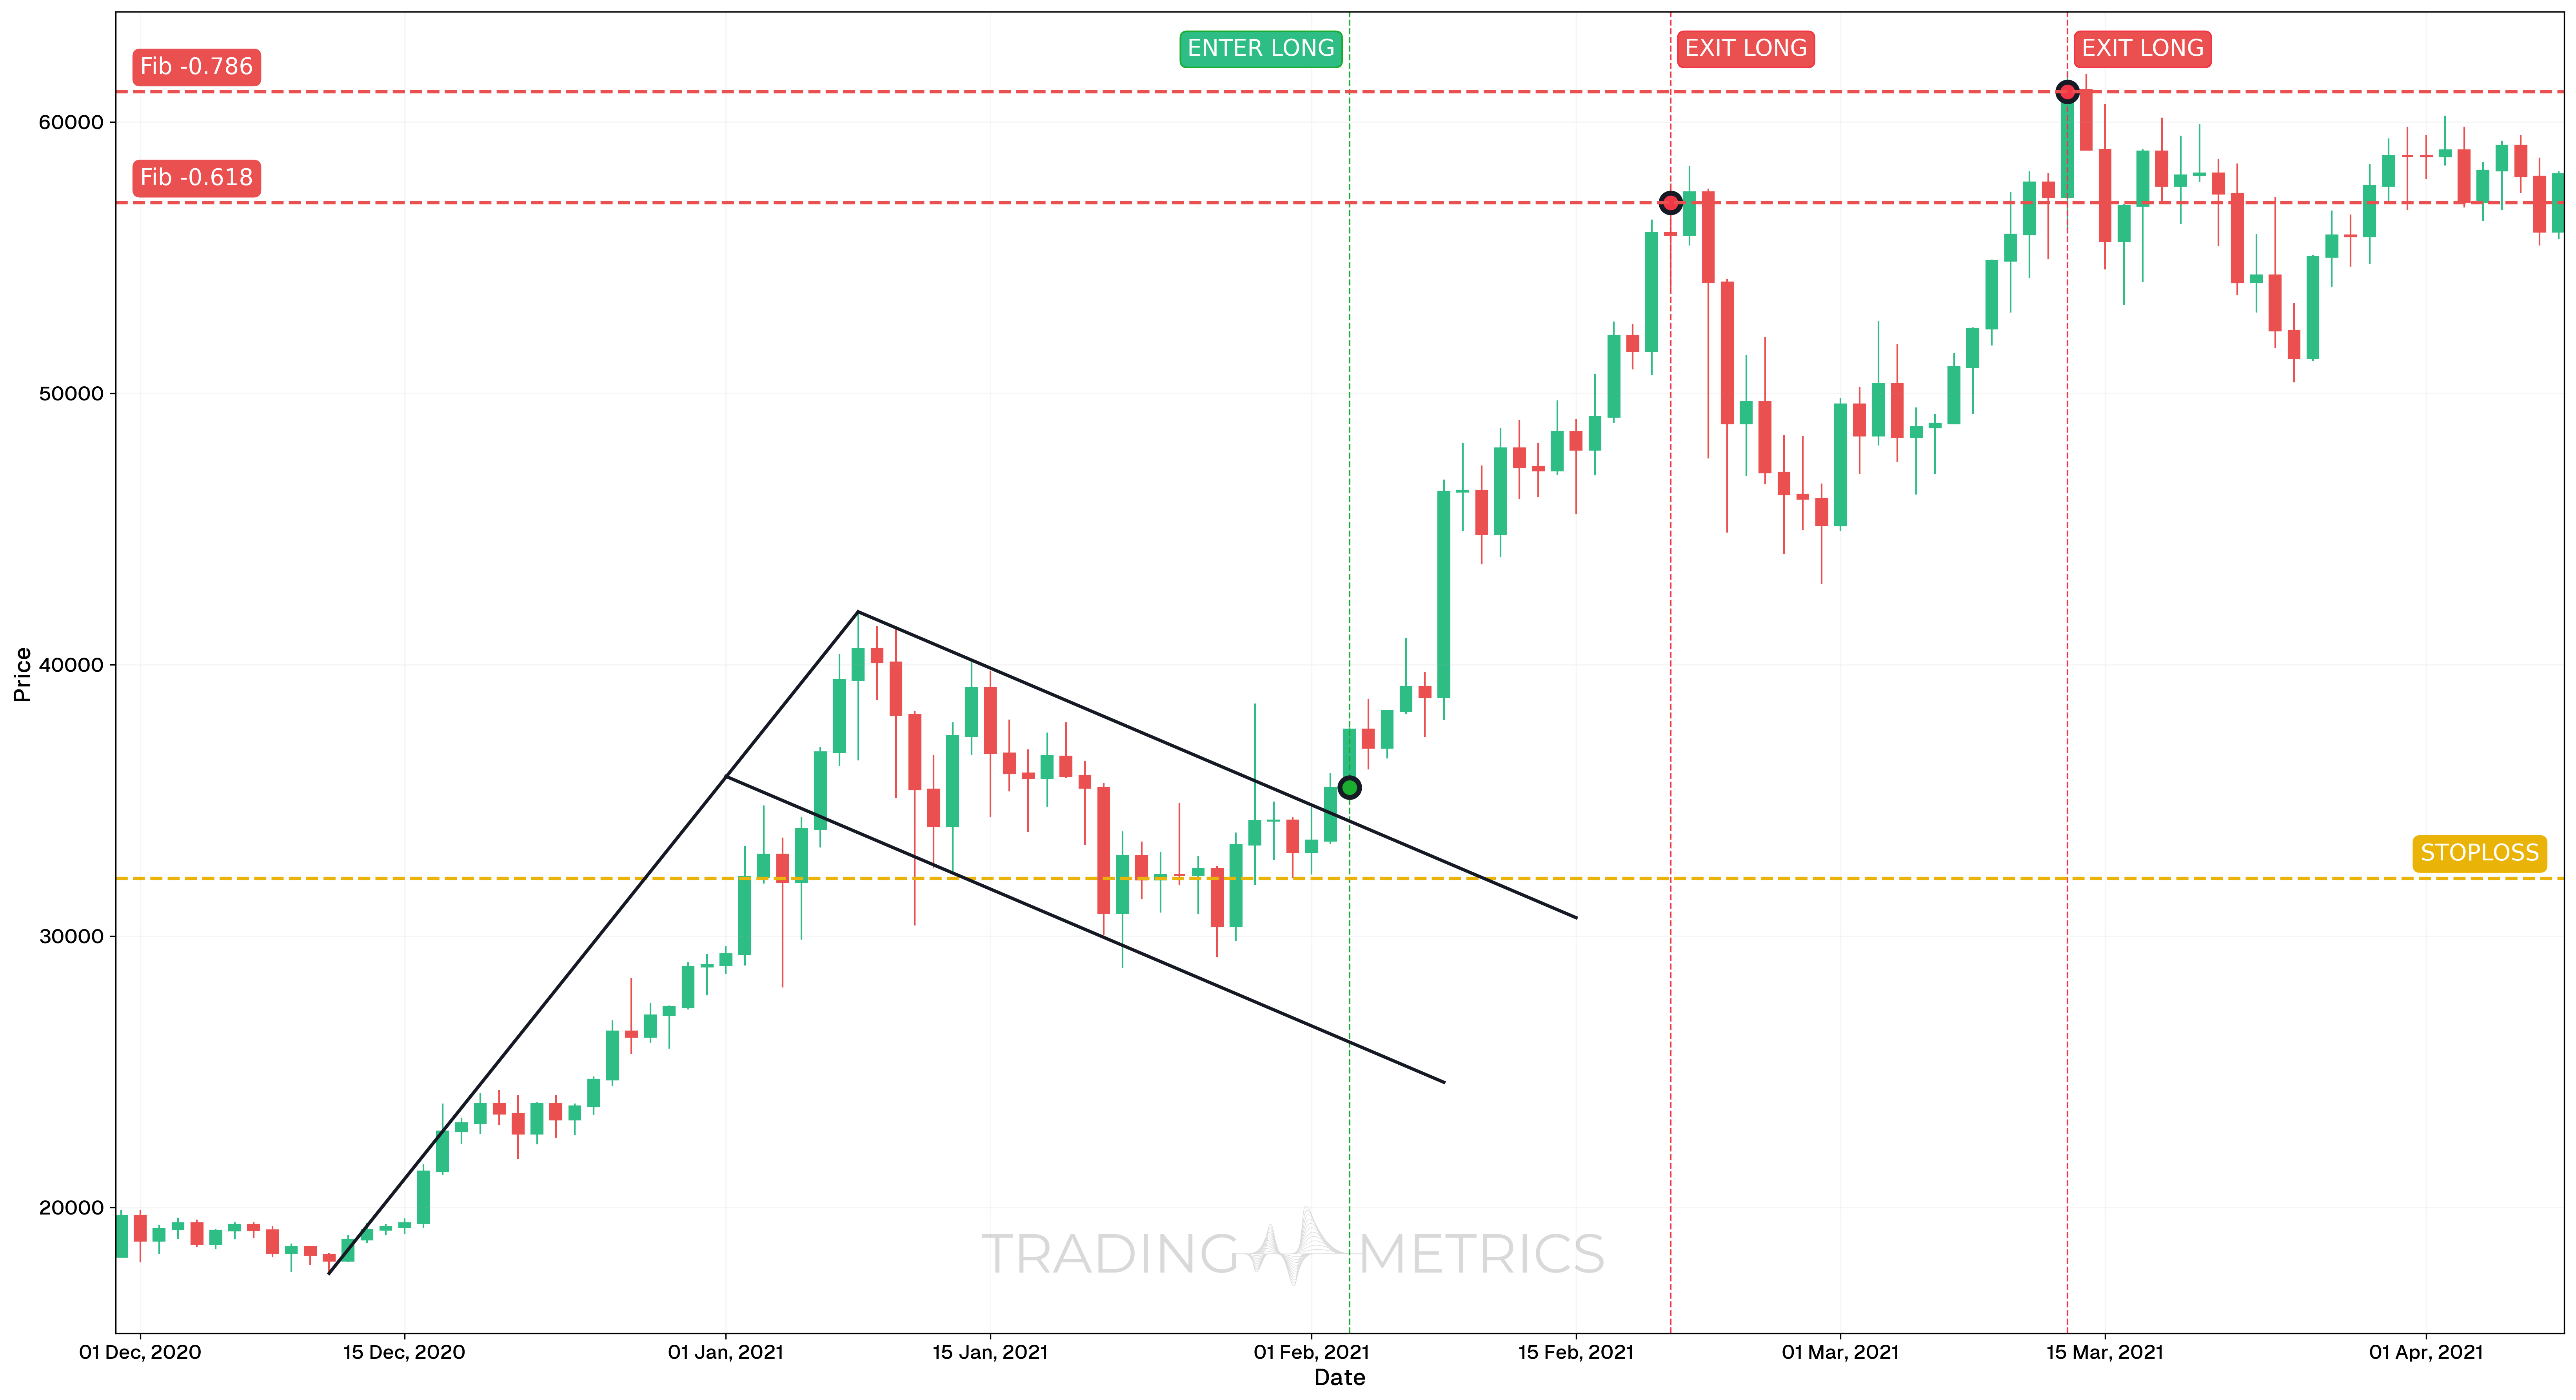
From November 13, 2020 to April 8, 2021, BTCUSDT formed a Bullish Flag after a strong impulsive move. A period of consolidation followed, forming a downward-sloping channel that was eventually broken to the upside, signaling trend continuation.
Trade Setup
-
Entry: The position was entered on February 3, 2021, at $35,472.21, as price broke out above the upper trendline of the Bullish Flag. Entry confirmation included:
-
Exit: The trade was exited in multiple stages based on key Fibonacci Retracement levels from the prior leg, defined on the flagpole of the bullish flag pattern, measured from the low on December 11, 2020 to the high on January 8, 2021.
- February 20, 2021 (TP1): -0.618 Fibonacci extension hit at $57,015.40
- March 13, 2021 (TP2): -0.786 Fibonacci extension hit at $61,110.85
-
Outcome: The Bullish Flag breakout led to a large continuation wave, hitting both Fibonacci extension levels. Entry was confirmed by price structure and momentum indicators.
Risk Management
- Stop-Loss placement: The stop-loss was placed at $32,129.30, just below the entry.
- Position sizing: A 2% capital risk model was used to size the position relative to stop distance.
- Volatility Consideration: The Bullish Flag compressed Volatility before expansion on breakout, allowing a favorable entry with improved risk.
- Risk-Reward Ratio: Not specified due to multiple exits, but strong reward-to-risk potential was achieved based on target hits and structure expansion.
Volume Lift: A volume spike on the resistance break flies the Bullish Flag into a bullish surge.
Pre-Trade Checklist
Flag the Proof: Pair the pattern with volume surges and indicators like RSI to dodge fakes and stack your odds.
Key Points
- Channel Clarity: A tight, downward-sloping Bullish Flag strengthens the signal - messy shapes weaken it.
- Time Frame: Shines on daily or hourly charts in active uptrends.
- Combine with Indicators: Use moving averages or RSI to refine your entry.
- Breakout Confirmation: The resistance break keeps the trend alive - don’t jump too soon.
- Price Target: Measure the flagpole height, project up from the break for your target.
- Risk Management: Set a stop-loss below the Bullish Flag’s low to limit losses if it fails.
Wait for the Rise: Acting before the resistance break risks a flag-waving fakeout - let it soar.
Conclusion
The Bullish Flag pattern is a trader’s quick pick for riding bullish continuations. Its brief pause, paired with volume, RSI, and moving averages, can fuel big climbs. Whether in crypto, stocks, or forex, this pattern sharpens your play. Stay alert, manage your risk, and let the Bullish Flag fly - that short dip could lift into a winning trade.
Frequently Asked Questions
Quick answers based on this page's topic.
The downward slope represents a healthy 'orderly pullback.' It shows early buyers taking profits and new buyers waiting for a better entry price. Because the selling is controlled and lacks high volume, it signals that the broader uptrend remains intact and is simply 'resting.'
To minimize fakeouts, wait for a decisive candle close above the flag's upper resistance line. Many traders also look for a 'retest' of the broken line or a surge in volume to confirm that institutional demand has returned to push the price to new highs.
While the flagpole height is the standard target, it is not guaranteed. Traders should also monitor major resistance levels and use trailing stops to lock in gains. The 1:1 target serves as a primary goal for where the momentum is mathematically 'supposed' to exhaust.