Commodity Channel Index (CCI): Trading Cyclical Extremes
The Commodity Channel Index (CCI) is a versatile technical analysis indicator originally developed by Donald Lambert in 1980. Although its name suggests a focus on commodities, the CCI is widely used in various markets, including stocks and cryptocurrencies. The CCI measures the deviation of the current price from its average price over a specified period. Essentially, it’s a momentum-based oscillator that helps traders identify potential buying and selling opportunities.
In the end, it's not the tool, but how you use it. CCI can help spot momentum, but discipline shapes profit.
- Anonymous
How to Use Commodity Channel Index (CCI)?
The CCI is typically plotted on a scale of -100 to +100, but it can exceed these boundaries. Here’s how traders use it:
Overbought/Oversold Conditions:
- A CCI above +100 indicates that the asset is overbought, suggesting a potential selling opportunity.
- A CCI below -100 indicates that the asset is oversold, suggesting a potential buying opportunity.
Divergences:
- A bullish divergence occurs when the price is making new lows, but the CCI starts rising. This suggests a potential upward reversal.
- A bearish divergence occurs when the price is making new highs, but the CCI starts falling. This suggests a potential downward reversal.
Trend Identification:
- When the CCI is above +100, it signals a strong uptrend.
- When the CCI is below -100, it signals a strong downtrend.
Overbought or Oversold Doesn’t Mean Reverse Immediately: A high CCI (+100 or more) signals strong bullish momentum, while a low CCI (-100 or less) indicates strong bearish momentum. Price may continue in the same direction before reversing.
How to Calculate the Commodity Channel Index (CCI)?
Here is a step-by-step guide to calculating the CCI:
Select a Time Period
Decide the number of periods (e.g., 20, 14) to calculate the CCI. A smaller period results in a more sensitive indicator, while a larger period smoothens fluctuations.
Calculate the Typical Price (TP)
Use the formula:
Find the Simple Moving Average (SMA) of TP
Compute the SMA of the Typical Price over the selected time period.
Determine the Mean Deviation (MD)
Find the average of the absolute differences between each TP and the SMA.
Compute the CCI
Use the formula:
The constant 0.015 normalizes the values, ensuring most readings fall within the range of -100 to 100.
With these steps, you can calculate the CCI and integrate it into your trading strategy for better market insights.
Beware of False Signals in Sideways Markets: CCI is most effective in trending markets. In choppy or range-bound conditions, it can generate unreliable signals, leading to whipsaws.
The Importance of Commodity Channel Index (CCI) in Trading
The CCI is important because it helps traders identify cyclical trends in the market. By highlighting overbought and oversold conditions, the CCI provides signals for potential entry and exit points. This can be particularly useful in volatile markets where quick decision-making is crucial.
Standardized Values and Interpretation
The CCI oscillates around a zero line and is bounded between +100 and -100. These levels help traders identify overbought and oversold conditions:
- Above +100: The asset is considered overbought, which might be a signal to sell.
- Below -100: The asset is considered oversold, which might be a signal to buy.
Bullish momentum trading
Analysis
-
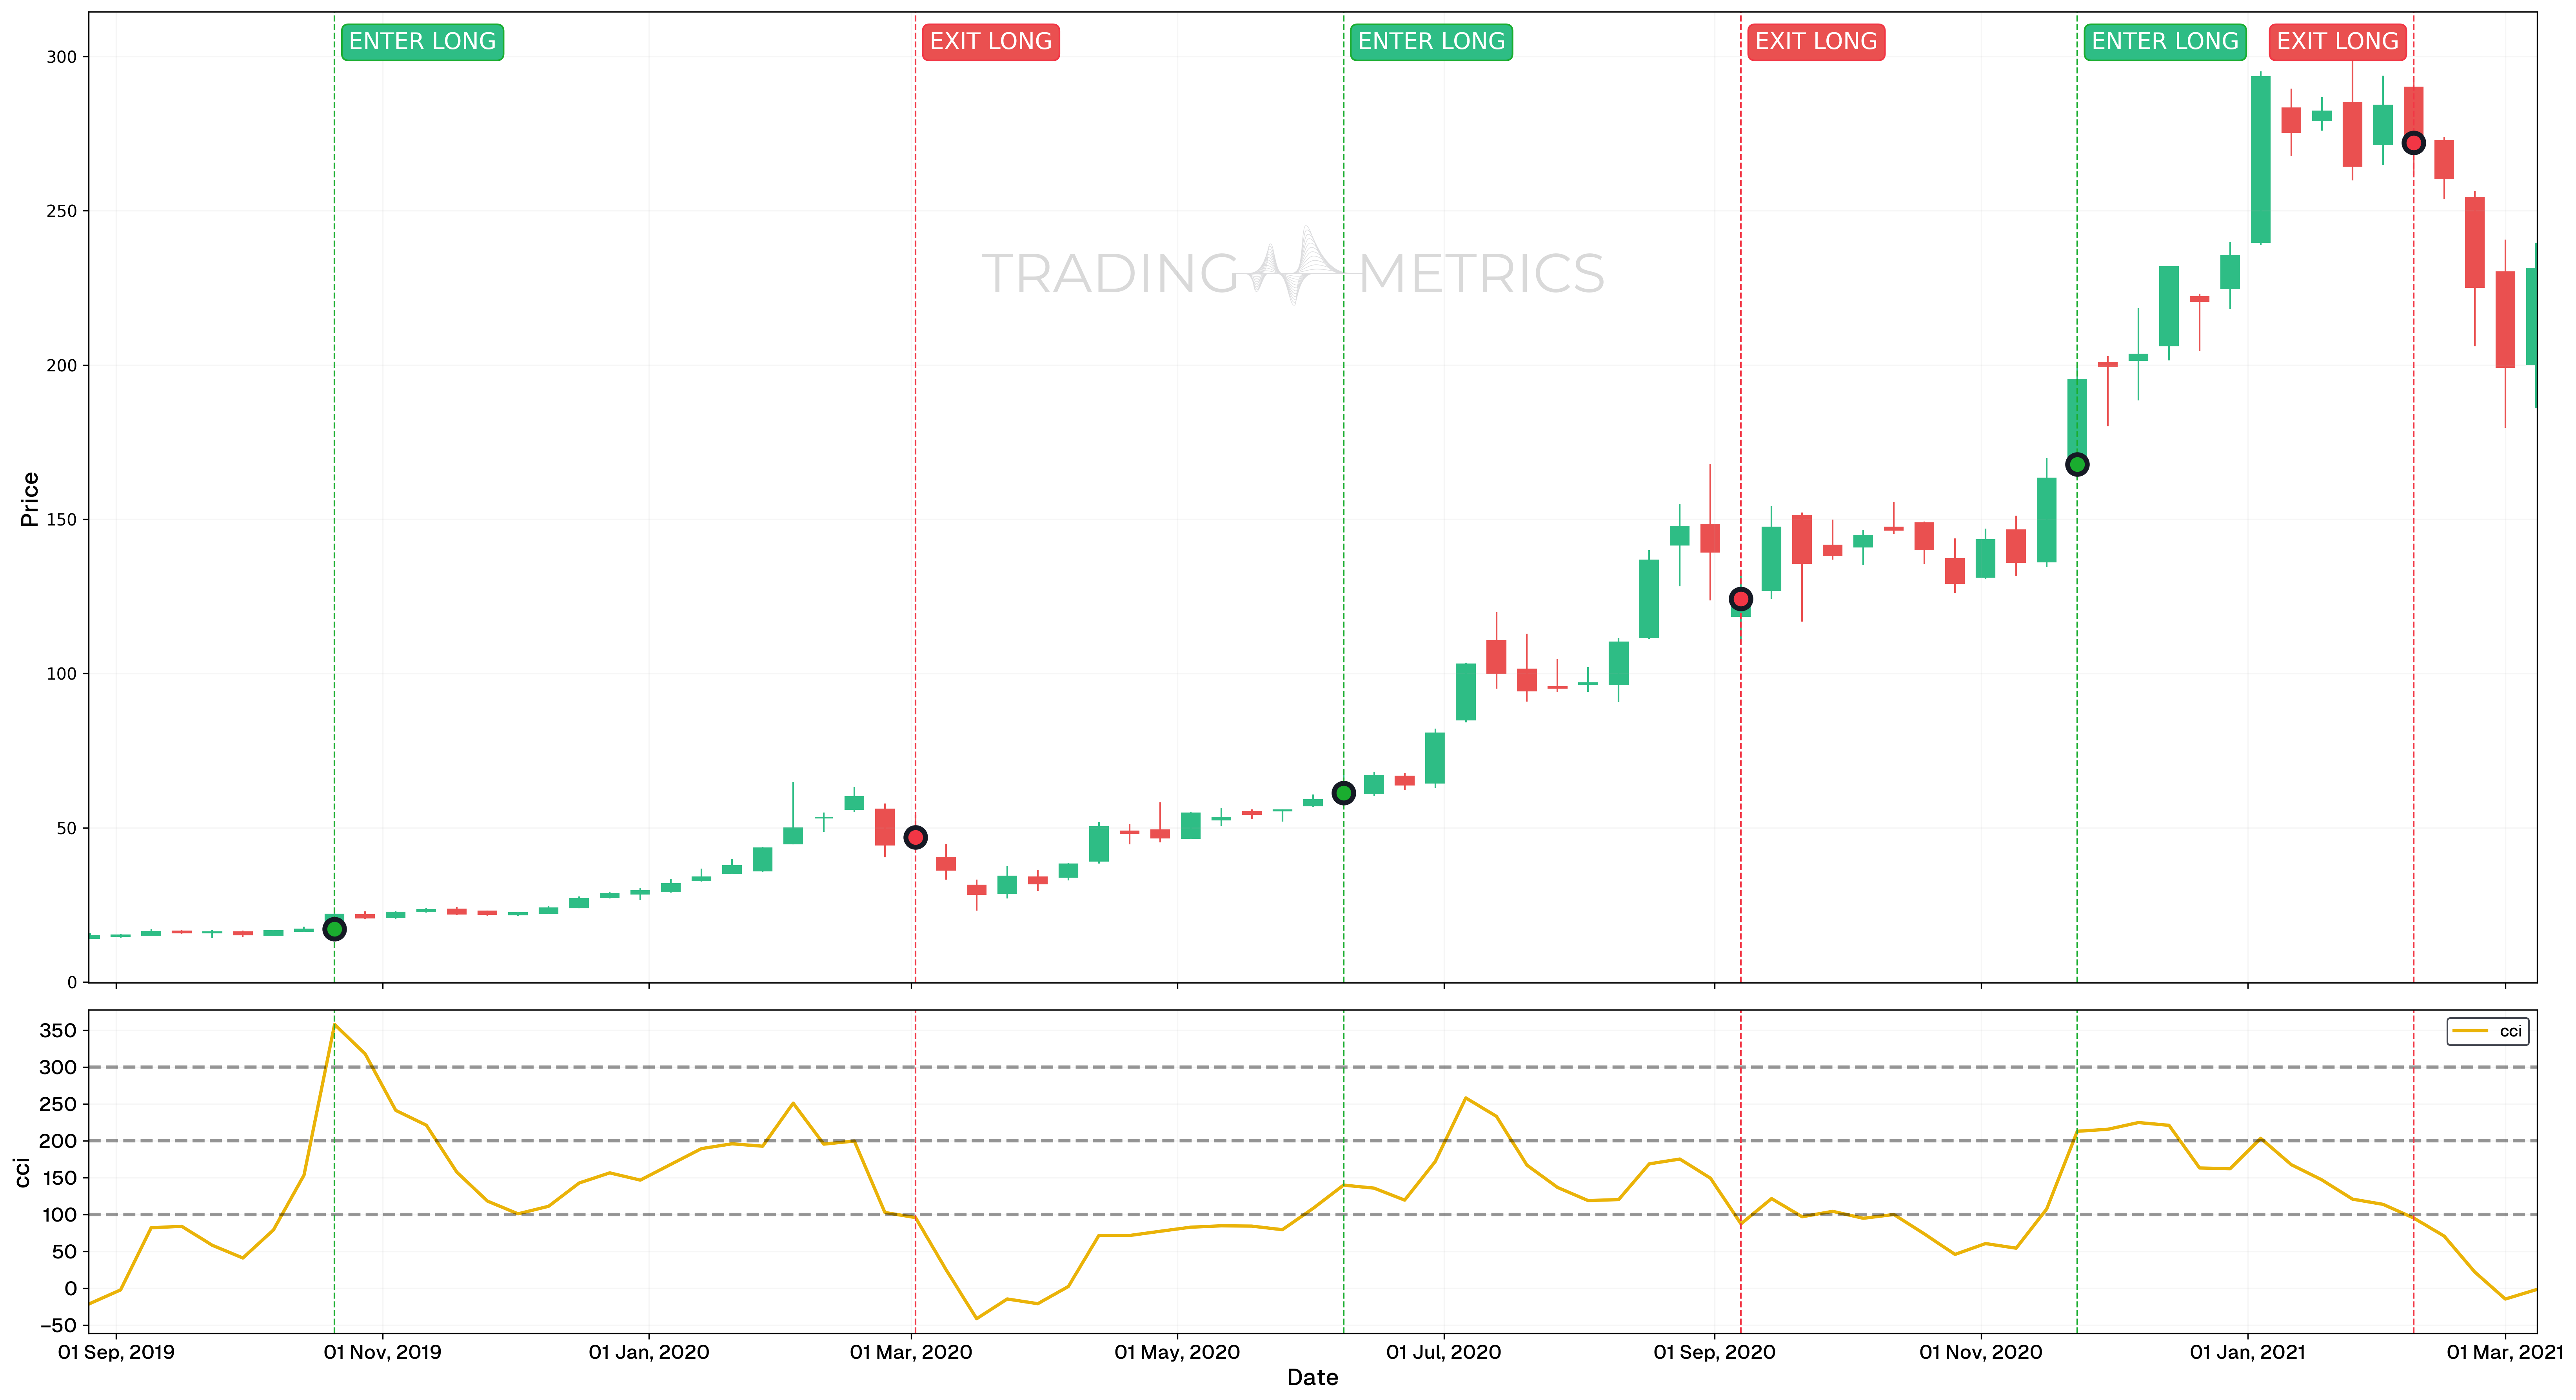
The CCI indicator provided clear buy and sell signals during the analyzed period, allowing traders to capitalize on significant bullish momentum.
-
Buy signals occurred when the CCI line crossed above +100, signaling strong upward momentum and opportunities for long trades.
- 21st October 2019: The first buy signal indicated a strong bullish phase, followed by a substantial price increase.
- 8th June 2020: The second buy signal suggested another potential upward price movement.
- 23th November 2020: The third buy signal highlighted continued bullish momentum.
-
Sell signals occurred when the CCI line dropped from above +100 to below +100, signaling a potential momentum reversal and opportunities to exit trades.
- 2nd March 2020: The first sell signal marked the end of the first profitable trade.
- 8th September 2020: The second sell signal indicated the close of the second trade.
- 8th February 2021: The third sell signal marked the conclusion of the third profitable trade.
Trade Setup
- Entry: Long trades were initiated on 21st October 2019, 1st June 2020, and 23th November 2020, when the CCI line crossed above +100, confirming strong bullish momentum.
- Exit: Trades were exited on 2nd March 2020, 8th September 2020, and 8th February 2021, when the CCI line fell below +100, signaling a momentum reversal.
- Outcome:
- 21st October 2019 (Buy) - 2nd March 2020 (Sell): Approximate profit of 176.89%.
- 8th June 2020 (Buy) - 8th September 2020 (Sell): Approximate profit of 118.19%.
- 23th November 2020 (Buy) - 8th February 2021 (Sell): Approximate profit of 99.57%.
Risk Management
- Stop-Loss Placement: For each trade, stop-loss levels can be strategically placed based on either significant support/resistance zones or Fibonacci Retracement levels.
- Position sizing: Position sizes should be calculated individually for each trade to maintain a maximum risk exposure of 2% of trading capital, ensuring risk consistency across multiple trades.
- Managing Volatility: Given the multiple entry and exit points, it is critical to actively monitor price action and adjust stop-loss levels based on evolving support/resistance zones or updated Fibonacci levels.
- Exit Strategy: Implementing partial exits at key Fibonacci levels or support/resistance zones can help secure gains while allowing for further momentum plays, particularly in trending market conditions.
Conclusion
This analysis demonstrates how the CCI indicator can effectively identify profitable opportunities by signaling entry and exit points aligned with shifts in momentum.
- Versatility: CCI can be applied to any market, including stocks, commodities, and cryptocurrencies.
- Identifying Cycles: It helps in identifying cyclical trends, which is particularly useful in markets with repetitive patterns.
- Overbought/Oversold Conditions: Provides clear signals for potential buying or selling opportunities based on overbought or oversold conditions.
- Divergences: Helps in spotting divergences between the indicator and price action, which can indicate potential reversals.
Bearish momentum trading
Analysis
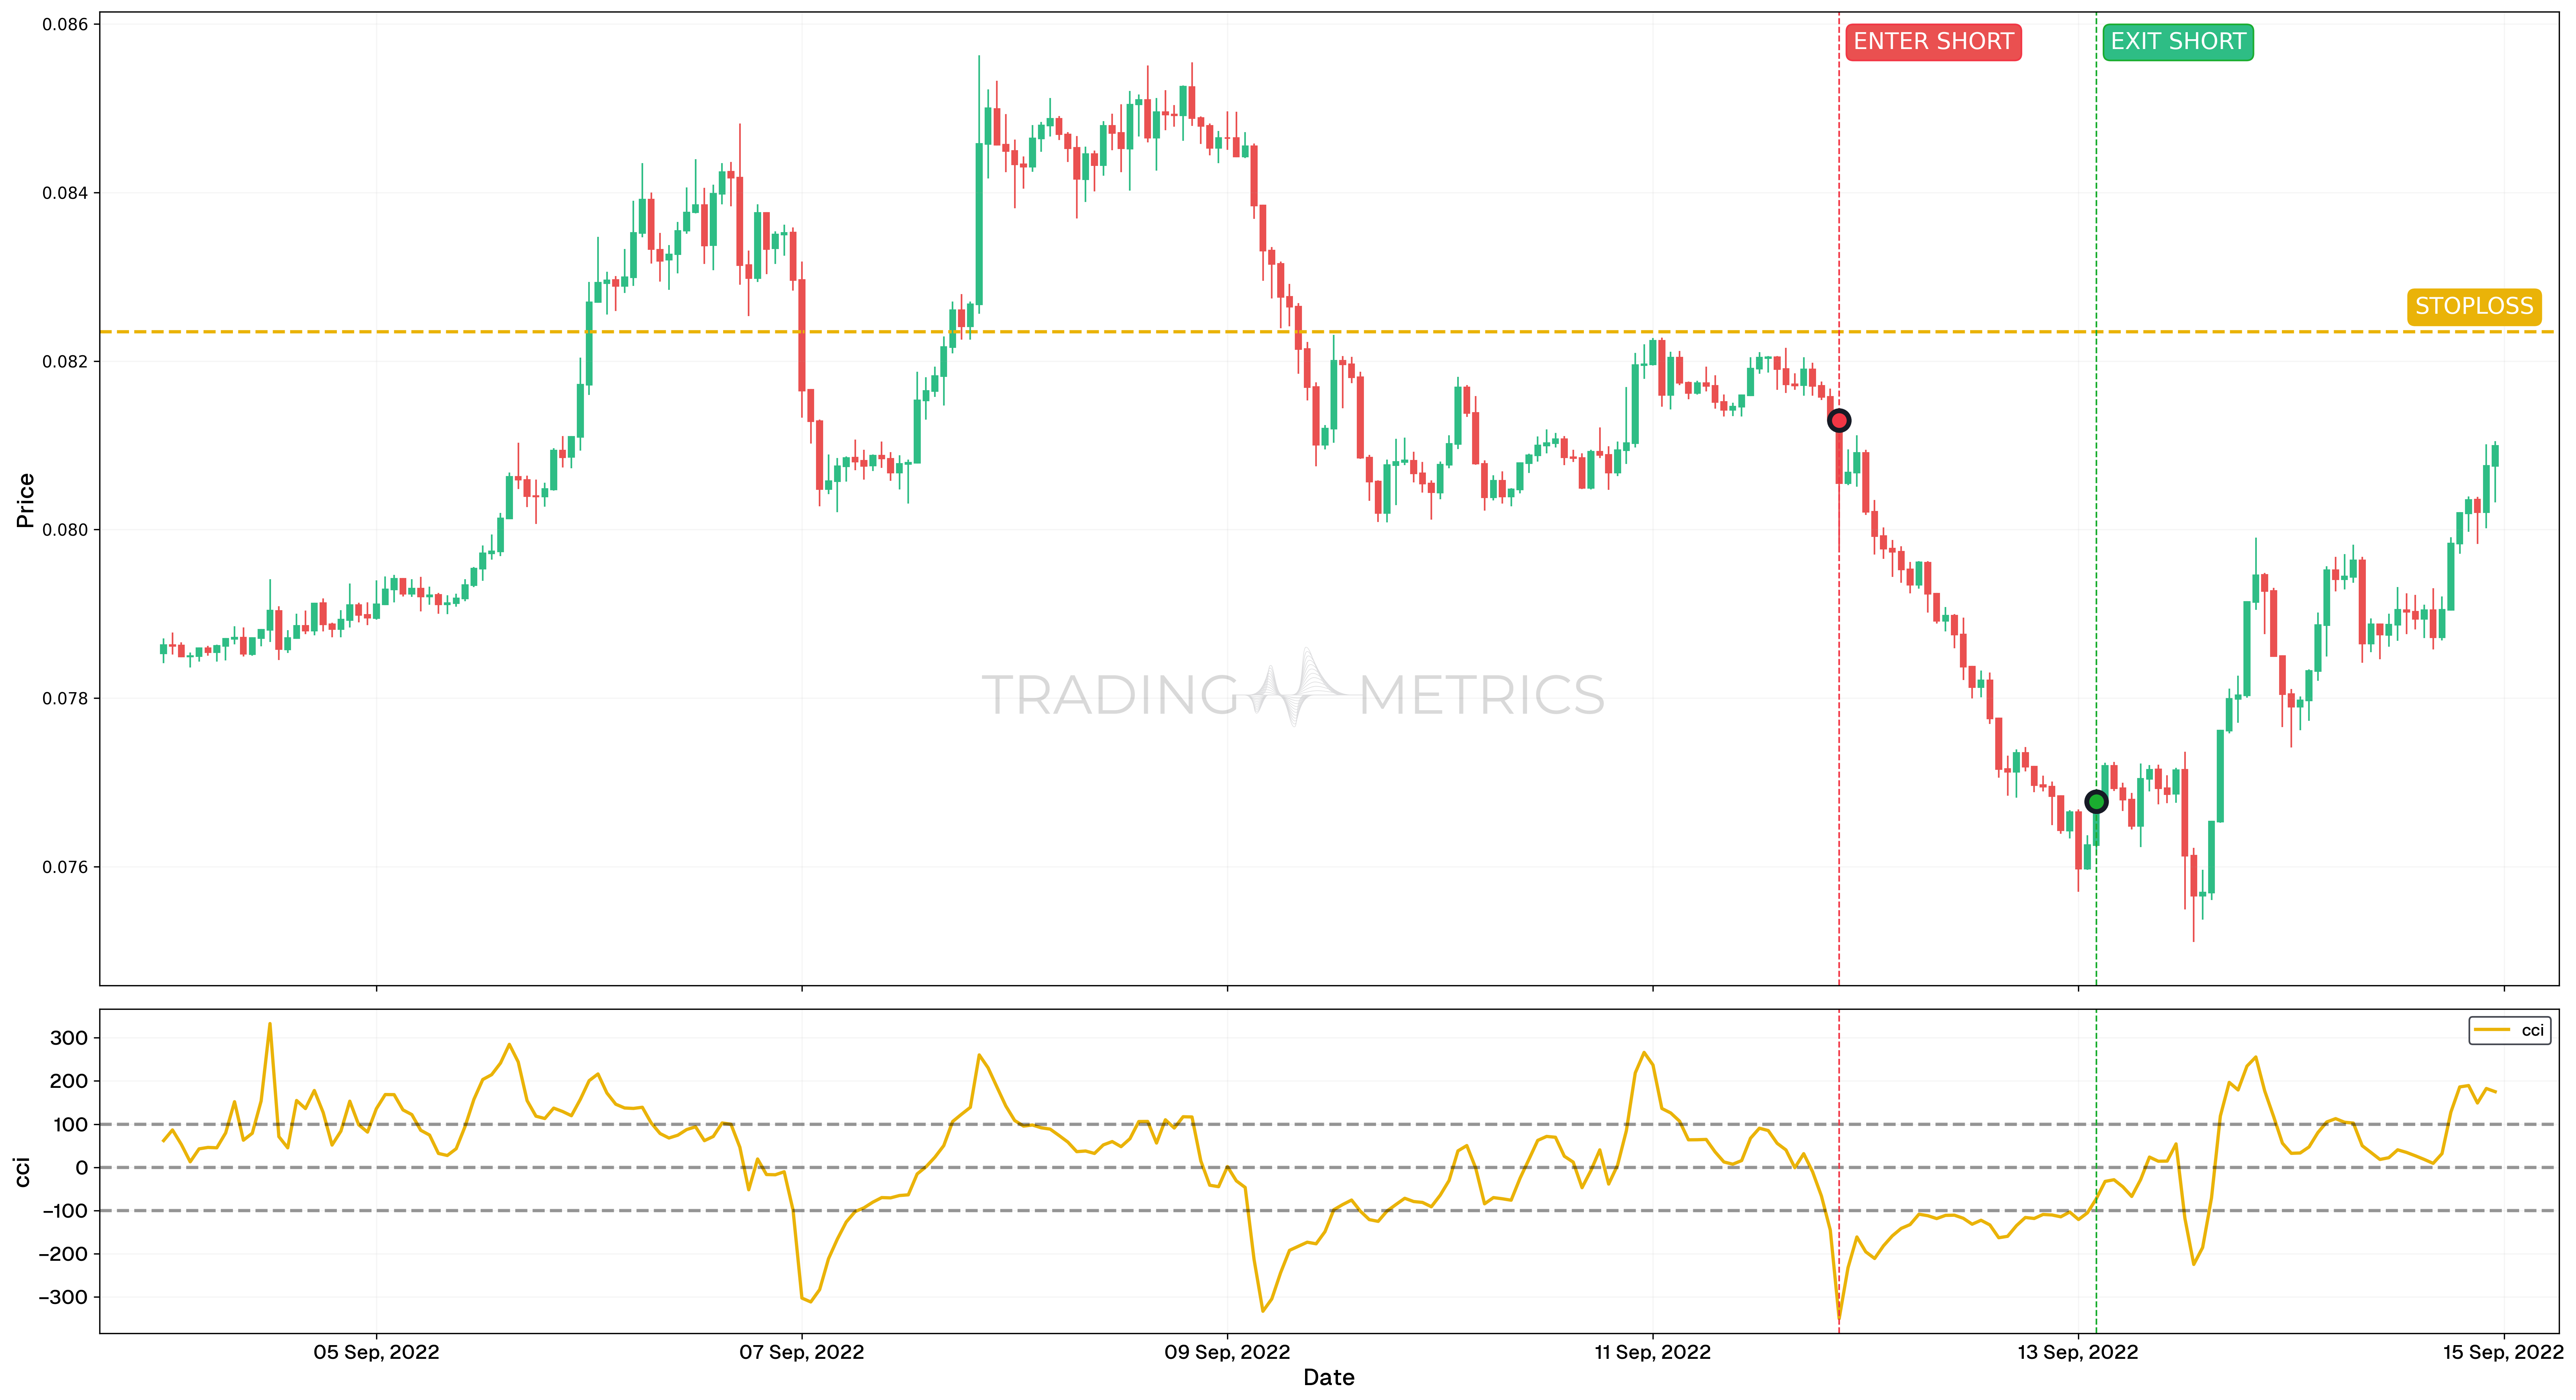
- The CCI indicator provided a clear signal for a short trade during the analyzed period, highlighting a period of strong bearish momentum.
- Short Entry: On 11th September 2022, 21:00, the CCI line crossed below -100, signaling strong bearish momentum and the initiation of a short position.
- Short Exit: On 13th September 2022, 02:00, the CCI line crossed back above -100, indicating the end of the bearish phase and signaling the closure of the short position.
Trade Setup
- Entry: A short position was entered on 11th September 2022, 21:00, as the CCI line crossed below -100, confirming a strong downward momentum.
- Exit: The trade was closed on 13th September 2022, 02:00, when the CCI line rose back above -100, signaling the cessation of bearish momentum.
- Outcome: The trade captured a 5.57% price decline, successfully leveraging the bearish signal provided by the CCI indicator.
Risk Management
- Stop-Loss Placement: The stop-loss was strategically set at 0.08235, a significant previous support/resistance point, allowing for adequate risk mitigation while aligning with the overall trade structure.
- Position sizing: Position size was calculated to ensure a maximum risk exposure of 2% of trading capital, maintaining a consistent risk management approach.
- Risk-Reward Analysis: The trade setup adhered to a 1:4.28 Risk-Reward Ratio, maintaining balance between potential reward and defined risk based on the identified support/resistance levels.
- Managing Volatility: Given the short time frame and potential for rapid price movements, the stop-loss was actively monitored and adjusted to lock in gains while protecting against sudden reversals.
- Exit Strategy: Implementing partial exits at critical support/resistance zones can help secure profits while allowing for continued price action in alignment with bearish momentum signals.
Conclusion
This example highlights the effectiveness of using the CCI indicator to identify short trade opportunities, capitalizing on momentum shifts for profitable outcomes.
- False Signals: Like any technical indicator, CCI can produce false signals, particularly in ranging or choppy markets.
- Lagging Indicator: As a momentum oscillator, it can sometimes lag behind the price, leading to delayed signals.
- Needs Confirmation: It’s best used in conjunction with other indicators for confirmation, as relying solely on CCI can lead to incorrect trading decisions.
Overbought vs Oversold positions
Analysis
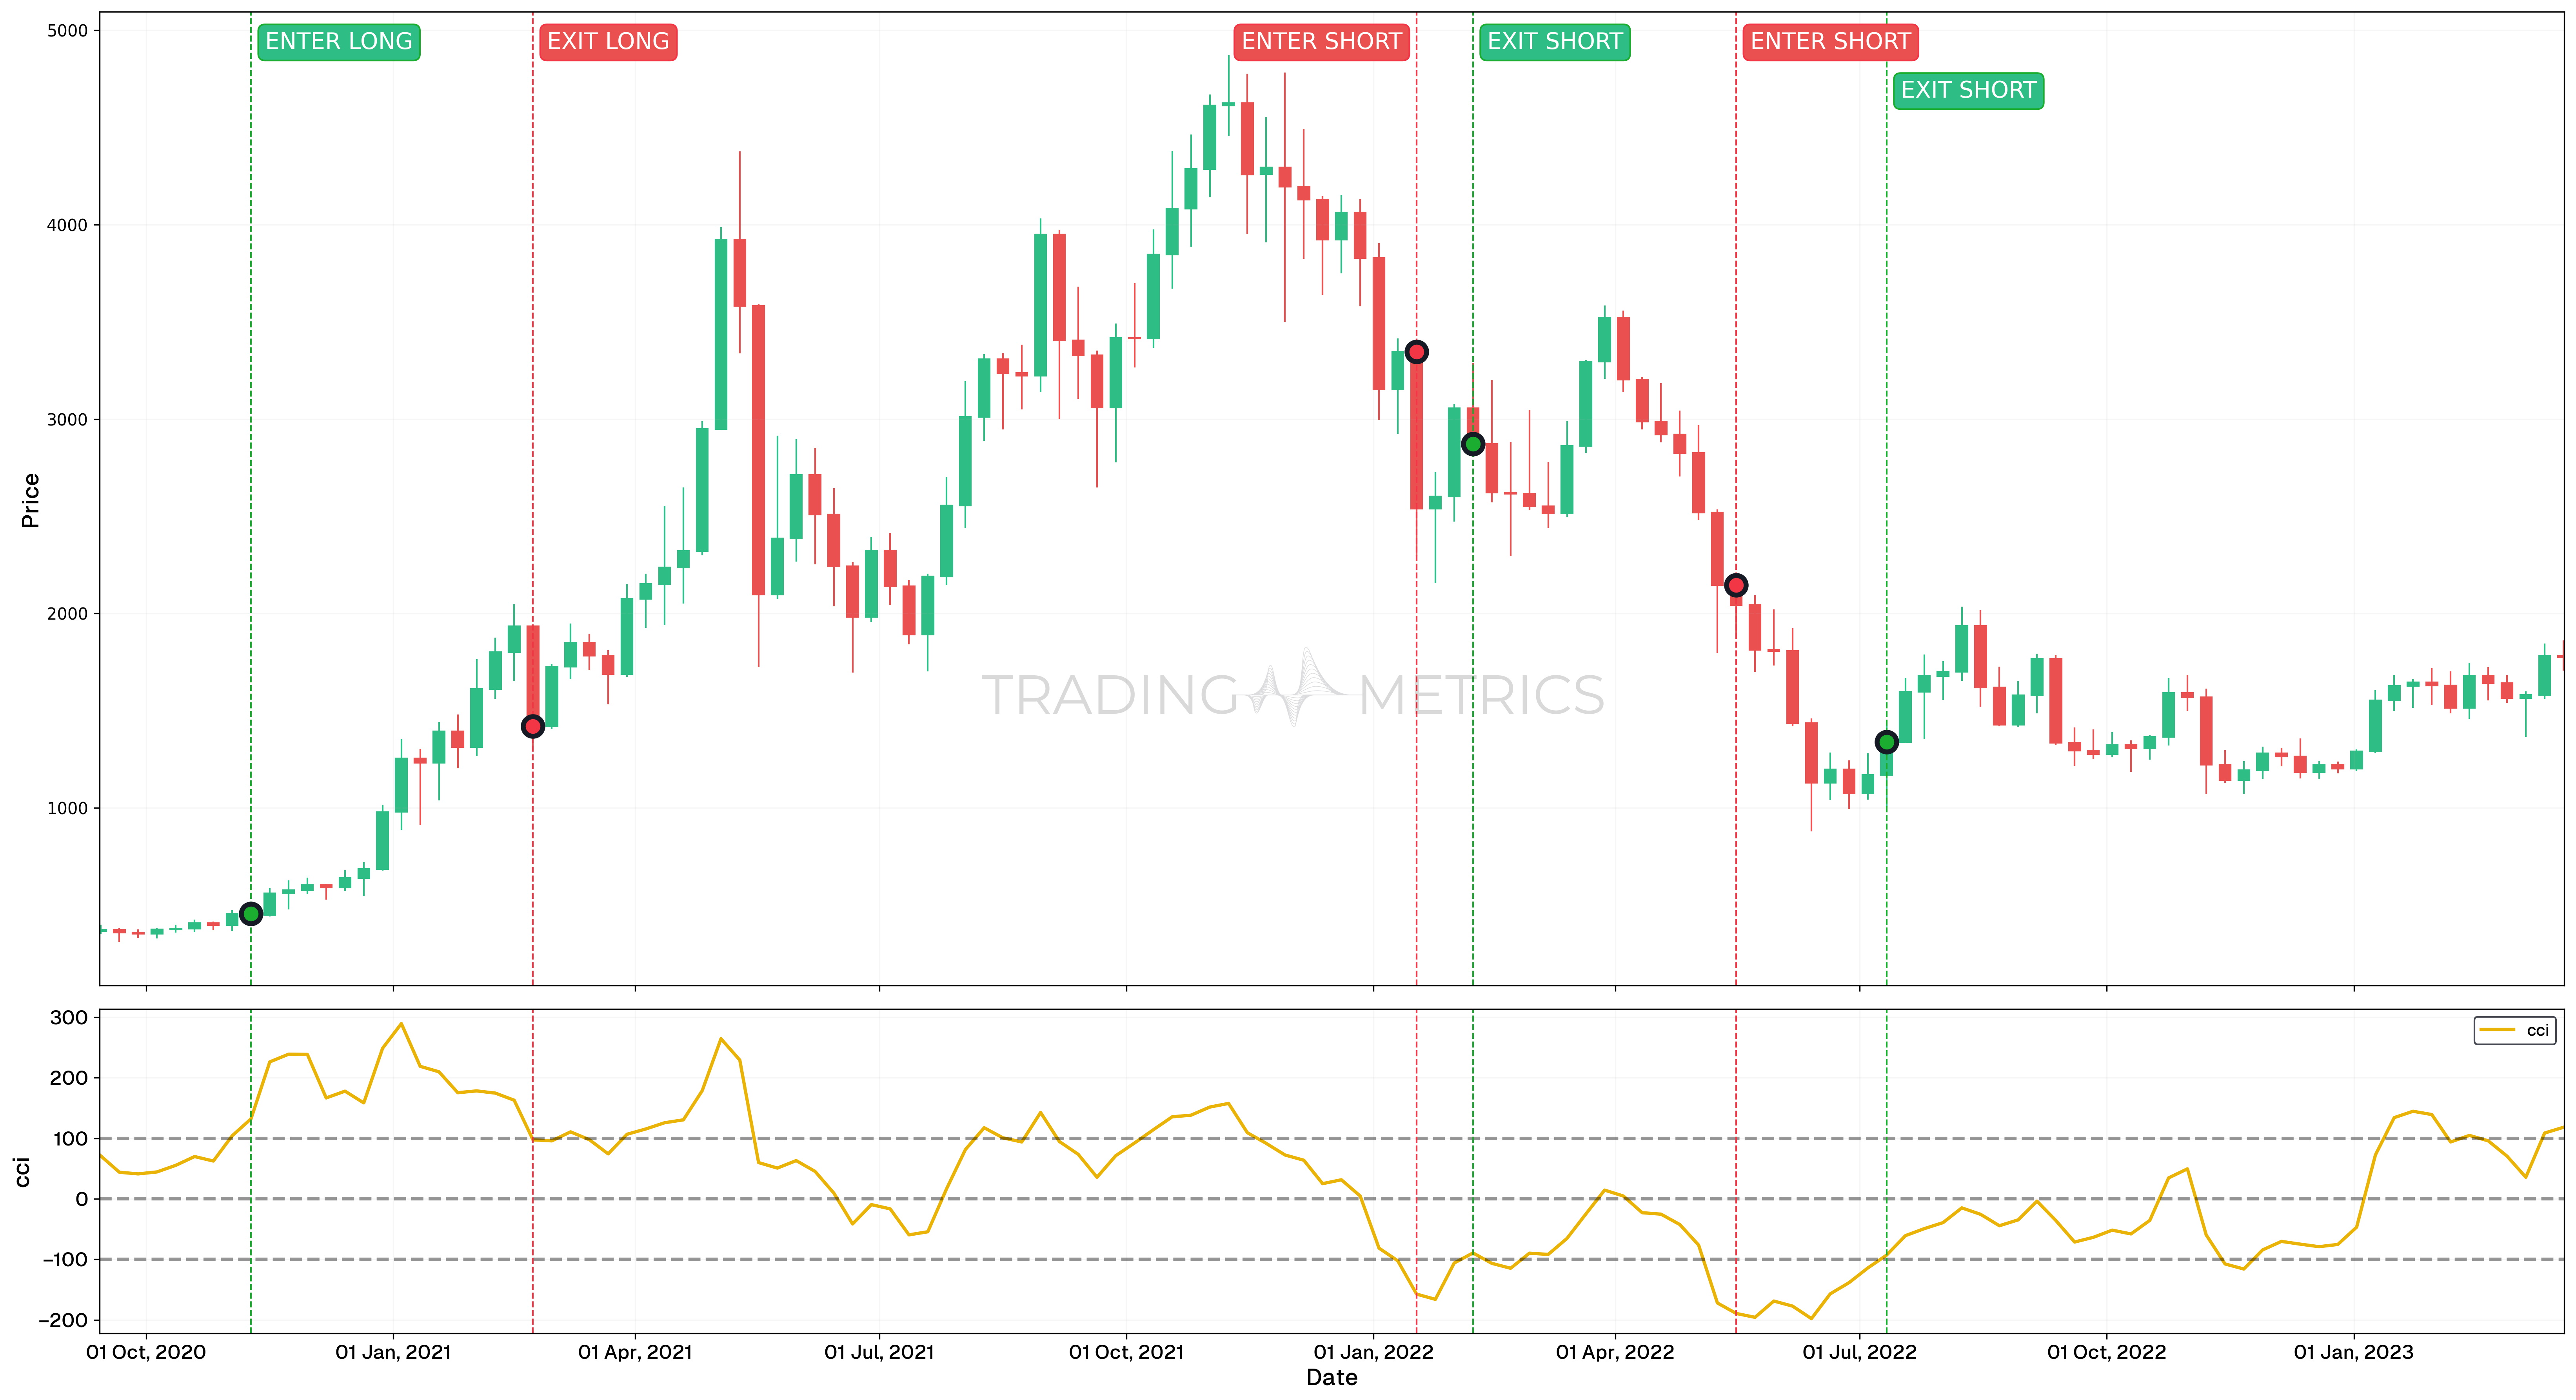
- The CCI indicator provided accurate signals for multiple successful trades during the analyzed period. These trades leveraged both long and short opportunities based on clear entry and exit points.
Trade Setups
-
Trade
- Entry: A long position was entered on November 9, 2020, when the CCI indicated strong bullish momentum.
- Exit: The trade was closed on February 22, 2021, after the CCI signaled a momentum reversal.
- Outcome: This trade captured a 283.32% price increase, taking advantage of the extended bullish trend.
-
Trade
- Entry: A short position was initiated on January 17, 2022, when the CCI indicated bearish momentum.
- Exit: The trade was closed on February 7, 2022, as the bearish trend weakened.
- Outcome: The short trade captured a 15.24% decline, successfully profiting from the market’s downward movement.
-
Trade
- Entry: A short position was entered on May 16, 2022, after the CCI signaled sustained bearish momentum.
- Exit: The position was closed on July 11, 2022, when the signal weakened.
- Outcome: The trade capitalized on a 37.60% price decline, making it the most profitable short trade in this analysis.
Risk Management
- Stop-Loss Placement: Given the multiple trades within this setup, stop-loss placement should be determined based on a combination of support/resistance zones and Fibonacci Retracement levels. This provides flexibility in managing risk across both long and short positions.
- Position sizing: Position size should be calculated independently for each trade to maintain a maximum risk exposure of 2% of trading capital, ensuring consistency in risk management.
- Managing Volatility: With multiple trades in play, monitoring price action at key levels is essential. Adjusting the stop-loss as each trade progresses can help secure gains while managing downside risk effectively.
- Exit Strategy: Implementing partial exits at significant Fibonacci levels (e.g., 38.2%, 50%, 61.8%) can facilitate locking in gains while maintaining exposure to further momentum in both long and short trades.
Conclusion
The success of these trades underscores the importance of the CCI indicator in identifying key overbought and oversold conditions, providing traders with actionable insights to maximize returns in both long and short positions.
False signals
Analysis
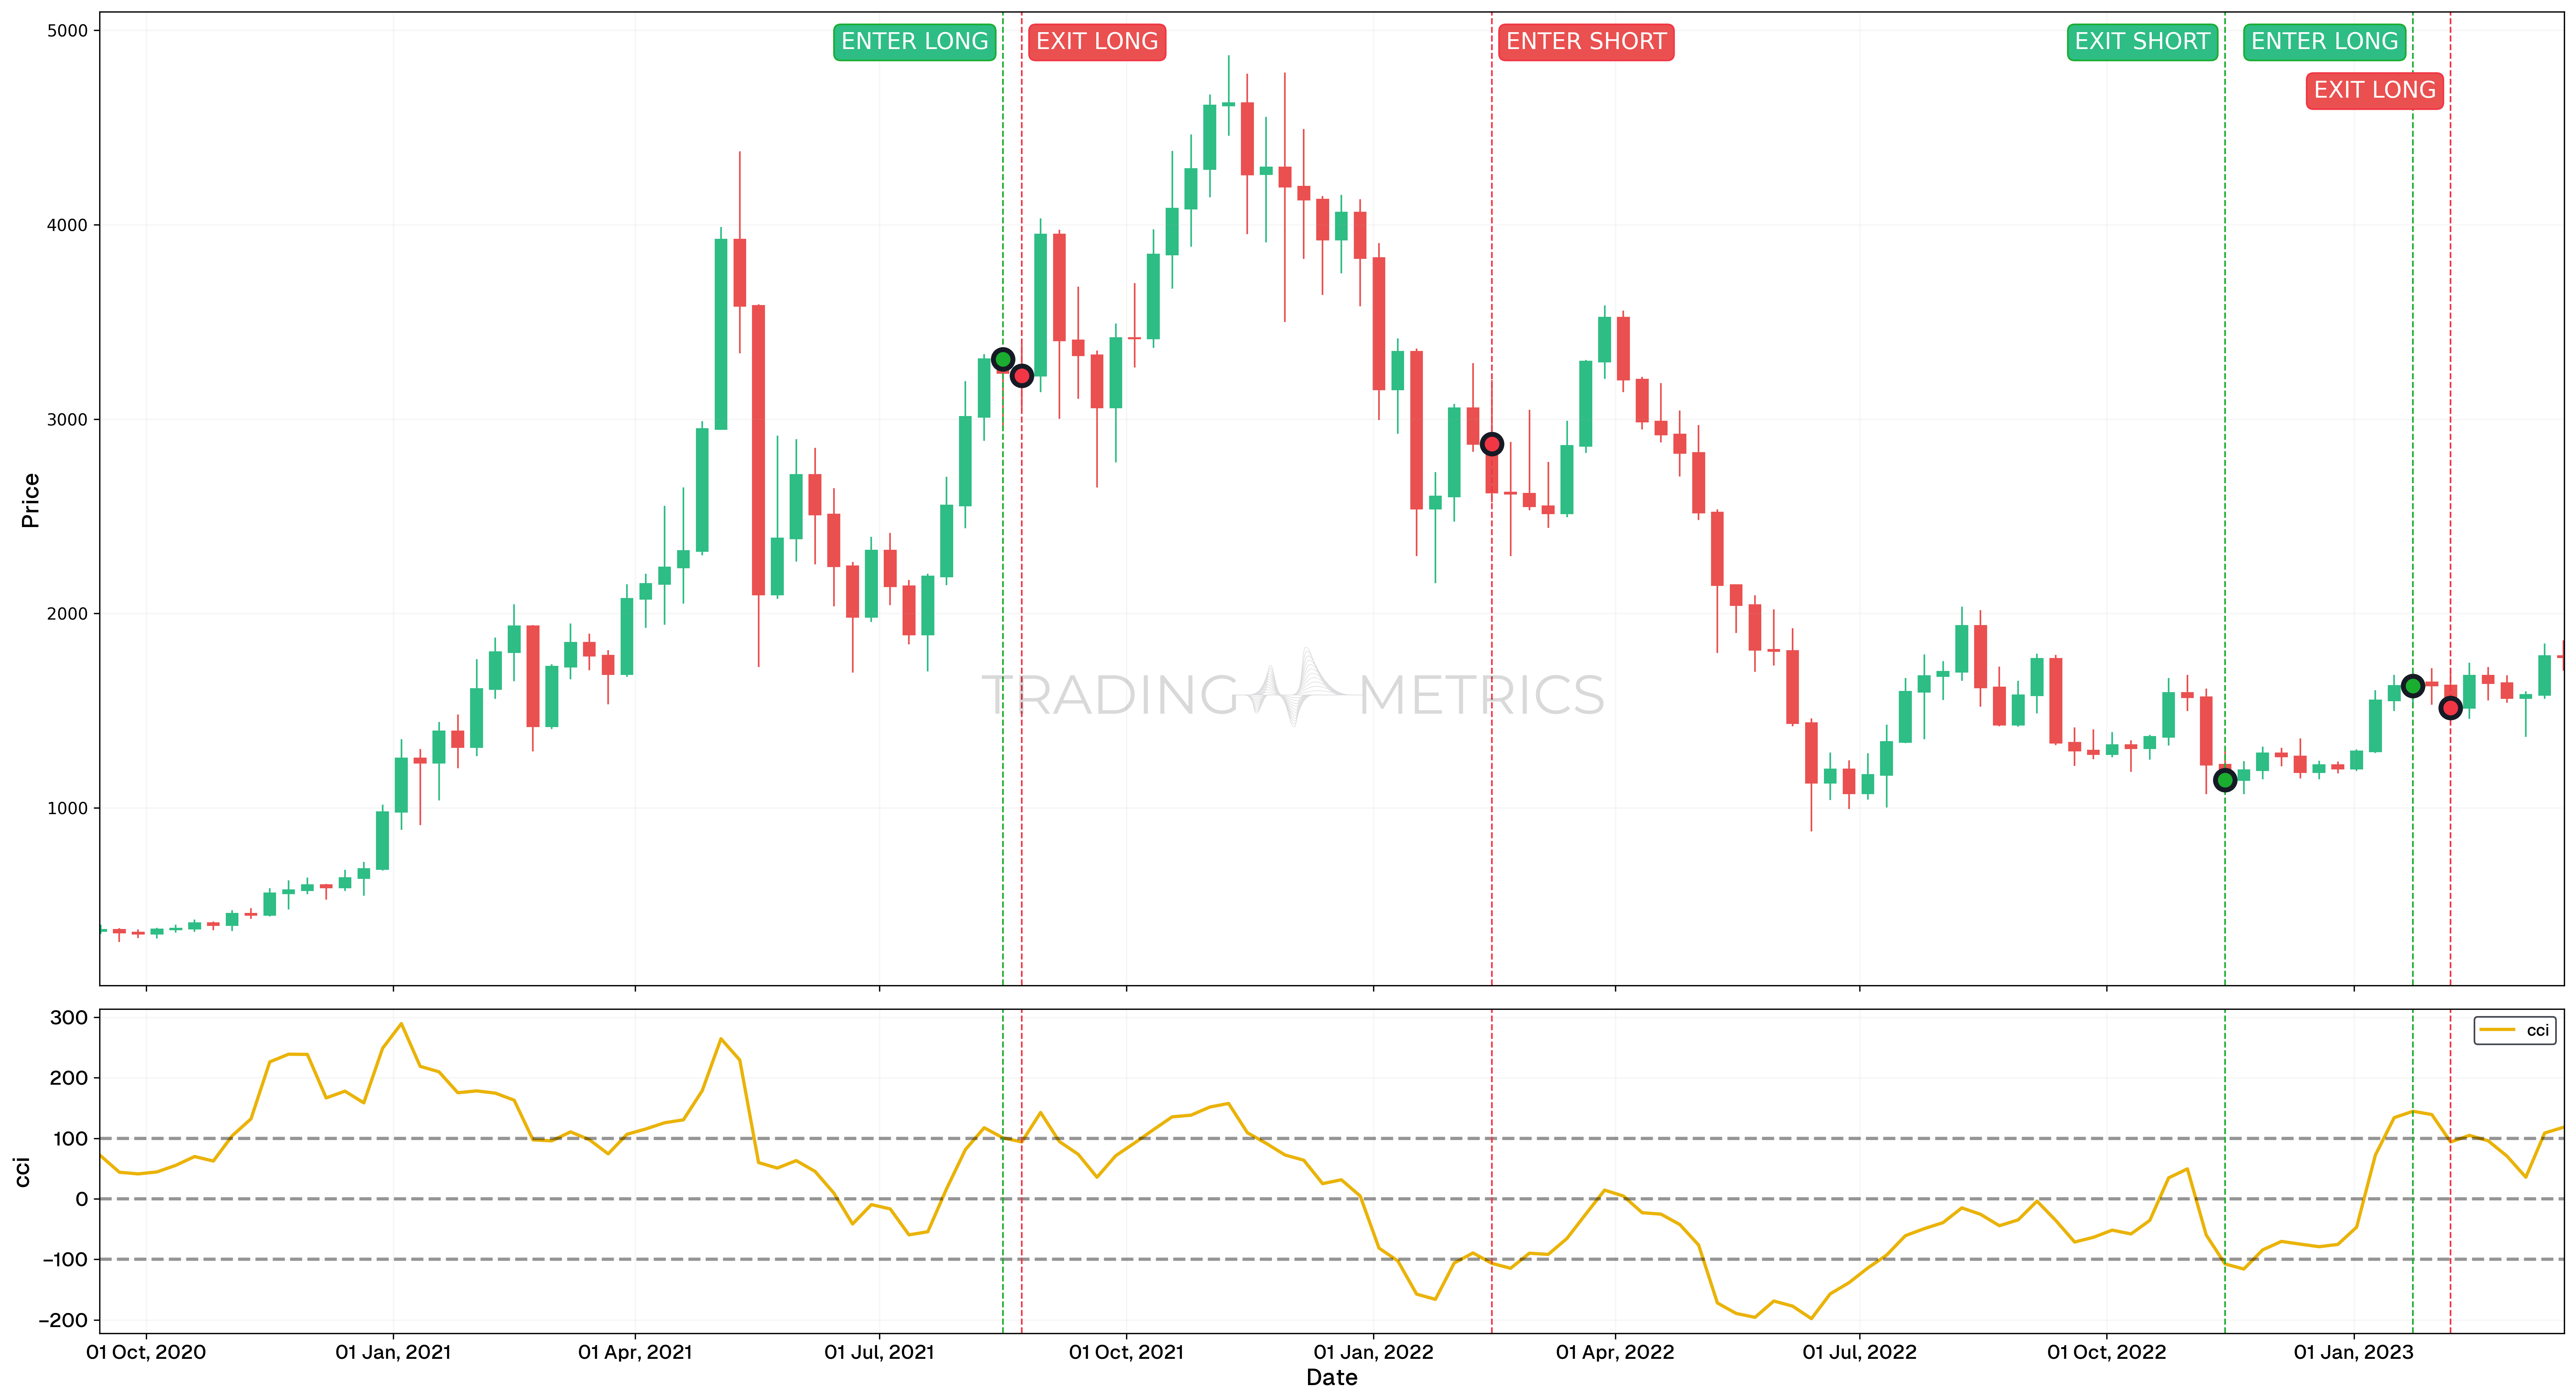
- The following trades were identified as bad trades due to their unfavorable outcomes. These trades were executed based on CCI signals that, in hindsight, did not align with subsequent market movements, resulting in losses or suboptimal results.
Trade Setups
-
Trade
- Entry: A long position was initiated on August 16, 2021, based on a CCI buy signal.
- Exit: The position was closed on August 23, 2021, after the market failed to move upward as expected.
- Outcome: The trade incurred a 3.23% loss, as the market experienced a brief downturn during this period. While the exit prevented further losses, the trade did not achieve the desired profit.
-
Trade
- Entry: A short position was opened on February 14, 2022, based on a CCI short signal.
- Exit: The trade was closed on November 14, 2022, as the market moved against the position.
- Outcome: The trade resulted in a 12.96% loss, as the market rallied instead of declining, showing that the CCI failed to predict the momentum accurately.
-
Trade
- Entry: A long position was initiated on January 23, 2023, after the CCI signaled bullish momentum.
- Exit: The position was closed on February 6, 2023, when the signal to sell was triggered.
- Outcome: The trade incurred a 4.03% loss, as the market showed weakness shortly after entry, and the CCI’s hold signal did not align with the market’s downward movement.
Key Takeaways
- These trades demonstrate the limitations of the CCI indicator, particularly in volatile or sideways market conditions. While the CCI is effective in trending markets, it can generate false signals during periods of market uncertainty.
- These examples highlight the importance of using the CCI alongside other technical indicators and tools to confirm signals and reduce the likelihood of unprofitable trades.
Combining CCI with Other Tools
The CCI is often used in conjunction with other technical analysis tools to enhance its effectiveness. Some popular combinations include:
- Moving Averages: Combining the CCI with moving averages can help confirm trend directions and potential reversals. For instance, if the CCI indicates an oversold condition while the price is also above the moving average, it might confirm a strong buying signal.
- Relative Strength Index (RSI): Using CCI with RSI can provide a more comprehensive view of market conditions. If both indicators signal overbought or oversold conditions, the trader can have more confidence in the signal.
- MACD (Moving Average Convergence Divergence): MACD can help confirm the trends indicated by the CCI. For example, if the CCI suggests a bullish divergence and the MACD crosses above its signal line, it can be a strong buy signal.
Customize the Lookback Period: The default 14-period setting isn’t set in stone. Shorter periods make CCI more sensitive, while longer periods smooth out noise.
Key Points
- Momentum and Trend Indicator: The Commodity Channel Index (CCI) measures the deviation of an asset’s price from its average price, helping identify overbought and oversold conditions.
- Range Interpretation: Values above +100 indicate overbought conditions, suggesting potential price corrections or reversals. Values below -100 indicate oversold conditions, signaling potential buying opportunities.
- Trend Confirmation: Sustained readings above +100 suggest strong bullish momentum, while sustained readings below -100 indicate bearish momentum.
- Divergence Signals: Look for divergences between CCI and price movements (e.g., price makes higher highs while CCI makes lower highs) as potential reversal signals.
- Works Across Markets: Despite its name, CCI is versatile and can be applied to stocks, forex, and other asset classes beyond commodities.
- Customizable Periods: Adjust the default 20-period setting to match your trading strategy: Shorter periods increase sensitivity, making CCI more responsive. While longer periods smooth out noise, providing more stable signals.
- Combine with Other Indicators: Use CCI alongside trend-following or Momentum Indicators like moving averages or RSI to confirm signals and reduce false positives.
- Effective in Trending and Range-Bound Markets: In trending markets, use CCI for trend confirmation, and in range-bound markets, use it to identify overbought or oversold conditions.
- Dynamic Support and Resistance: CCI levels often align with key support and resistance zones, providing actionable entry and exit points.
- Backtesting and Monitoring: Include CCI in backtesting to evaluate its effectiveness across various market conditions and refine its application for live trading.
Conclusion
The CCI is a powerful tool for identifying potential entry and exit points, detecting overbought and oversold conditions, and recognizing divergences that may indicate reversals. However, like all indicators, it is not foolproof and should be used in combination with other tools and thorough market analysis. In summary, the Commodity Channel Index is a versatile and valuable tool for traders when used correctly. By combining it with other indicators and paying attention to market conditions, traders can enhance their analysis and make more informed trading decisions.
Frequently Asked Questions
Quick answers based on this page's topic.
The CCI is a versatile momentum-based oscillator that identifies when an asset is overbought or oversold. It measures the current price relative to an average price over a specific period, helping traders spot new trends or warn of extreme market conditions.
Readings above +100 indicate strong bullish momentum and potential overbought conditions, while readings below -100 signal strong bearish momentum and potential oversold states. Traders often look for a return toward the zero line as a signal that a trend is losing steam.
Yes, CCI is highly effective for spotting divergences. When the price makes a new high but the CCI makes a lower high, it indicates weakening momentum, suggesting that a trend reversal may be imminent despite the appearance of continued strength on the chart.