Three Inside Up Pattern: A Three-Candle Bottom Confirmation
The Three Inside Up pattern is a deliberate bullish reversal signal in technical analysis, often emerging at the trough of a downtrend. Picture it as a bullish counterstrike - three candles where a bearish plunge is followed by a contained rally, then solidified by a decisive surge - lifting the bulls back into control. When this pattern forms, it’s a measured sign that bearish momentum is crumbling, offering traders a chance to buy or go long as an uptrend takes hold.
How to Identify the Three Inside Up Pattern in Trading
The Three Inside Up is a bullish reversal candlestick pattern. It appears at the end of a downtrend when bearish pressure weakens, giving way to a controlled bullish advance. Confirmation from the third candle is key. Here’s the step-by-step guide.
Start with the Big Picture
This pattern forms after a downtrend. It highlights fading seller strength and signals that buyers are preparing to regain control.
Trace the Candle Sequence
The setup develops over three candles:
- First Candle: A long bearish candle, extending the downtrend with strong selling momentum.
- Second Candle: A smaller bullish candle, fully contained within the first candle’s body — an inside bar showing hesitation.
- Third Candle: A long bullish candle that closes above the second candle’s high, ideally above the first candle’s open, confirming the bullish shift.
Zero in on the Confirmation Level
The confirmation level is the high of the second candle. A close above this level by the third candle confirms the reversal. A close above the first candle’s open adds even stronger conviction.
Watch the Breakout
The bullish trigger comes when the third candle closes above the second candle’s high. That’s your entry point, marking the transition of control to the bulls.
Check Volume for Additional Confirmation
Volume behavior can validate the pattern:
- Rises on the first candle as selling pressure peaks.
- Dips on the second candle during hesitation.
- Spikes on the third candle as buyers take over.
Rise Surge: Measure the first candle’s body or use nearby resistance levels to project a realistic price target upward from the third candle’s close.
How to Trade the Three Inside Up Pattern (Trading Example)
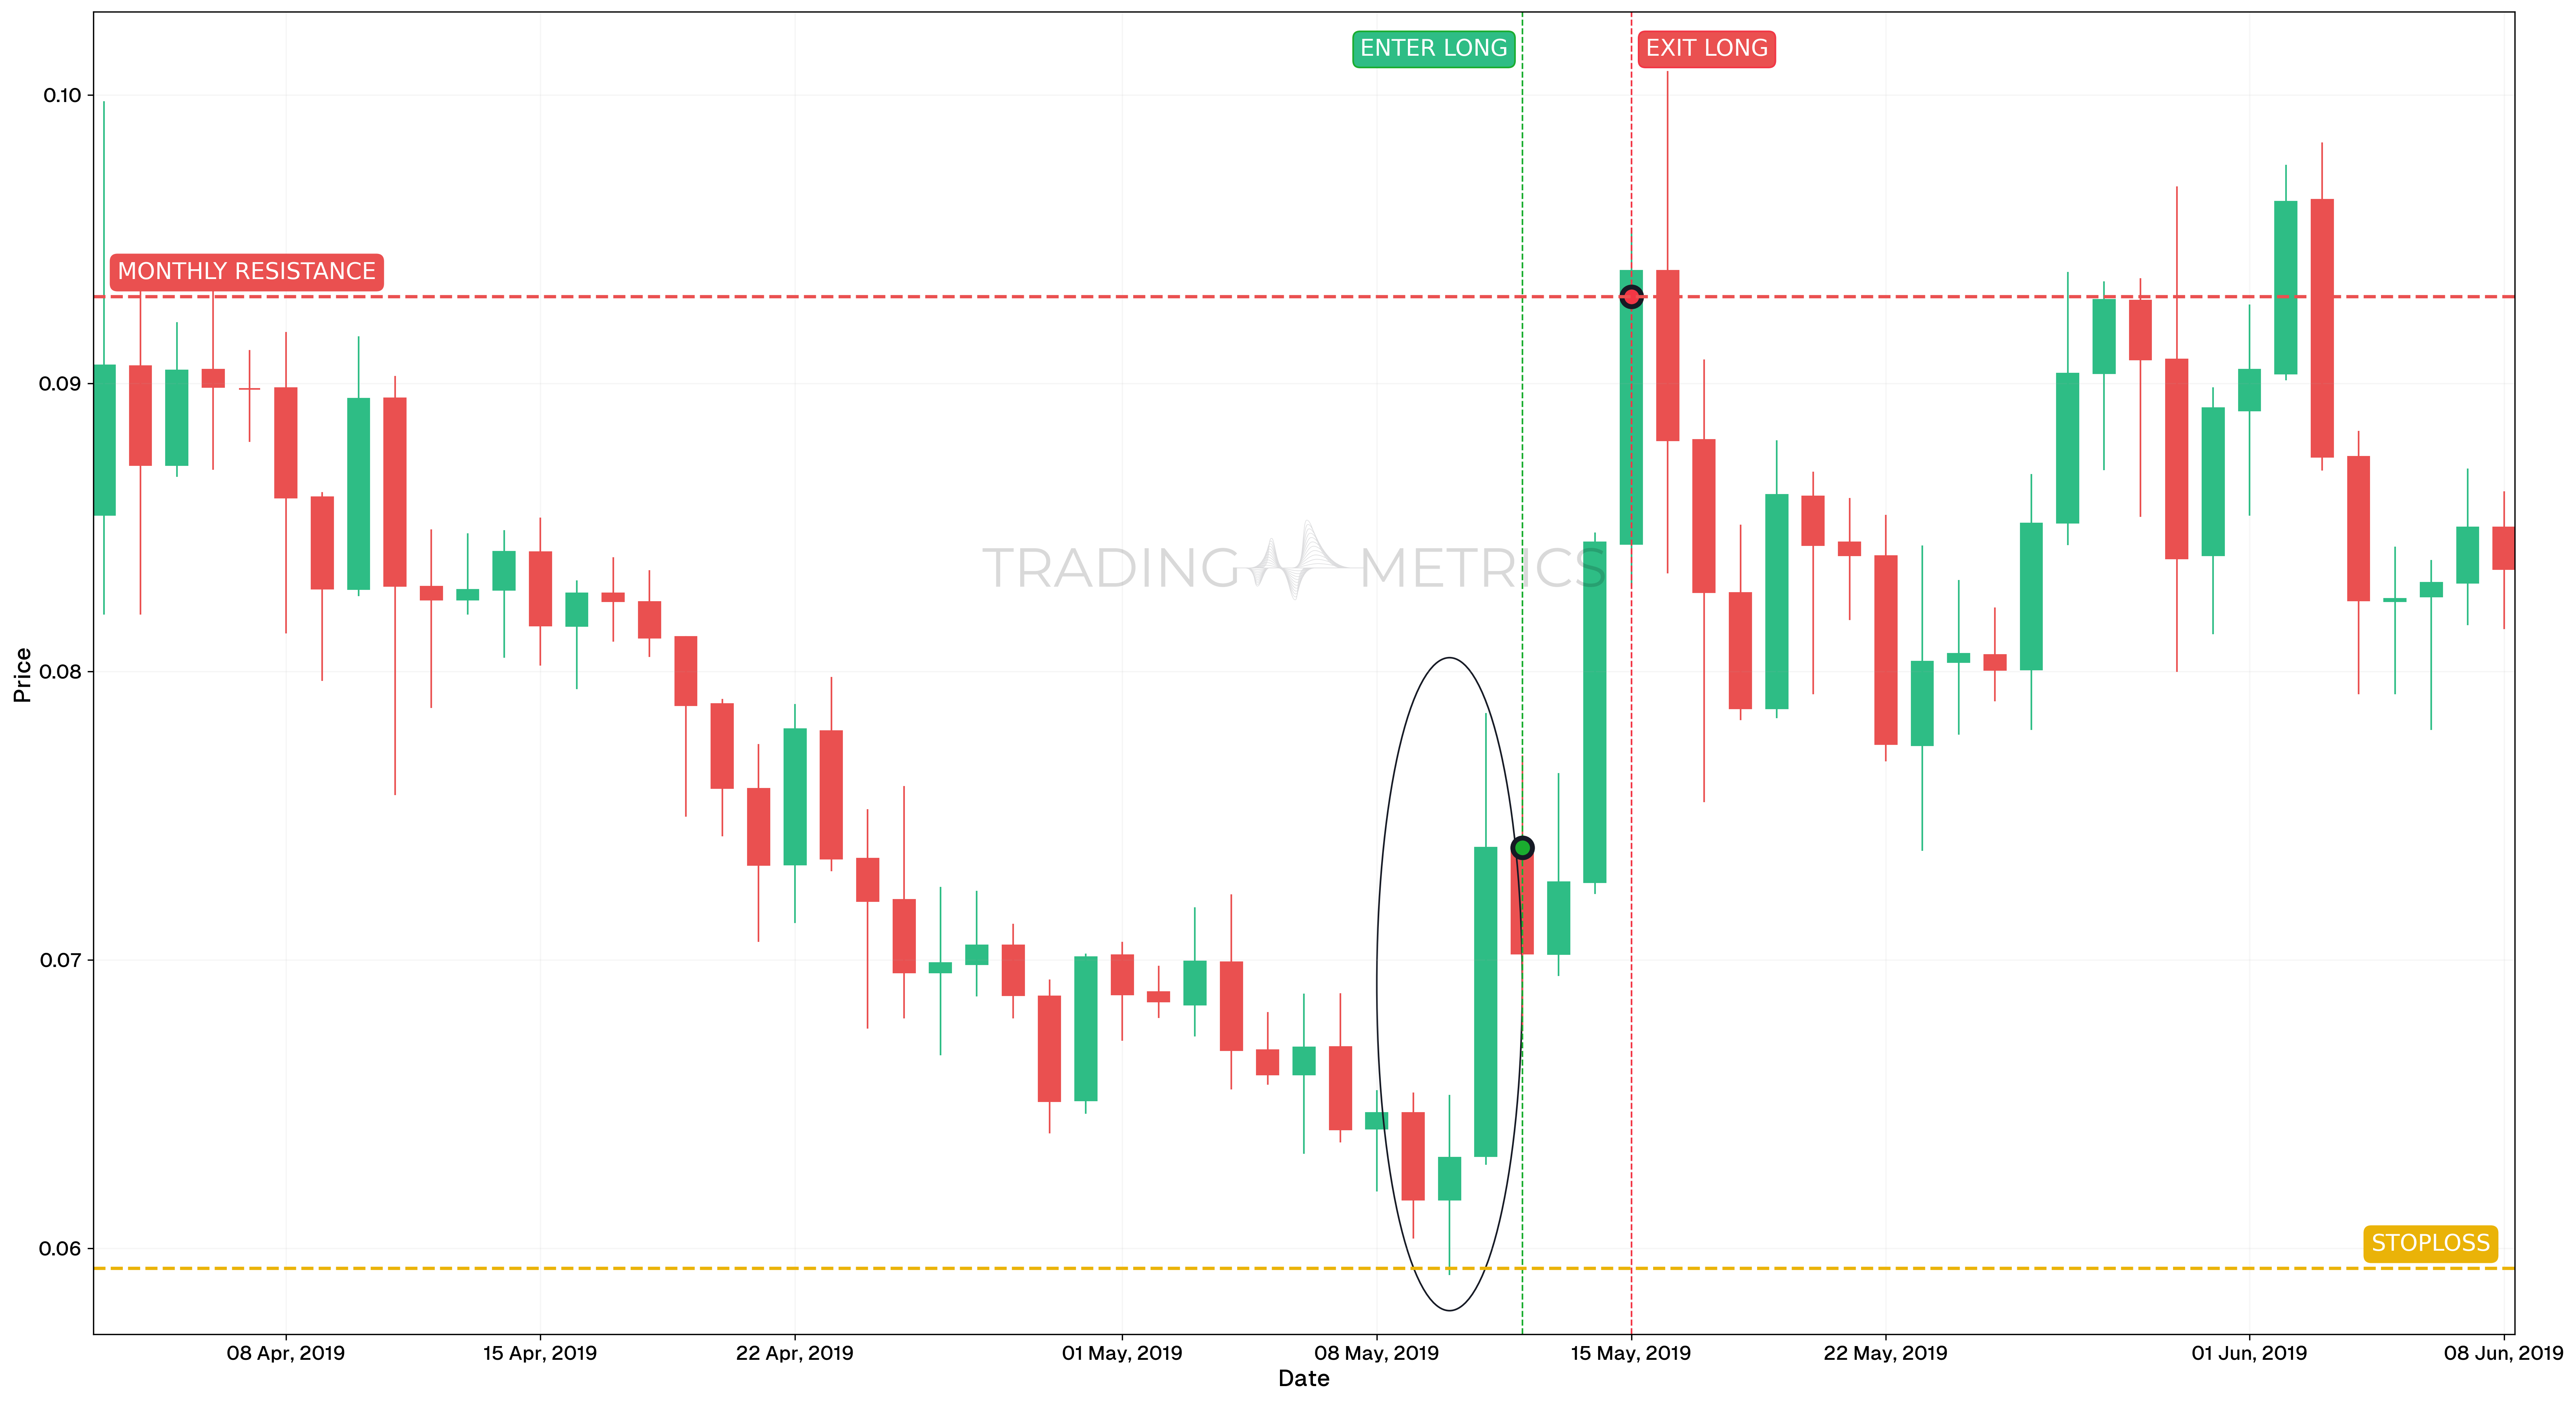
To illustrate how the Three Inside Up pattern can be used to enter a trade, we will choose the ADAUSDT pair. This bullish candlestick pattern appeared on the daily chart and marked the end of a brief retracement within a larger uptrend.
Analysis
On May 12, 2019, ADAUSDT formed a classic Three Inside Up pattern. The structure began with a large bearish candle, followed by a smaller bullish candle that stayed within the previous range, and then a third candle that closed above the first candle’s high, confirming reversal intent. This pattern occurred after a minor pullback in a larger bullish move, increasing its reliability.
Trade Setup
-
Entry: The trade was opened on May 12, 2019, at $0.0739, once the pattern completed and the third candle confirmed the reversal. The following condition strengthened the signal:
- RSI was trending upward and already above 50, indicating bullish momentum
-
Exit: The position was closed on May 15, 2019, at $0.093, at a logical previous support/resistance level which had historically capped price movement.
-
Outcome: The Three Inside Up pattern led to a 25.8% gain, showing how candle structure and confirmation from Momentum Indicators can combine for precise entries.
Risk Management
- Stop-Loss placement: The stop-loss was placed at $0.0593, below the lowest wick in the pattern, where the bullish structure would be invalidated.
- Position sizing: Trade size was calculated using a 2% capital risk model, based on the entry-to-stop distance.
- Risk-Reward Ratio: This trade resulted in a Risk-Reward Ratio of 1:1.31, balancing a moderate risk with a clean, structured reward target.
- Volatility Consideration: A tightening range and reduced Volatility prior to entry helped improve the precision of the breakout.
- Adaptive Exit Strategy: A trader seeking extended upside could have trailed the stop with EMA or used Fibonacci extensions to capture further trend continuation.
Volume Lift: A volume spike on the third candle surges the pattern into a bullish rise, locking in the reversal’s strength.
Pre-Trade Checklist
Surge the Proof: Pair the pattern with volume surges and indicators like RSI to dodge fakes and boost your odds.
Key Points
- Inside Precision: A long first candle, a smaller second candle contained within it, and a strong third candle boost reliability.
- Time Frame: Rises strongest on daily or weekly charts after downtrends.
- Combine with Indicators: Use moving averages or RSI to confirm the reversal.
- Breakout Confirmation: A close above the second candle’s high sets the rise - third candle strength is key.
- Price Target: Measure the first candle’s body or use resistance levels for a target above the close.
- Risk Management: Set a stop-loss below the first candle’s low to limit losses if it fails.
Wait for the Surge: Acting before the third candle confirms risks an inside trap - let the reversal lift off.
Conclusion
The Three Inside Up pattern is a trader’s deliberate tool for catching bullish reversals. Its calculated trio, paired with volume, RSI, and moving averages, can surge into big gains. Whether in crypto, stocks, or forex, this pattern sharpens your edge. Stay precise, manage your risk, and let the inside rise - that steady counterstrike could soar into a winning trade.
Frequently Asked Questions
Quick answers based on this page's topic.
A Bullish Harami is a two-candle 'warning' of a trend stall. Three Inside Up adds a third bullish candle that closes above the second candle's high. This extra data provides the 'confirmed recovery' needed to turn a subtle warning into a high-conviction trade entry.
It represents a 'failed liquidation.' The first candle is the final push of the bears; the second shows seller hesitation; and the third proves that buyers have completely absorbed the selling pressure. This sequence validates that the price floor has successfully held.
The most objective entry is at the close of the third candle. This close confirms that the range of the initial bearish candle has been reclaimed, allowing the trader to enter with confidence that the momentum has officially shifted to the upside.