Bullish Pennant Pattern: Reading the Tightening Coil to Upside
The Bullish Pennant pattern is a snappy bullish continuation signal in technical analysis, often popping up during an uptrend. Visualize it as a quick pit stop - price consolidating in a small, Symmetrical Triangle - before the upward surge resumes. When this pattern forms, it’s a sharp cue that bullish momentum is taking a breath to reload, offering traders a window to buy or go long as the uptrend charges ahead.
How to Identify the Bullish Pennant Pattern in Trading
The Bullish Pennant is a continuation formation. It develops when price consolidates briefly inside a small triangle after a strong rally, before resuming the uptrend. The setup confirms when price breaks above resistance. Here’s how to spot it:
Start with the Big Picture
This pattern forms during an uptrend. Buyers push price sharply higher, then pause in a pennant-shaped consolidation before continuing upward.
Trace the Flagpole and Pennant
The Bullish Pennant is made of two parts. Identifying both confirms the structure.
- Flagpole: A steep, powerful rise fueled by strong buying.
- Pennant: A small, Symmetrical Triangle with converging higher lows and lower highs.
Zero in on the Resistance Line
The resistance line is the upper boundary of the Bullish Pennant. Sellers cap price here temporarily, but once this line is broken, the pattern nears completion.
Watch the Breakout
The bullish trigger comes when price closes above resistance.
- A decisive break over the upper boundary or
- A strong bullish candle
Both confirm continuation of the uptrend and provide the entry.
Check Volume for Additional Confirmation
Volume activity supports the breakout.
- Spikes on the flagpole as buyers drive the rally.
- Fades during the Bullish Pennant while price consolidates.
- Surges on the breakout, confirming renewed bullish momentum.
Climb Up: Measure the height of the flagpole and project it upward from the break for a realistic price target.
How to Trade the Bullish Pennant Pattern (Trading Example)
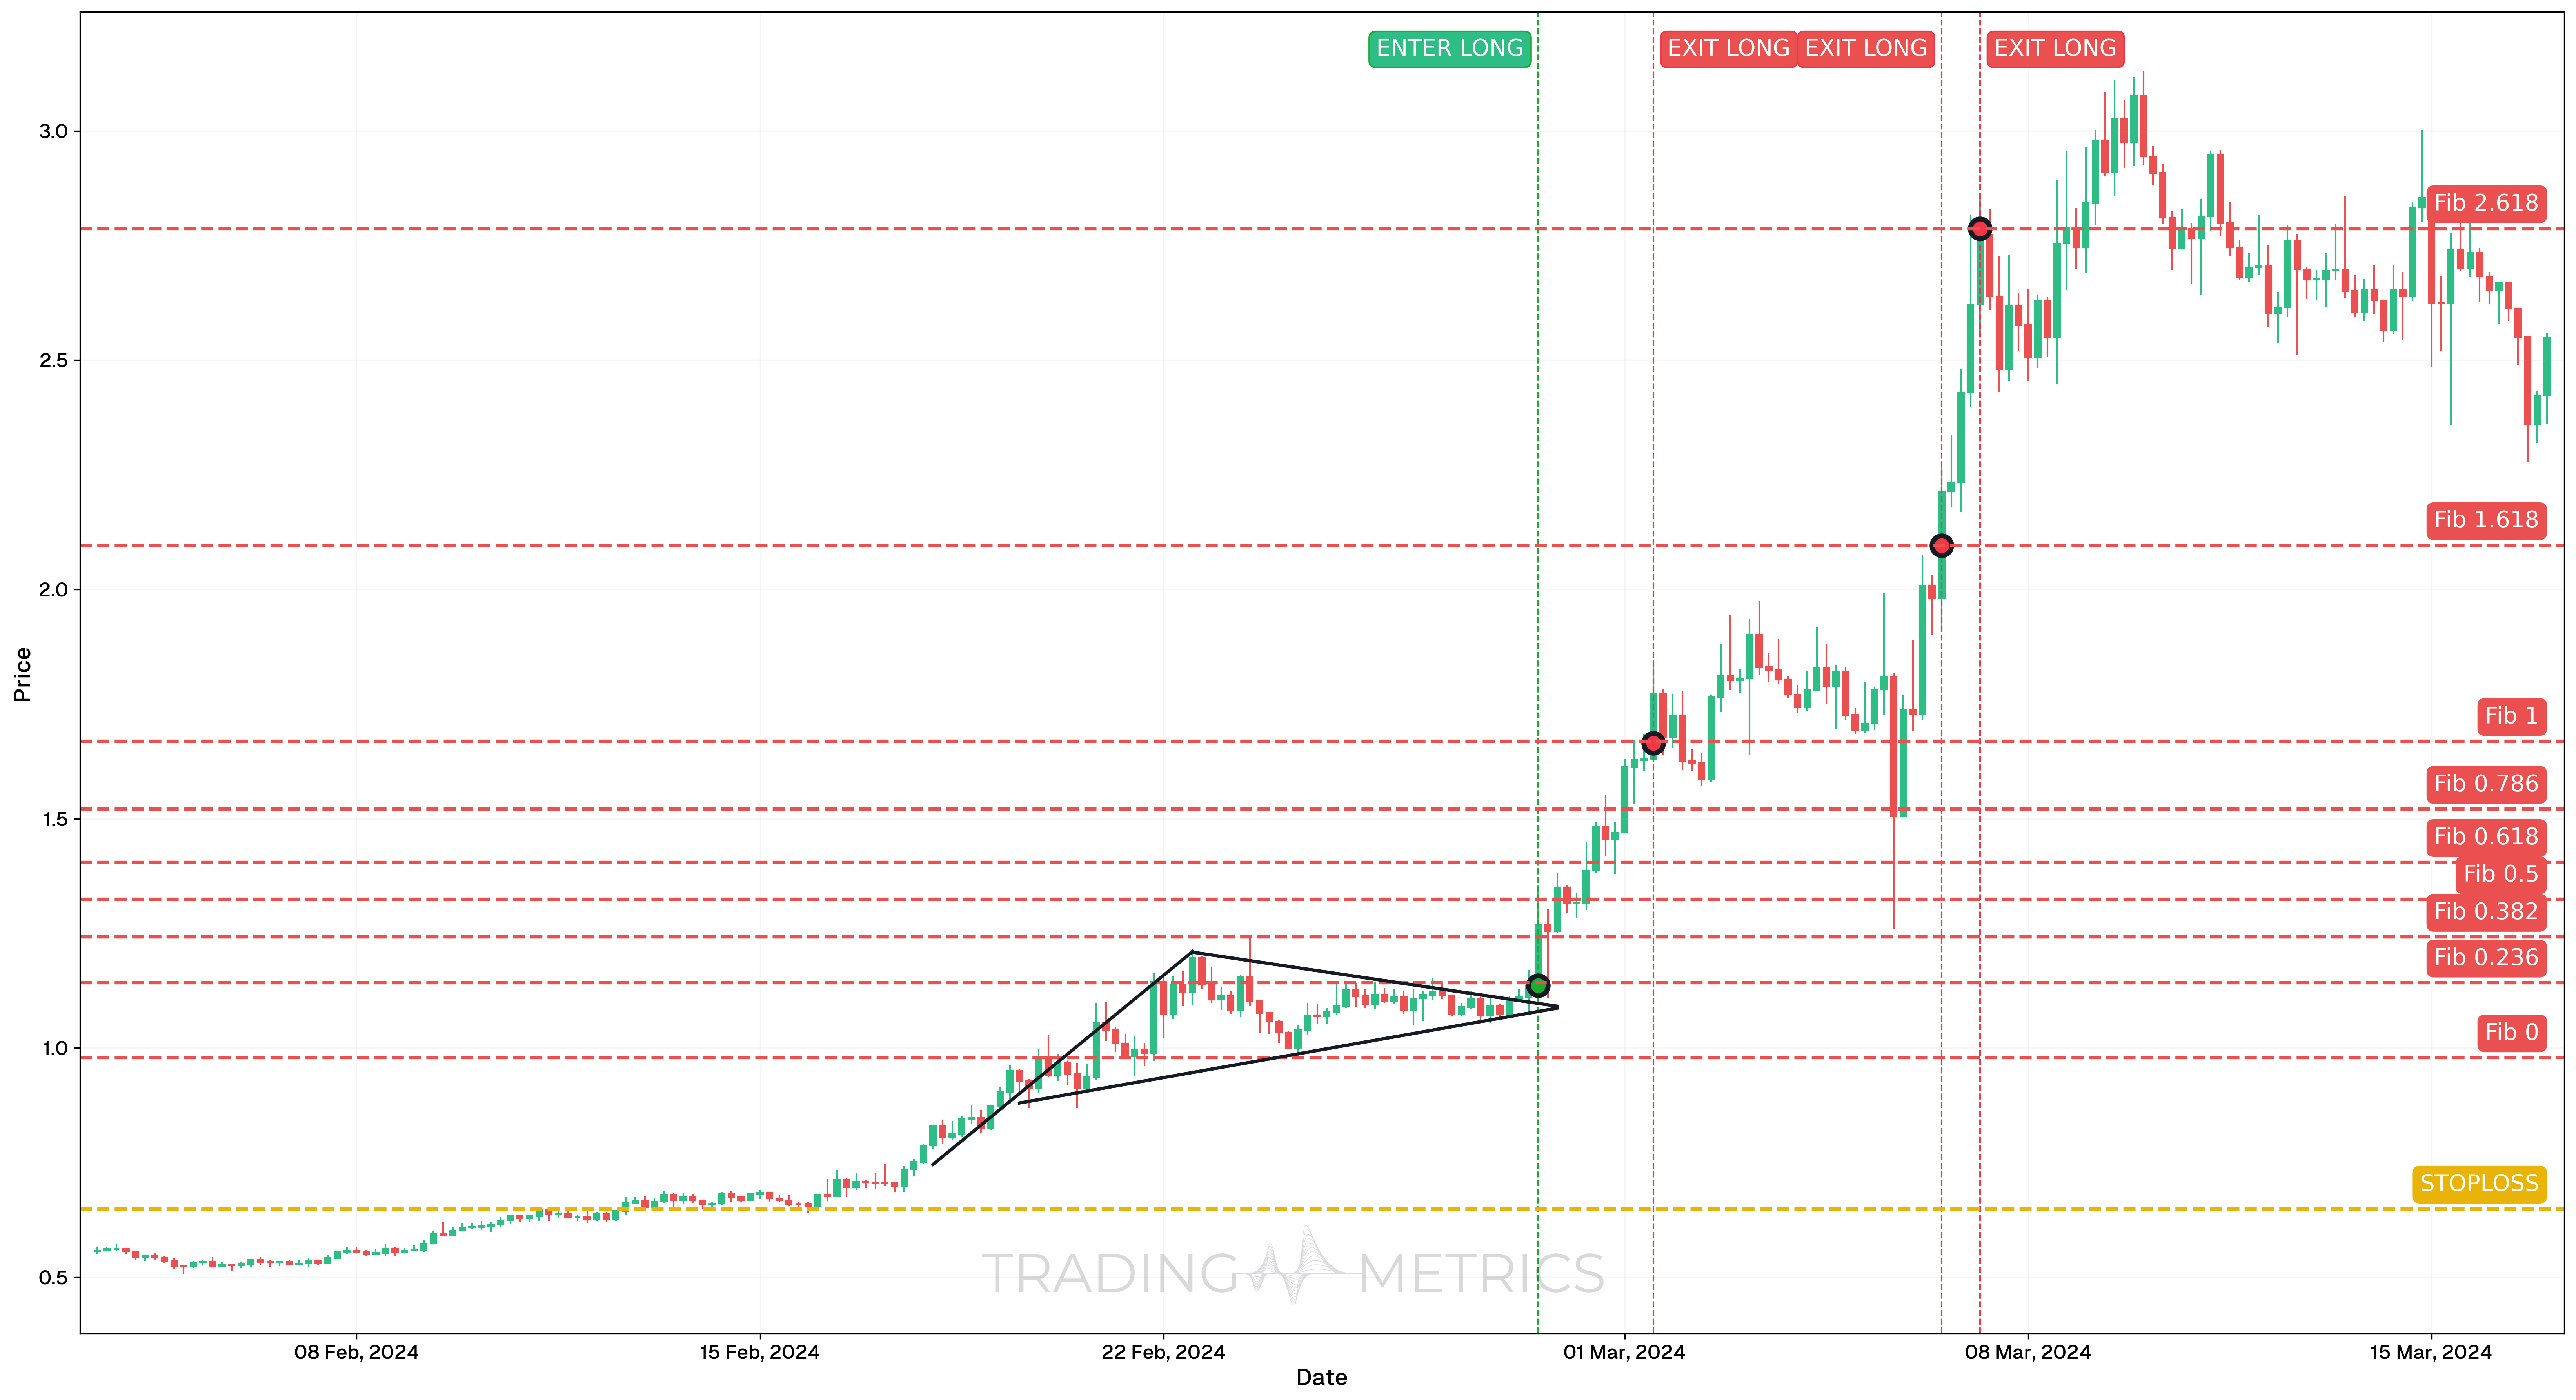
To illustrate how the Bullish Pennant pattern can be used to enter a trade, we will choose the FETUSDT pair on Bybit, using the 4-hour chart. This pattern appeared as a continuation during a strong bullish phase, offering a compact consolidation before the next breakout.
Analysis
Between February 3 and February 28, 2024, FETUSDT consolidated after a strong rally, forming a clean Bullish Pennant. The Bullish Pennant was defined by converging trendlines with decreasing volume, showing temporary equilibrium before the breakout. The consolidation respected structure tightly and signaled strength on resolution.
Trade Setup
-
Entry: The trade was entered on February 28, 2024, at 13:00, at $0.649, as price broke decisively above the upper boundary of the Bullish Pennant. Entry confirmation included:
- Breakout candle closing above resistance
- RSI trending above 50 and rising with momentum
-
Exit: The position was exited in multiple stages, targeting Fibonacci extension levels following the breakout move:
- 1st March 2024 (TP1): 1.0 Fib Extension hit at $1.669.
- 6th March 2024 (TP2): 1.618 Fib Extension hit at $2.096.
- 7th March 2024 at 05:00 (TP3): 2.618 Fib Extension hit at $2.787.
-
Outcome: The Bullish Pennant resulted in a powerful continuation move, with each target hit precisely. Splitting exits across extension levels ensured both discipline and profit maximization.
Risk Management
- Stop-Loss placement: The stop-loss was set at $0.649, directly at the breakout candle’s low. This ultra-tight stop maximized reward potential while protecting against false breakouts within the Bullish Pennant structure.
- Position sizing: A 2% capital risk model was used, with size determined by the eventual stop-loss distance.
- Volatility Consideration: The Bullish Pennant formed during contracting Volatility, which expanded sharply on breakout. This shift offered strong reward potential with limited consolidation risk.
- Adaptive Exit Strategy: Using multiple Fibonacci-based take profits allowed for clear, technical-based distribution across momentum phases without emotional interference.
Volume Snap: A volume spike on the resistance break snaps the Bullish Pennant into a bullish surge.
Pre-Trade Checklist
Snap the Proof: Pair the pattern with volume surges and indicators like RSI to cut fakes and boost your edge.
Key Points
- Triangle Tightness: A sharp, symmetrical Bullish Pennant boosts the signal - loose shapes dilute it.
- Time Frame: Hits hard on daily or hourly charts in active uptrends.
- Combine with Indicators: Use moving averages or RSI to sharpen your entry.
- Breakout Confirmation: The resistance break keeps the trend rolling - don’t jump early.
- Price Target: Measure the flagpole height, project up from the break for your aim.
- Risk Management: Set a stop-loss below the Bullish Pennant’s low to cap losses if it fails.
Hold for the Snap: Acting before the resistance break risks a pennant-shaped trap - wait for the climb.
Conclusion
The Bullish Pennant pattern is a trader’s quick grab for riding bullish continuations. Its tight triangle, paired with volume, RSI, and moving averages, can spark big rises. Whether in crypto, stocks, or forex, this pattern hones your game. Stay sharp, manage your risk, and let the Bullish Pennant tighten - that brief pause could snap into a winning lift.
Frequently Asked Questions
Quick answers based on this page's topic.
In a pennant, the price doesn't even have enough selling pressure to form a channel; it immediately begins to squeeze. This 'compression' after a rally shows that buyers are stepping in at every minor dip, creating a coiled spring effect that usually resolves in an explosive move higher.
The optimal entry is on the breakout above the upper converging trendline. Ideally, this breakout should happen on a spike in volume, confirming that the period of indecision has ended and the next impulsive leg of the uptrend has begun.
Yes. A pennant should be small relative to the flagpole. If the 'pennant' becomes too large or lasts too long, the momentum from the flagpole dissipates, and the pattern may fail or transition into a broader symmetrical triangle with less predictable outcomes.