Tweezer Tops Pattern: When Two Candles Hit the Same Ceiling
The Tweezer Tops pattern is a pinpoint bearish reversal signal in technical analysis, often peaking at the height of an uptrend. Imagine it as a precise double-tap - two candles with matching or nearly matching highs - marking a stubborn resistance where bulls lose grip. When this pattern forms, it’s a sharp cue that bullish momentum is stalling, offering traders a chance to sell or short the asset as a downtrend prepares to descend.
How to Identify the Tweezer Tops Pattern in Trading
The Tweezer Tops is a bearish reversal candlestick formation. It develops over two candles at the peak of an uptrend, where repeated highs signal resistance and a fading bullish push. The setup shows a stalled advance. Here’s how to spot it:
Start with the Big Picture
This pattern forms after an uptrend. Buyers attempt to push higher but fail at the same level twice, hinting that resistance is holding strong.
Trace the Two-Candle Sequence
The structure unfolds in two steps:
- First Candle: A bullish candle, extending the uptrend with strength and marking a high.
- Second Candle: Typically bearish (sometimes neutral), with a high that matches or nearly matches the first candle’s high, signaling rejection at resistance.
Zero in on the Confirmation Level
The confirmation level is the low of the second candle. A close below this level signals the reversal’s start and validates the pattern.
Watch the Breakdown
The bearish trigger comes when a subsequent candle closes below the second candle’s low.
- Conservative traders wait for this confirmation.
- Aggressive traders may anticipate the breakdown once the second candle forms.
Check Volume for Additional Confirmation
Volume behavior adds confidence:
- Rises on the first candle as buyers drive the push.
- Holds or dips on the second, showing resistance is capping momentum.
- Spikes on the confirming bearish candle, reinforcing the reversal’s credibility.
Drop Pin: Measure the range from the tweezer high to the second candle’s low or use nearby support levels to project a realistic price target downward from the confirmation close.
How to Trade the Tweezer Tops Pattern (Trading Example)
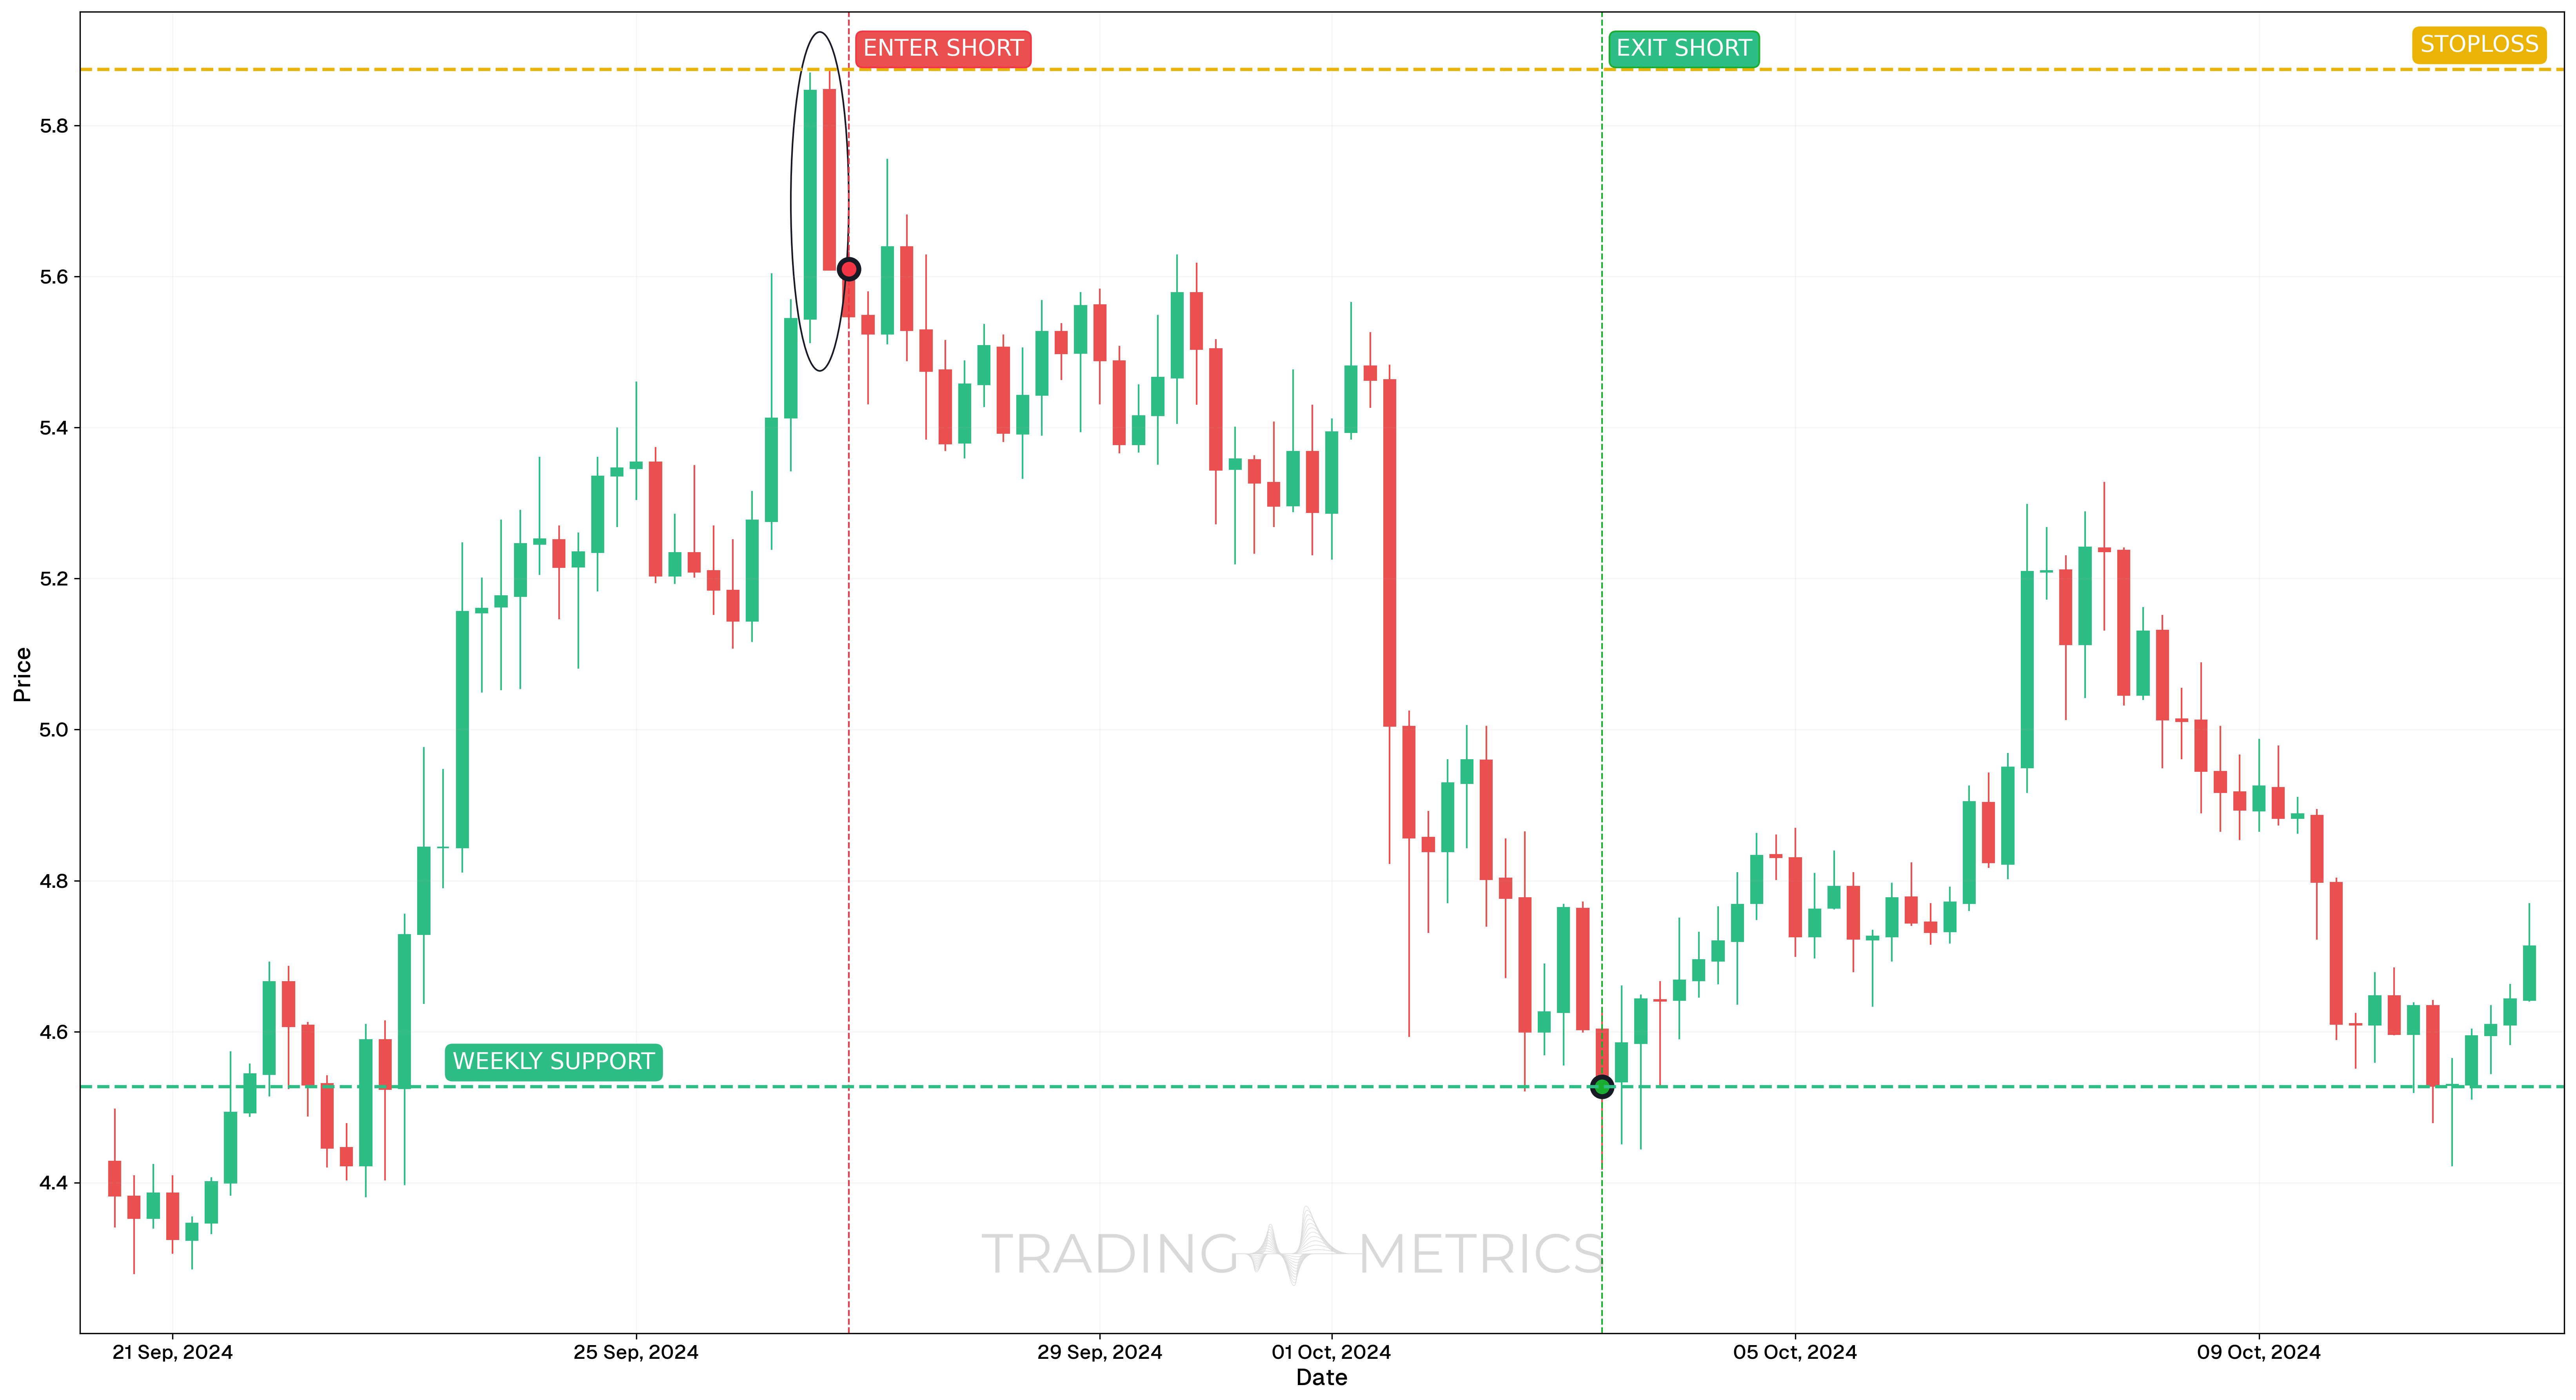
To illustrate how the Tweezer Tops pattern can be used to enter a trade, we will choose the NEARUSDT pair. This bearish reversal setup formed on the 4-hour chart, signaling the end of an uptrend and offering a clean short entry opportunity.
Analysis
On September 26, 2024, NEARUSDT printed a classic Tweezer Tops formation, where two consecutive candles had nearly identical highs. This symmetry reflected a clear rejection of higher prices and exhaustion in bullish pressure. The pattern formed after a strong upside move, increasing its reliability as a reversal signal.
Trade Setup
-
Entry: The trade was opened on September 26, 2024, at 20:00, at $5.61, after price broke below the candle structure and confirmed weakness. Technical confluence included:
-
Exit: The position was closed on October 3, 2024, at 8:00, at $4.527, near a well-tested previous support/resistance zone.
-
Outcome: The Tweezer Tops short trade led to a 19.2% drop, captured efficiently in under a week with confirmation-based entry and structured exit.
Risk Management
- Stop-Loss placement: The stop-loss was placed at $5.874, just above the tweezer highs, marking a logical invalidation point for the bearish setup.
- Position sizing: Based on a 2% capital risk model, position size was calculated using the entry-to-stop range.
- Risk-Reward Ratio: The setup yielded a Risk-Reward Ratio of 1:4.10, combining low risk with strong reward potential.
- Volatility Consideration: The pattern formed during expanding Volatility, favoring breakdown acceleration after a tight resistance zone was respected.
- Adaptive Exit Strategy: Traders could also trail the stop above lower highs or use support-based scaling exits depending on risk tolerance.
Volume Tap: A volume spike on the confirming candle taps the pattern into a bearish turn.
Pre-Trade Checklist
Tap the Proof: Pair the pattern with volume spikes and indicators like RSI to dodge fakes and boost your odds.
Key Points
- High Precision: Nearly identical highs boost reliability - wide gaps dilute it.
- Time Frame: Strikes hardest on daily or weekly charts after uptrends.
- Combine with Indicators: Use moving averages or RSI to confirm the reversal.
- Breakout Confirmation: A close below the second candle’s low sets the turn - don’t jump on the tops alone.
- Price Target: Measure the range from high to low or use support levels for a target below the confirmation.
- Risk Management: Set a stop-loss above the tweezer high to limit losses if it fails.
Wait for the Tap: Acting before confirmation risks a tapped trap - let the reversal confirm.
Conclusion
The Tweezer Tops pattern is a trader’s precise tool for catching bearish reversals. Its double-tap ceiling, paired with volume, RSI, and moving averages, can pin down big drops. Whether in crypto, stocks, or forex, this pattern sharpens your edge. Stay patient, manage your risk, and let the tops align - that stalled peak could plunge into a winning trade.
Frequently Asked Questions
Quick answers based on this page's topic.
Tweezer Tops represent a 'Hard Ceiling.' It occurs when two consecutive candles hit the exact same high price before reversing. This signifies that despite two separate attempts, buyers were unable to break a specific resistance level, proving that supply is perfectly neutralizing demand at that coordinate.
The difference is scale. A Double Top is a macro chart pattern taking weeks to form, while Tweezer Tops is a micro candlestick pattern consisting of just two candles. However, Tweezer Tops often mark the precise turning point that forms the second peak of a larger Double Top.
For a high-probability setup, the highs should be virtually identical. This precision confirms the strength of the resistance. If the second candle exceeds the first by a significant margin, the 'matching' logic is invalidated, and the pattern loses its structural reliability.