Bearish Engulfing Pattern: When Sellers Take Full Control
The Bearish Engulfing pattern is a stark bearish reversal signal in technical analysis, often appearing at the peak of an uptrend. Visualize it as a swift takeover - a small bullish candle swallowed entirely by a larger bearish one - signaling a shift from bullish control to bearish control. When this pattern emerges, it’s a bold warning that bullish momentum is stalling, offering traders a chance to sell or short the asset as a potential downtrend begins.
How to Identify the Bearish Engulfing Pattern in Trading
The Bearish Engulfing is a bearish reversal candlestick formation. It develops over two candles at the end of an uptrend, with the second candle overpowering the first. The setup confirms when the bearish candle closes below the prior bullish candle’s open. Here’s how to spot it:
Start with the Big Picture
This pattern appears after an uptrend. Buyers still push on the first candle, but the second candle shows sellers stepping in forcefully to seize control.
Trace the Two-Candle Sequence
The structure unfolds in two parts. Spotting how the second candle engulfs the first confirms the setup.
- First Candle: A relatively small bullish candle, reflecting remaining buying pressure.
- Second Candle: A strong bearish candle that fully engulfs the prior candle’s body, opening above its close and closing below its open.
Zero in on the Confirmation Level
The confirmation level is the second candle’s close. Price must finish below the first candle’s open to validate the reversal.
Watch the Breakdown
The bearish trigger comes when the second candle closes below the first candle’s open.
- A decisive bearish engulfing close or
- A large bearish body
Both confirm the reversal and provide the entry.
Check Volume for Additional Confirmation
Volume activity reinforces the signal.
- Light to moderate volume on the first candle.
- A surge of volume on the second candle, showing sellers taking control.
Drop Estimate: Measure the height of the second candle or use nearby support levels to project a realistic price target downward from the close.
How to Trade the Bearish Engulfing Pattern (Trading Example)
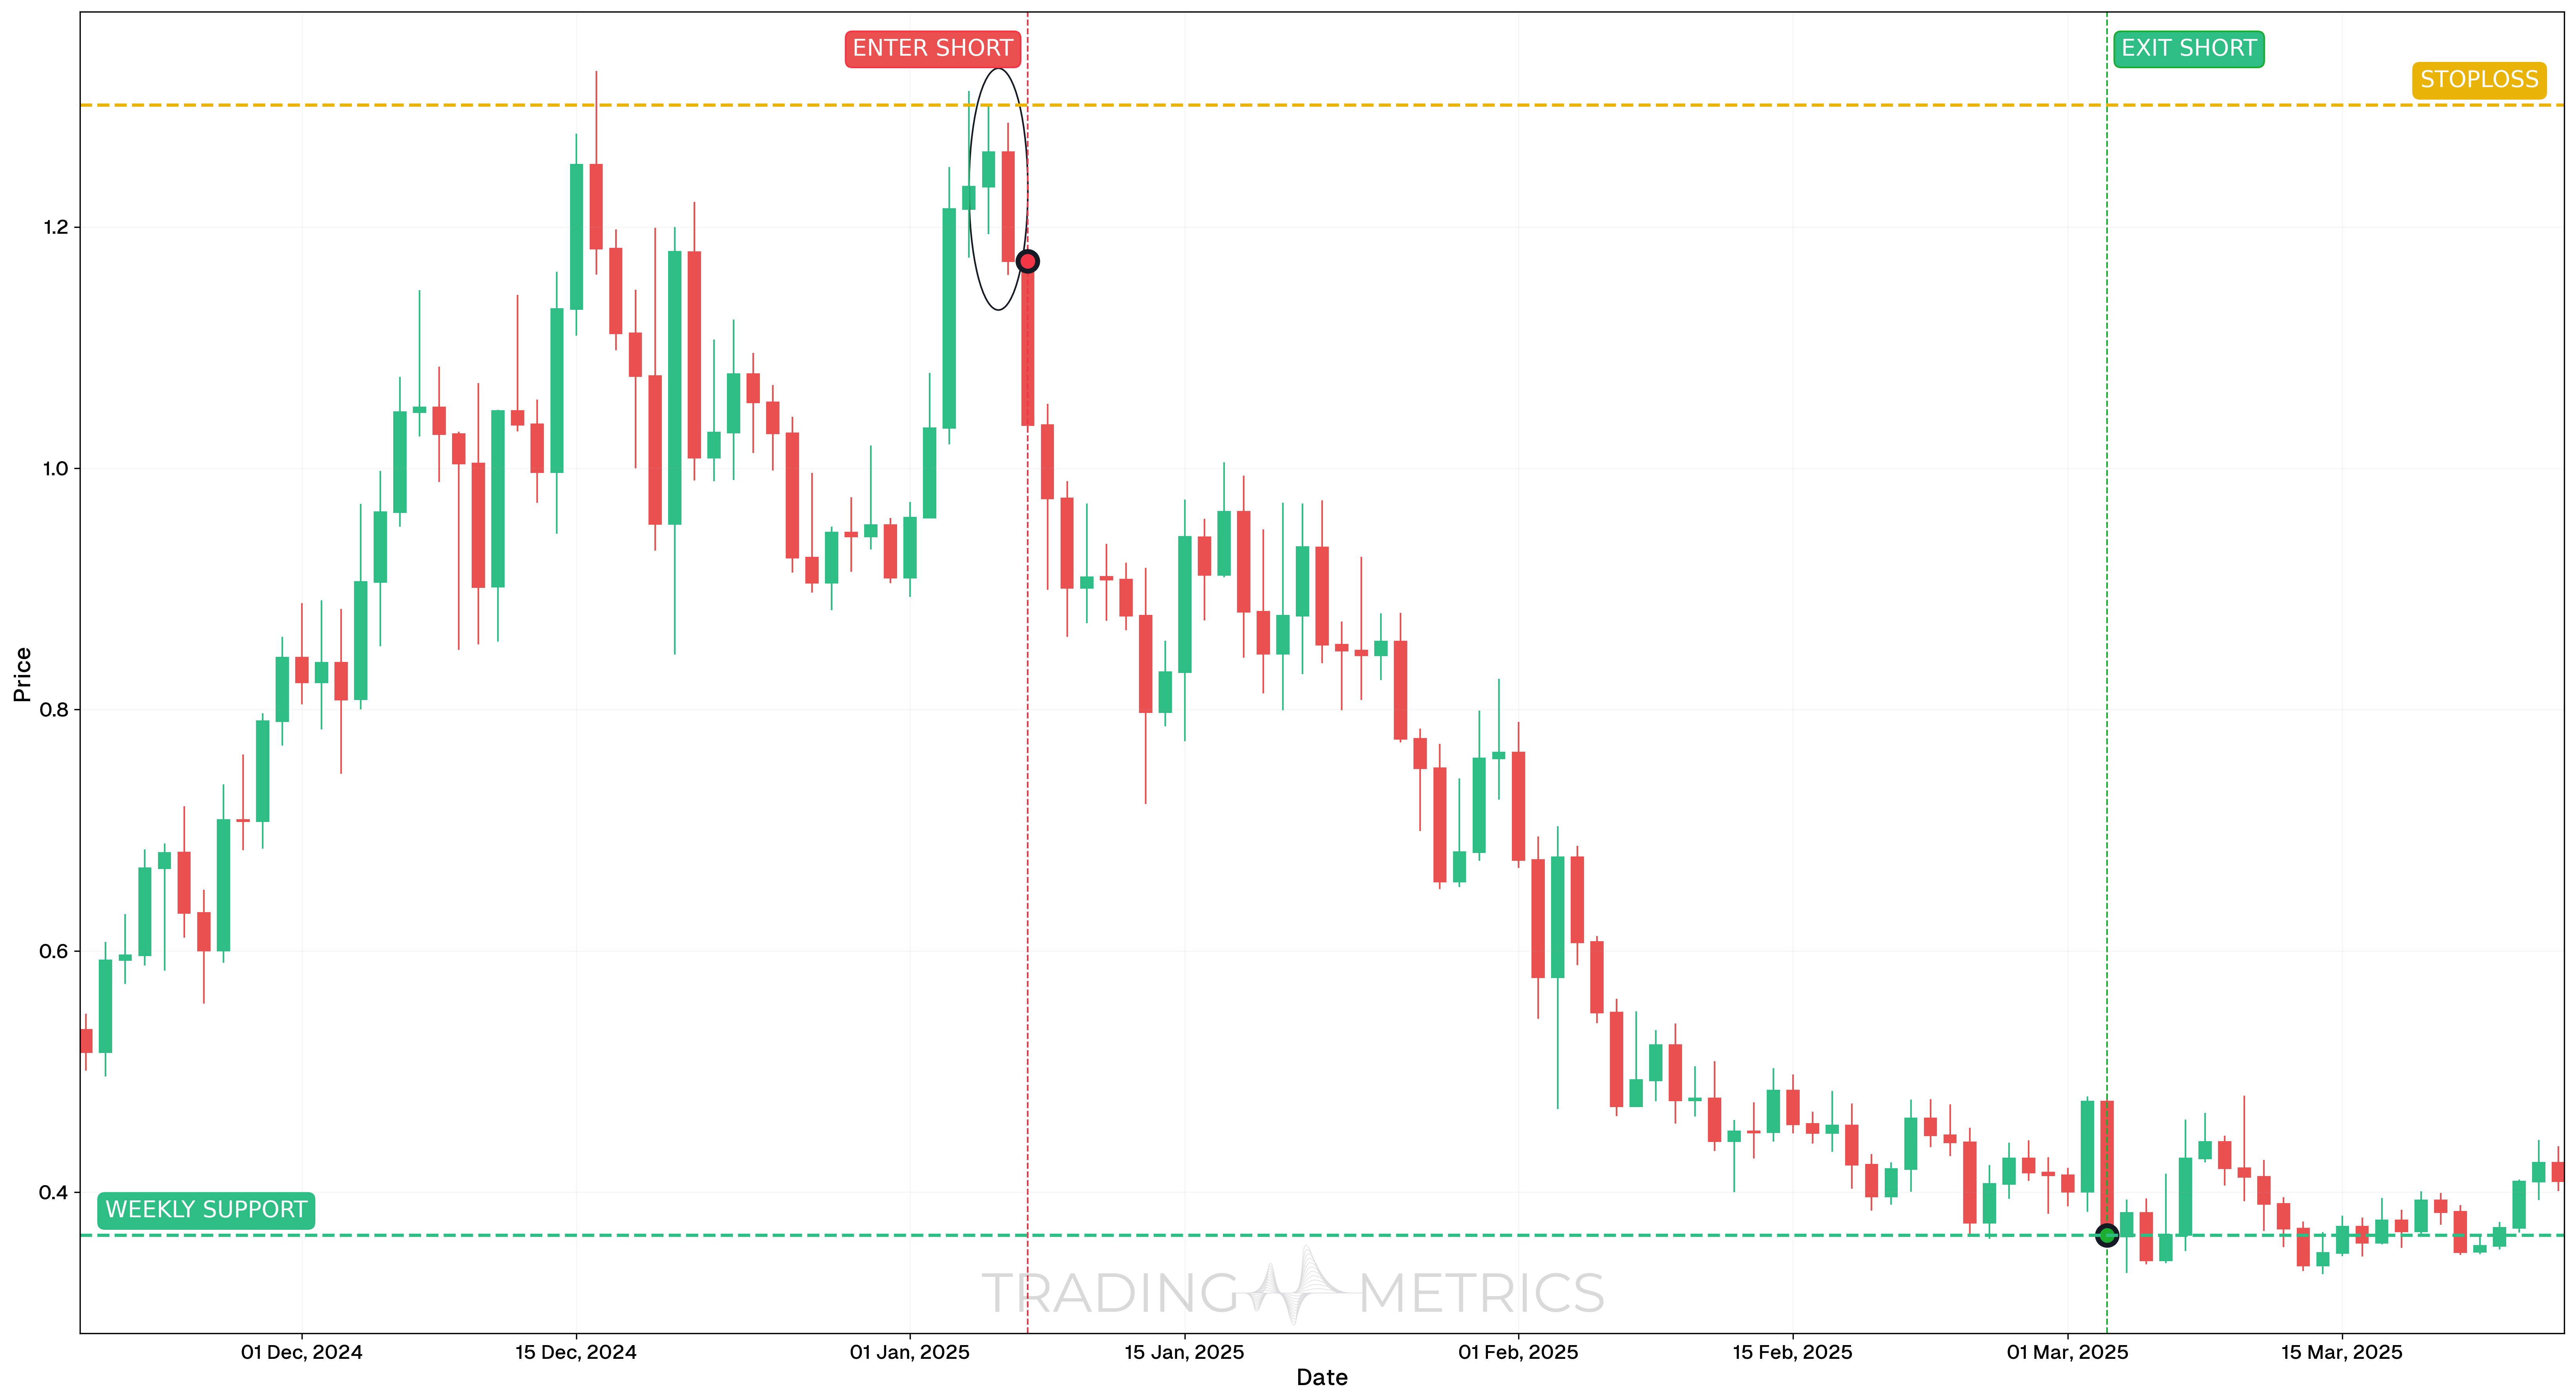
To illustrate how the Bearish Engulfing pattern can be used to enter a trade, we will choose the ENAUSDT Perp pair. This strong bearish reversal pattern appeared on the daily chart after a failed breakout attempt and clear signs of exhaustion.
Analysis
On January 7, 2025, ENAUSDT formed a clean Bearish Engulfing pattern, where a large red candle fully consumed the previous green candle’s body. This appeared after a second price peak, creating a visual Double Top. At the same time, momentum divergence reinforced the bearish bias.
Trade Setup
-
Entry: The short was entered on January 7, 2025, at $1.1716, just after the bearish engulfing candle confirmed weakness. The following confluence supported the setup:
-
Exit: The position was closed on March 3, 2025, at $0.3643, near a previous support and resistance zone that had acted as a demand base during earlier price action.
-
Outcome: The Bearish Engulfing trade resulted in a sharp 68.9% drop, offering excellent downside capture with defined risk.
Risk Management
- Stop-Loss placement: The stop-loss was set at $1.301, just above the recent swing high and the bearish engulfing structure, where bearish invalidation would occur.
- Position sizing: Trade size was calculated using a 2% capital risk model, adjusted to the risk distance between entry and stop.
- Risk-Reward Ratio: The trade achieved a Risk-Reward Ratio of 1:6.24, offering a high-reward setup with clean technical invalidation.
- Volatility Consideration: The setup emerged after a volatility squeeze, followed by rapid expansion on breakdown, which accelerated the move to the downside.
- Adaptive Exit Strategy: A trailing stop above lower highs or profit scaling near Fibonacci extensions could be applied depending on risk preference.
Volume Bite: A volume spike on the bearish engulfing candle sinks the pattern into a bearish turn.
Pre-Trade Checklist
Swallow the Proof: Pair the pattern with volume spikes and indicators like RSI to dodge fakes and sink your odds.
Key Points
- Candle Contrast: A small bullish candle followed by a larger bearish one boosts reliability - similar sizes dilute it.
- Time Frame: Bites hardest on daily or weekly charts after uptrends.
- Combine with Indicators: Use moving averages or RSI to confirm the reversal.
- Breakout Confirmation: The second candle’s close below the first’s open sets the turn - don’t jump too soon.
- Price Target: Measure the bearish engulfing candle height or use support levels for a target below the close.
- Risk Management: Set a stop-loss above the bearish engulfing high to limit losses if it fails.
Wait for the Swallow: Acting before the second candle closes risks a swallowed trap - let it engulf.
Conclusion
The Bearish Engulfing pattern is a trader’s sharp tool for catching bearish reversals. Its two-candle takeover, paired with volume, RSI, and moving averages, can sink big gains. Whether in crypto, stocks, or forex, this pattern hones your edge. Stay alert, manage your risk, and let the bearish engulfing form - that swift swallow could plunge into a winning trade.
Frequently Asked Questions
Quick answers based on this page's topic.
This two-candle pattern occurs when a large bearish candle completely 'swallows' the body of the preceding bullish candle. It represents a total regime shift where sellers have not only absorbed all remaining buying demand but have aggressively driven the price lower in a single session.
Traders often project the vertical height of the engulfing candle downward from the entry point to set a primary profit target. This objective approach ensures you capture the momentum generated by the reversal before the price hits major historical support zones.
Yes. A Bearish Engulfing pattern accompanied by a significant spike in volume is much more reliable. High volume confirms that institutional distribution is occurring, signaling that the reversal is supported by 'smart money' rather than just a random fluctuation in price.
A Bearish Engulfing candle closes below the previous candle's open, fully engulfing its body. A Dark Cloud Cover only closes into the upper half of the previous candle's body without fully engulfing it. Bearish Engulfing is considered the stronger reversal signal because the seller takeover is more decisive.
Yes. In parabolic or momentum-driven rallies, a single Bearish Engulfing candle may be quickly absorbed by the next wave of buyers. Traders should watch for follow-through on the next candle and use the pattern's high as an invalidation level for their stop-loss to manage this risk.