Daily Return: A Core Metric for Volatility and Risk Analysis
Think of the daily return as your investment’s performance dashboard, a real-time indicator of how your asset is faring in the ever-changing financial markets. It captures the percentage change in the asset’s value from one trading day to the next, offering a concise snapshot of its short-term movement. Much like a car’s dashboard highlights key metrics like speed and fuel levels, the daily return provides critical insights that help you navigate the fast-paced world of trading with confidence. Whether you’re tracking momentum, identifying trends, or simply staying informed, this metric equips you with the feedback needed to make timely, data-driven decisions and stay ahead of the curve.
The key to trading success is emotional discipline. If intelligence were the key, there would be a lot more people making money trading.
- Victor Sperandeo
How to Calculate Daily Return?
To calculate the daily return, you use the following formula:
Where:
- is the asset’s price at the beginning of the trading day.
- is the asset’s price at the end of the trading day.
Consistency Beats Luck: Daily returns might fluctuate, but disciplined strategies compound over time. Focus on steady growth, not overnight riches.
Importance of Daily Return in Trading
Daily returns play a critical role in trading for several reasons. They provide immediate feedback, allowing traders to quickly assess their gains or losses from one trading day to the next. They also help gauge volatility frequent large daily returns can signal high volatility, which may indicate potential risks or opportunities in the market. Additionally, daily returns aid in strategy adjustment by offering insights into short-term performance, enabling traders to fine-tune their trading strategies effectively.
Data is Your Compass: Analyze your daily returns to spot patterns and refine strategies. Every trade is a data point in your success story.
Daily Return Insights
Daily return insights provide a comprehensive overview of market fluctuations over specific periods. By analyzing daily percentage changes in asset prices, these insights offer valuable information on trends, volatility, and potential opportunities or risks. For Dogecoin, the data from January 2021 reveals significant price variations, showcasing the dynamic and volatile nature of the cryptocurrency market.
Insights: Jan 1-10, 2021
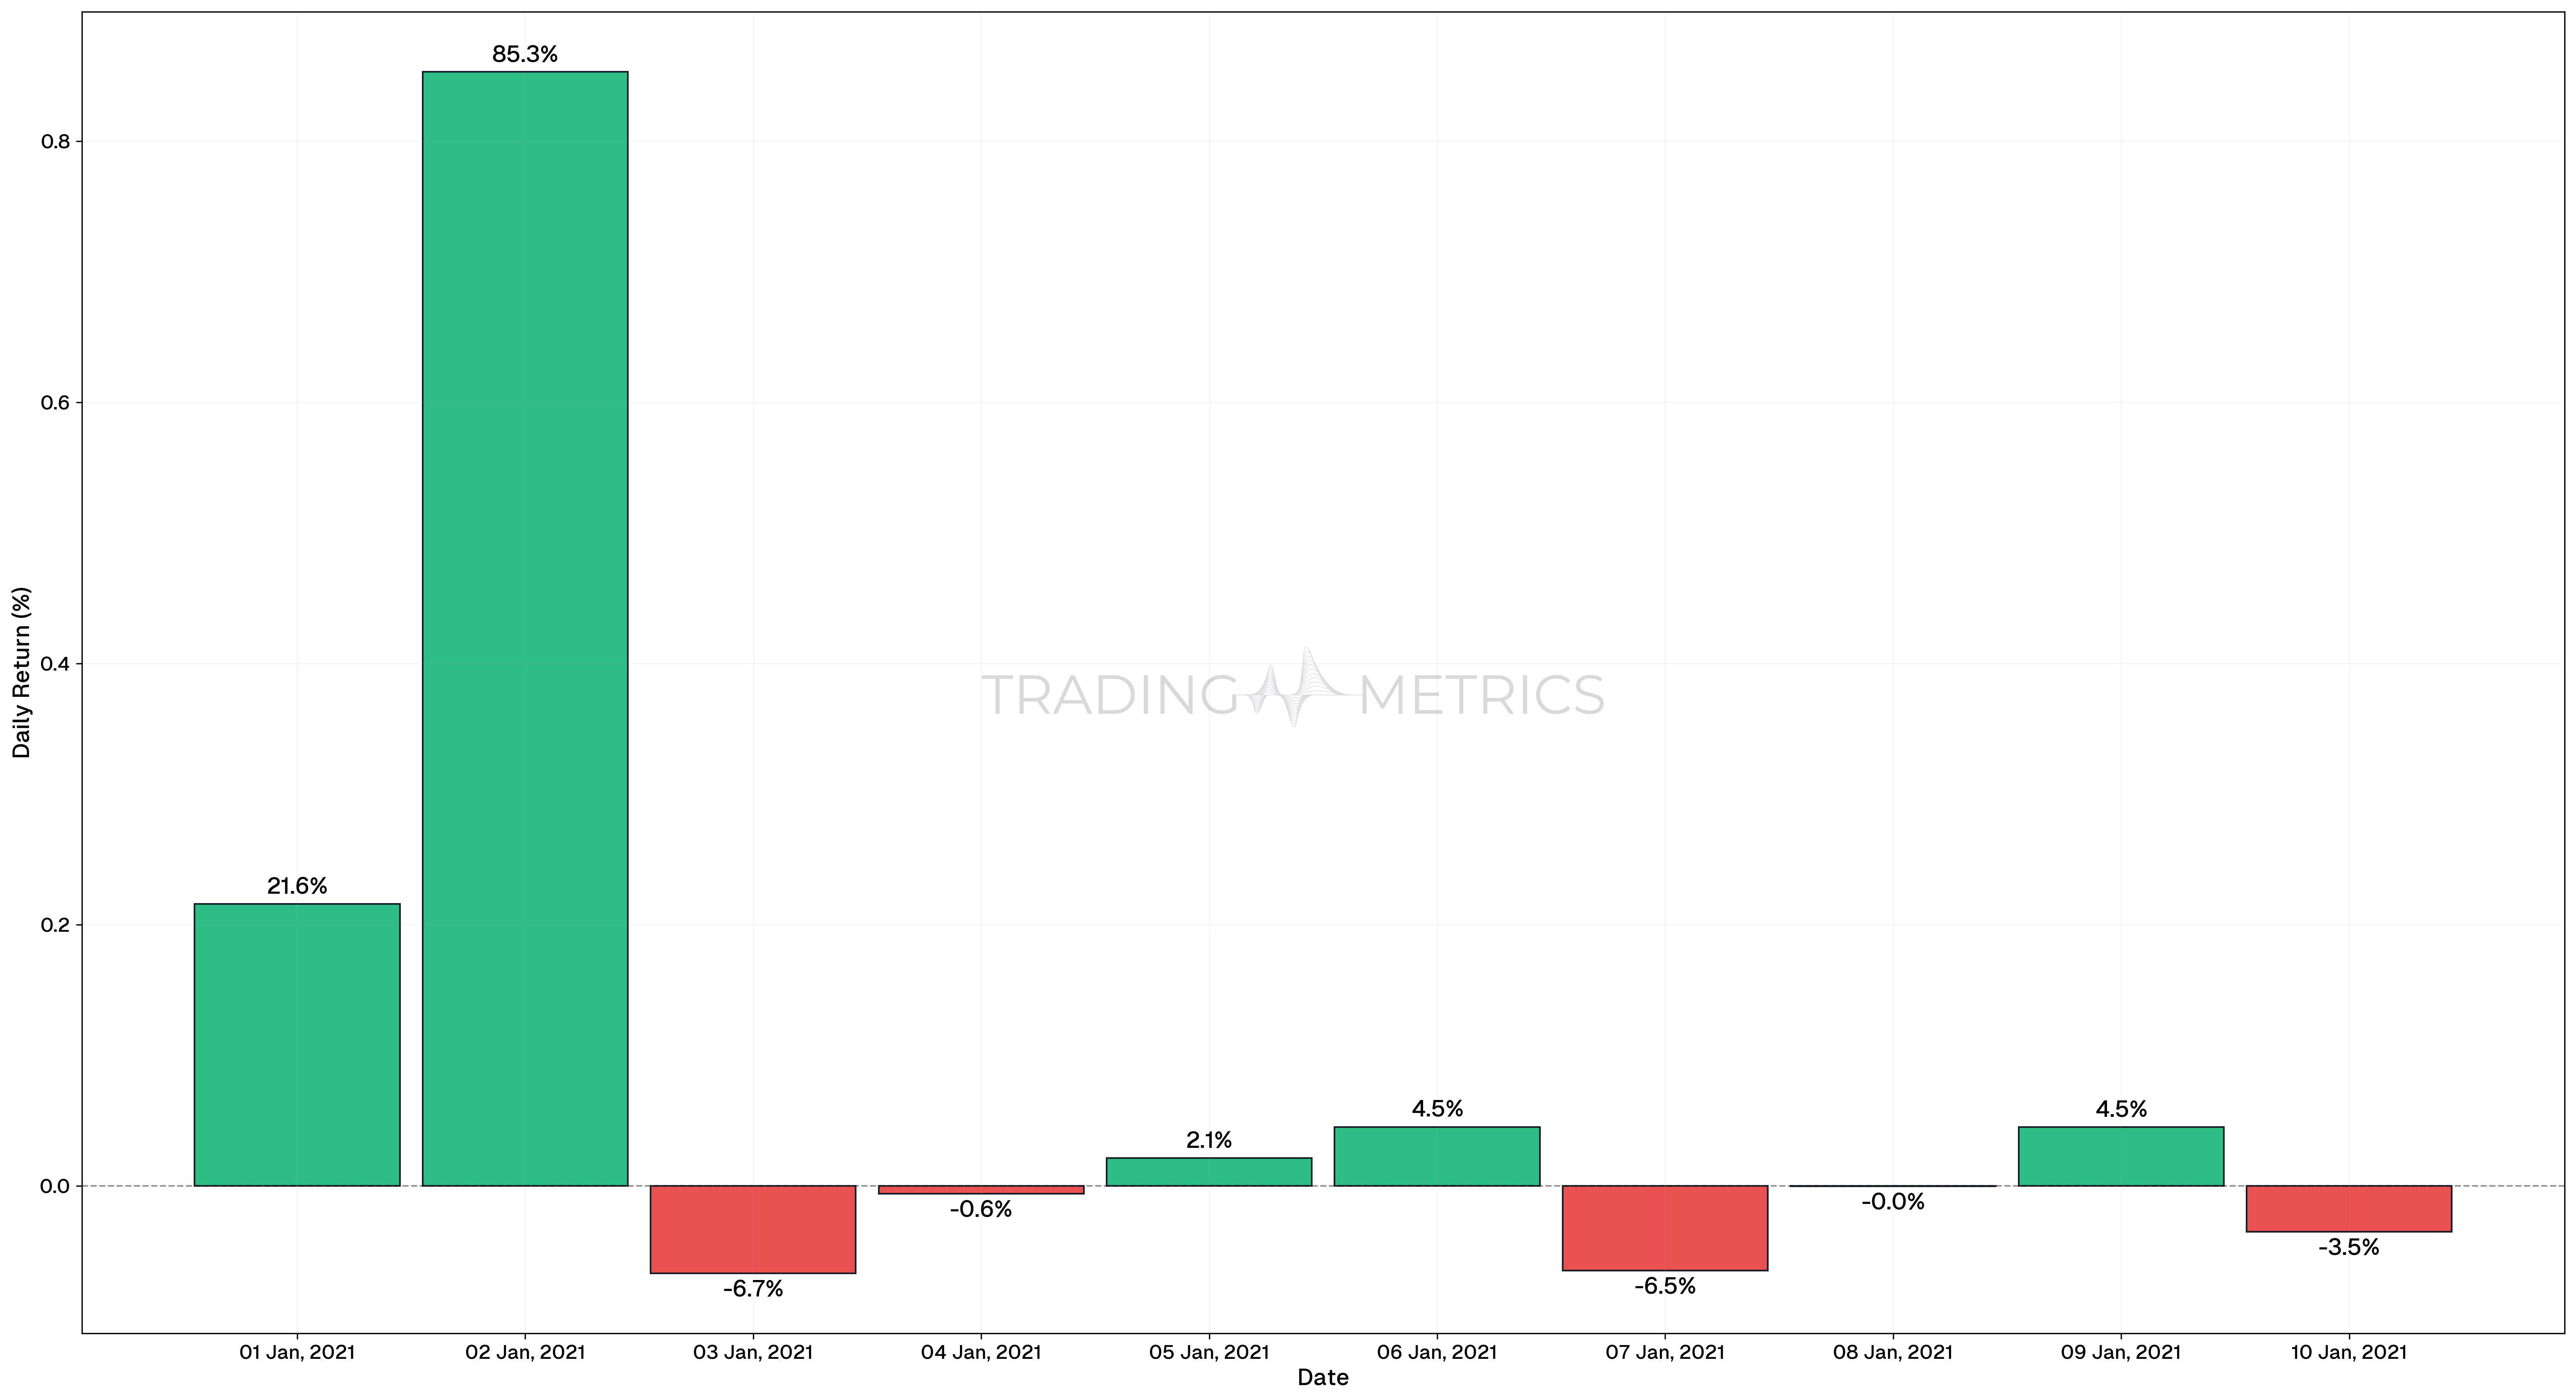
During the period from January 1 to January 10, 2021, the daily returns varied significantly:
| Date | Description |
|---|---|
1 Jan, 2021 | The daily return was approximately 21.60%, indicating a significant positive price movement. |
2 Jan, 2021 | The daily return was approximately 85.32%, indicating a very significant positive price movement. |
3 Jan, 2021 | The daily return was around -6.70%, showing a notable decrease in price. |
This pattern of fluctuations continued, reflecting the volatility in Dogecoin’s price during this period.
Insights: Jan 11-20, 2021
| Date | Description |
|---|---|
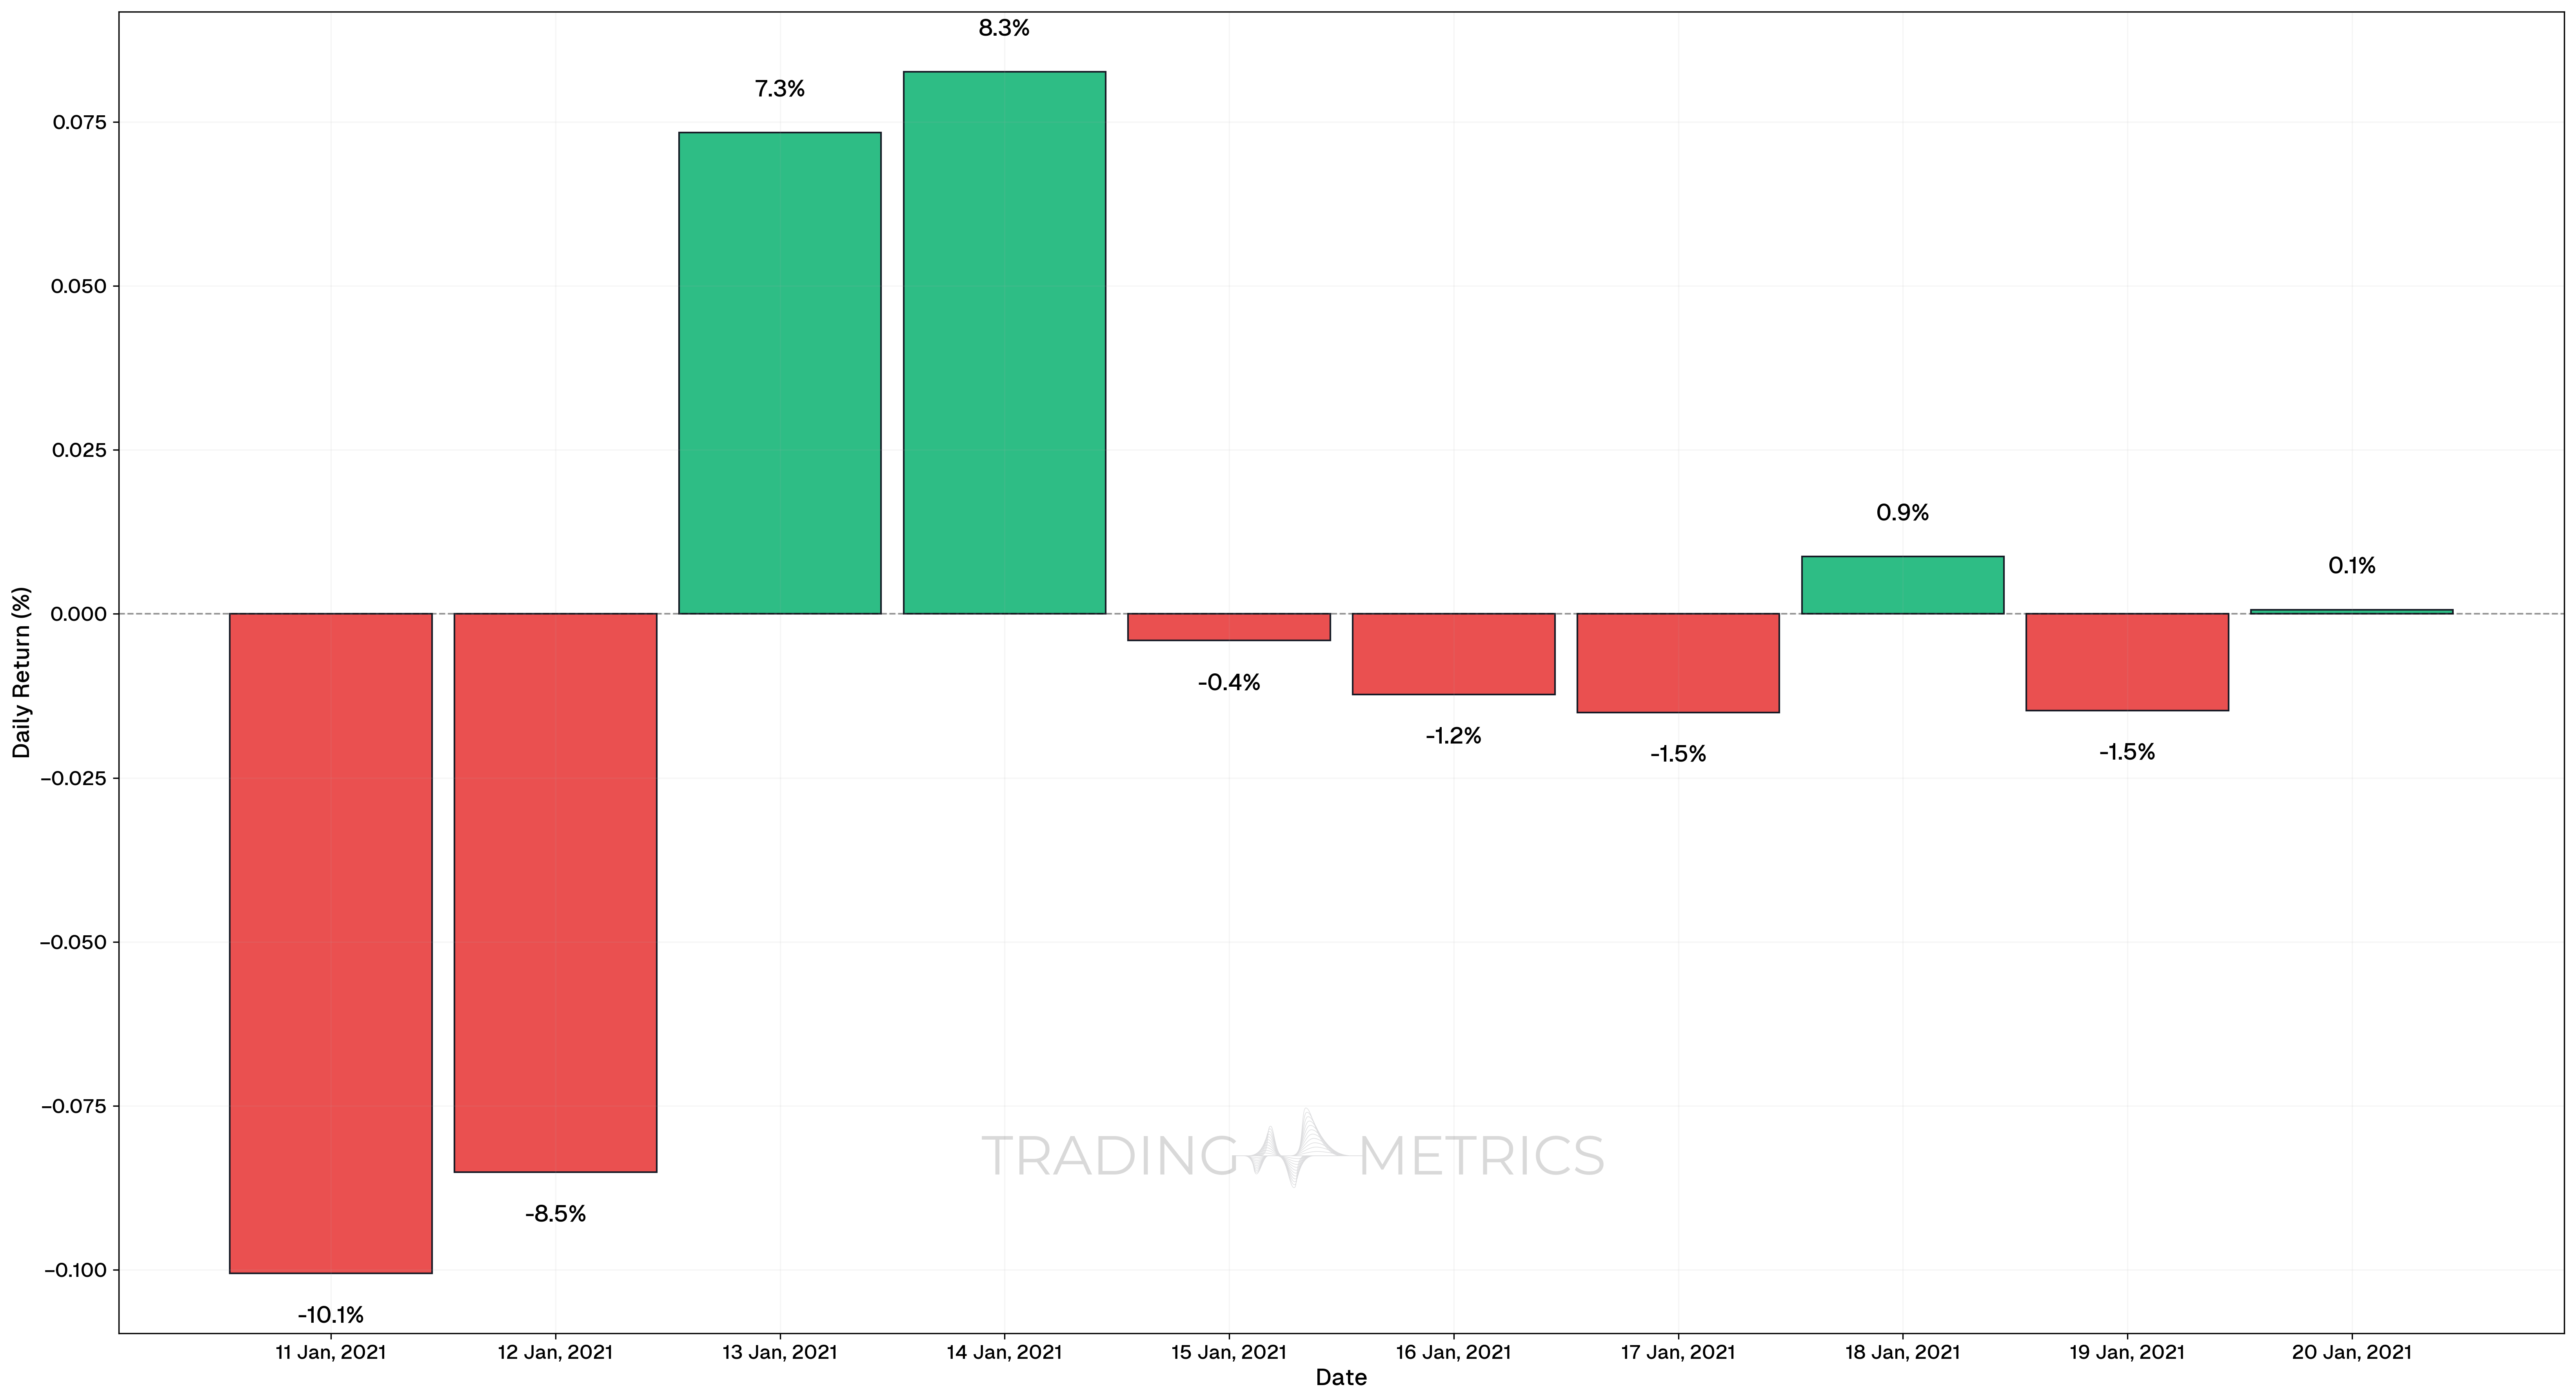
11 Jan, 2021 | Saw a negative return of about -10.05%, indicating a substantial price decrease. |
12 Jan, 2021 | Had a negative return of -8.51%. |
13 Jan, 2021 | Had a positive return of 7.34%, reflecting a notable price increase. |
14 Jan, 2021 | Had a positive return of 8.27%. |
20 Jan, 2021 | Had a very small return of 0.07%. |
The volatility continued with alternating positive and negative returns, underscoring the dynamic nature of the market.
Insights: Jan 21-31, 2021
| Date | Description |
|---|---|
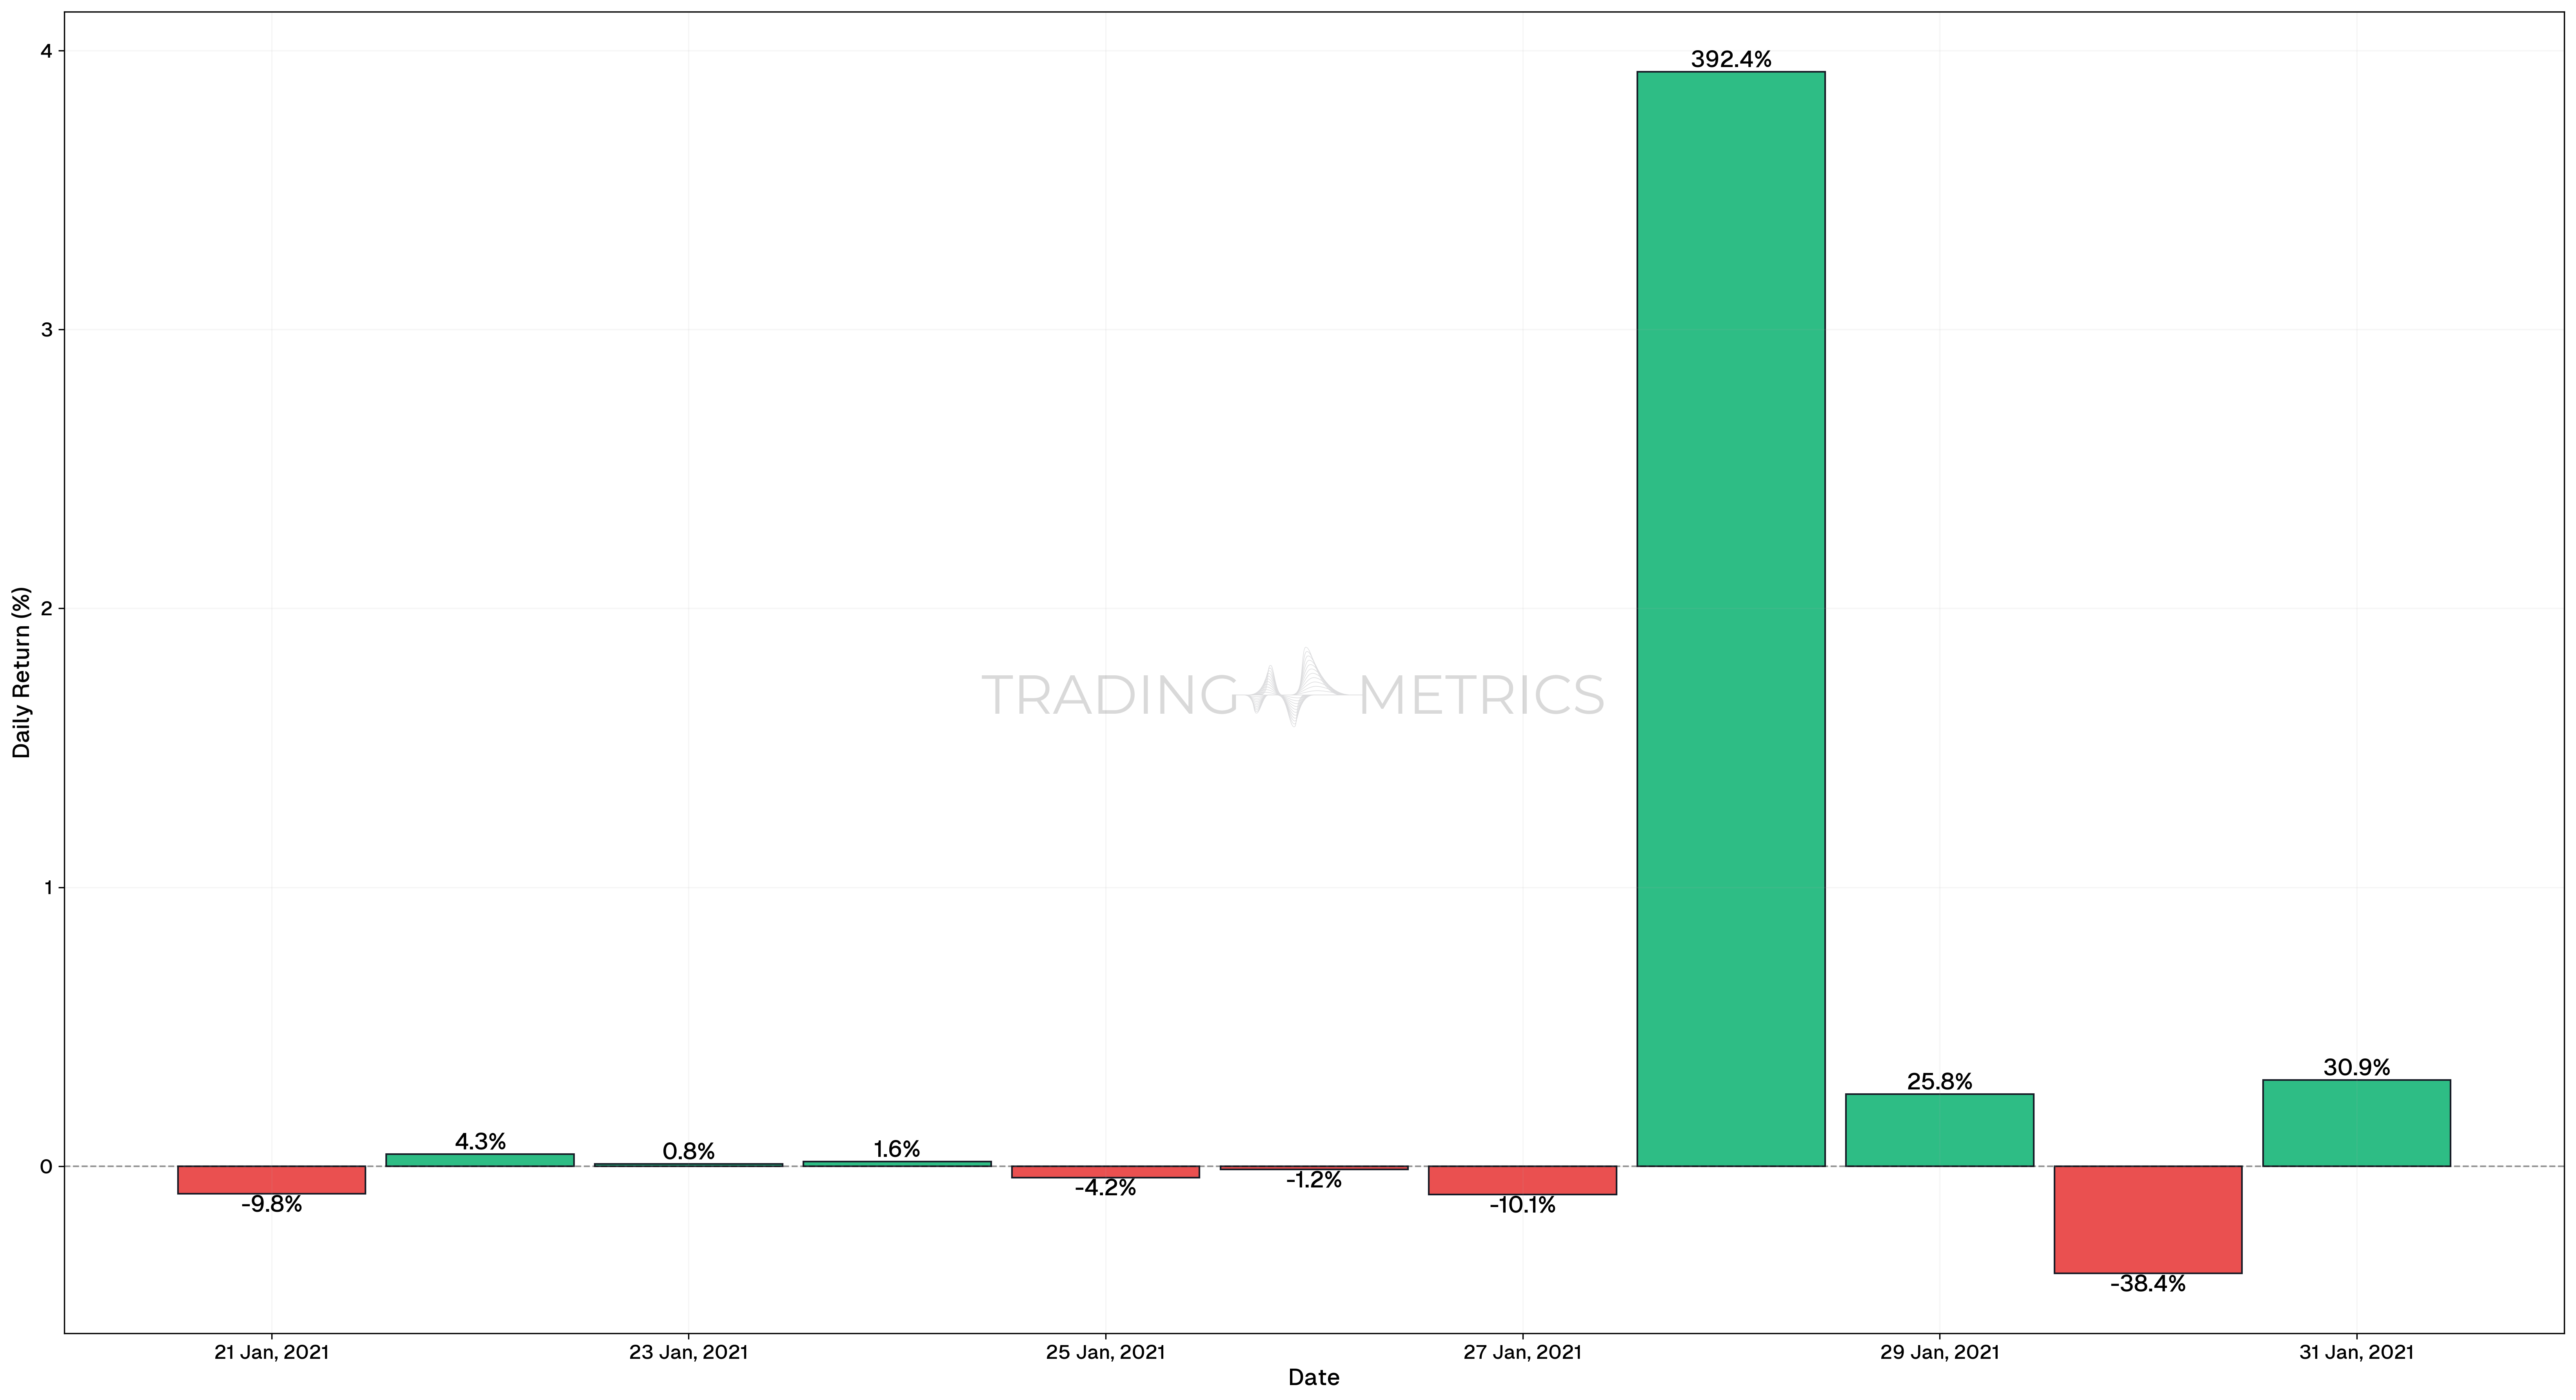
21 Jan, 2021 | Experienced a negative return of -9.84%. |
22 Jan, 2021 | Had a positive return of 4.28%. |
27 Jan, 2021 | Had a significant negative return of -10.12%. |
28 Jan, 2021 | Saw a very high positive return of 392.41%. |
30 Jan, 2021 | Experienced a negative return of -38.44%. |
31 Jan, 2021 | Had a positive return of 30.93%. |
Overall, this period exhibited a mix of high positive and negative returns, highlighting the continued volatility in Dogecoin’s price.
Analysis: The daily return analysis for Dogecoin during January 2021 reveals a highly volatile market with significant fluctuations in daily returns. These charts and the corresponding data emphasize the importance of understanding daily returns for making informed trading decisions. By analyzing daily returns, traders can better gauge market trends, identify periods of high volatility, and develop strategies to mitigate risks and capitalize on price movements.
Risk Management is Key: Your daily return is only as good as your ability to protect it. Never risk more than you can afford to lose.
Combining Daily Return with Other Tools
Daily return can be even more powerful when combined with other tools:
-
Moving Averages: Smooth out daily fluctuations to identify trends.
-
Volatility Measures (e.g., Standard Deviation): Assess the risk associated with an asset.
-
Relative Strength Index (RSI): Evaluate if an asset is overbought or oversold.
Patience Pays Off: Chasing high daily returns often leads to rash decisions. Stick to your plan and let the market work for you.
Key Points
- High-Frequency Insight: Daily return measures an investment’s performance over a single trading day, providing granular data for active monitoring.
- Volatility Indicator: Daily returns are more prone to fluctuations, offering valuable insights into an asset’s short-term risk and volatility.
- Building Blocks for Trends: Use daily returns to identify patterns, momentum shifts, or anomalies that can inform broader trend analysis.
- Short-Term Strategy Evaluation: Ideal for assessing the effectiveness of intraday or short-term trading strategies.
- Sensitivity to News and Events: Daily returns often reflect immediate market reactions to news, earnings reports, or economic data.
- Noise vs. Signal: High daily variability can obscure longer-term trends; interpret daily returns within the context of a broader time frame.
- Comparative Benchmarking: Analyze daily returns against index movements or peer assets to evaluate relative performance.
- Risk Management Tool: Monitor daily losses or gains to adjust positions and maintain portfolio risk levels.
- Cumulative Impact: While individual daily returns are small, their compounding effect can significantly impact long-term performance.
Conclusion
Daily returns are a cornerstone of understanding an asset’s short-term performance, serving as a critical tool for both novice and experienced investors. For day traders, they provide real-time insights into market movements, enabling quick decision-making and the ability to capitalize on fleeting opportunities. Beyond the immediate horizon, analyzing daily returns over time can reveal broader market trends, offering a deeper understanding of volatility, momentum, and potential turning points in the market. Whether you’re fine-tuning a trading strategy or building a long-term investment plan, daily returns are a powerful metric that bridges the gap between short-term action and long-term insight, making them indispensable for navigating the complexities of financial markets.
Frequently Asked Questions
Quick answers based on this page's topic.
The daily return acts as a high-frequency feedback loop. For intraday traders, it is the primary measure of their daily performance and risk control. Tracking daily fluctuations helps identify if a trader is over-leveraging or if market conditions have shifted significantly.
Daily standard deviation measures how much your daily returns vary from your average. A high standard deviation indicates a 'bumpy' equity curve with frequent large swings, suggesting that your position sizing may be too aggressive for the asset's current volatility.
Yes. A string of daily returns with low variance often indicates a trending or quiet market. Conversely, when daily returns begin to swing wildly between large positives and negatives, it signals an increase in volatility and a potential change in market regime.