Inverted Hammer Pattern: How to Spot Trend Reversals
The Inverted Hammer pattern is an uplifting bullish reversal signal in technical analysis, often appearing at the trough of a downtrend. Picture it as an upside-down hammer - a candlestick with a small body, a long upper shadow, and little to no lower shadow - hinting at a lift after a bearish descent. When this pattern forms, it’s a subtle yet promising sign that bearish momentum is losing steam, offering traders a chance to buy or go long as an uptrend begins to emerge.
How to Identify the Inverted Hammer Pattern in Trading
The Inverted Hammer is a bullish reversal candlestick. It appears after a downtrend when buyers attempt a rally, face resistance, but still leave a signal of potential strength. Confirmation is essential for this setup. Here’s the step-by-step guide.
Start with the Big Picture
This pattern shows up after a downtrend. Sellers remain dominant, but the Inverted Hammer signals that buyers are testing the waters for a reversal.
Trace the Candle’s Shape
The candlestick has three defining traits:
- Small body: Open and close are near each other.
- Long upper shadow: At least twice the body’s size, showing buyers pushed higher but met resistance.
- Little to no lower shadow: Reflects limited new selling pressure.
Zero in on the Confirmation Level
The confirmation level is the high of the Inverted Hammer. A close above this level signals that buyers are taking control.
Watch the Breakout
The bullish trigger comes when the next candle closes above the Inverted Hammer’s high, ideally with a strong bullish candle. That’s your entry point. (Confirmation is critical for this pattern.)
Check Volume for Additional Confirmation
Volume behavior can strengthen the signal:
- Increases on the Inverted Hammer day, showing an attempted rally.
- Spikes on the confirming bullish candle, reinforcing the upward reversal.
Rise Reach: Measure the upper shadow height or use nearby resistance levels to project a realistic price target upward from the confirmation close.
How to Trade the Inverted Hammer Pattern (Trading Example)
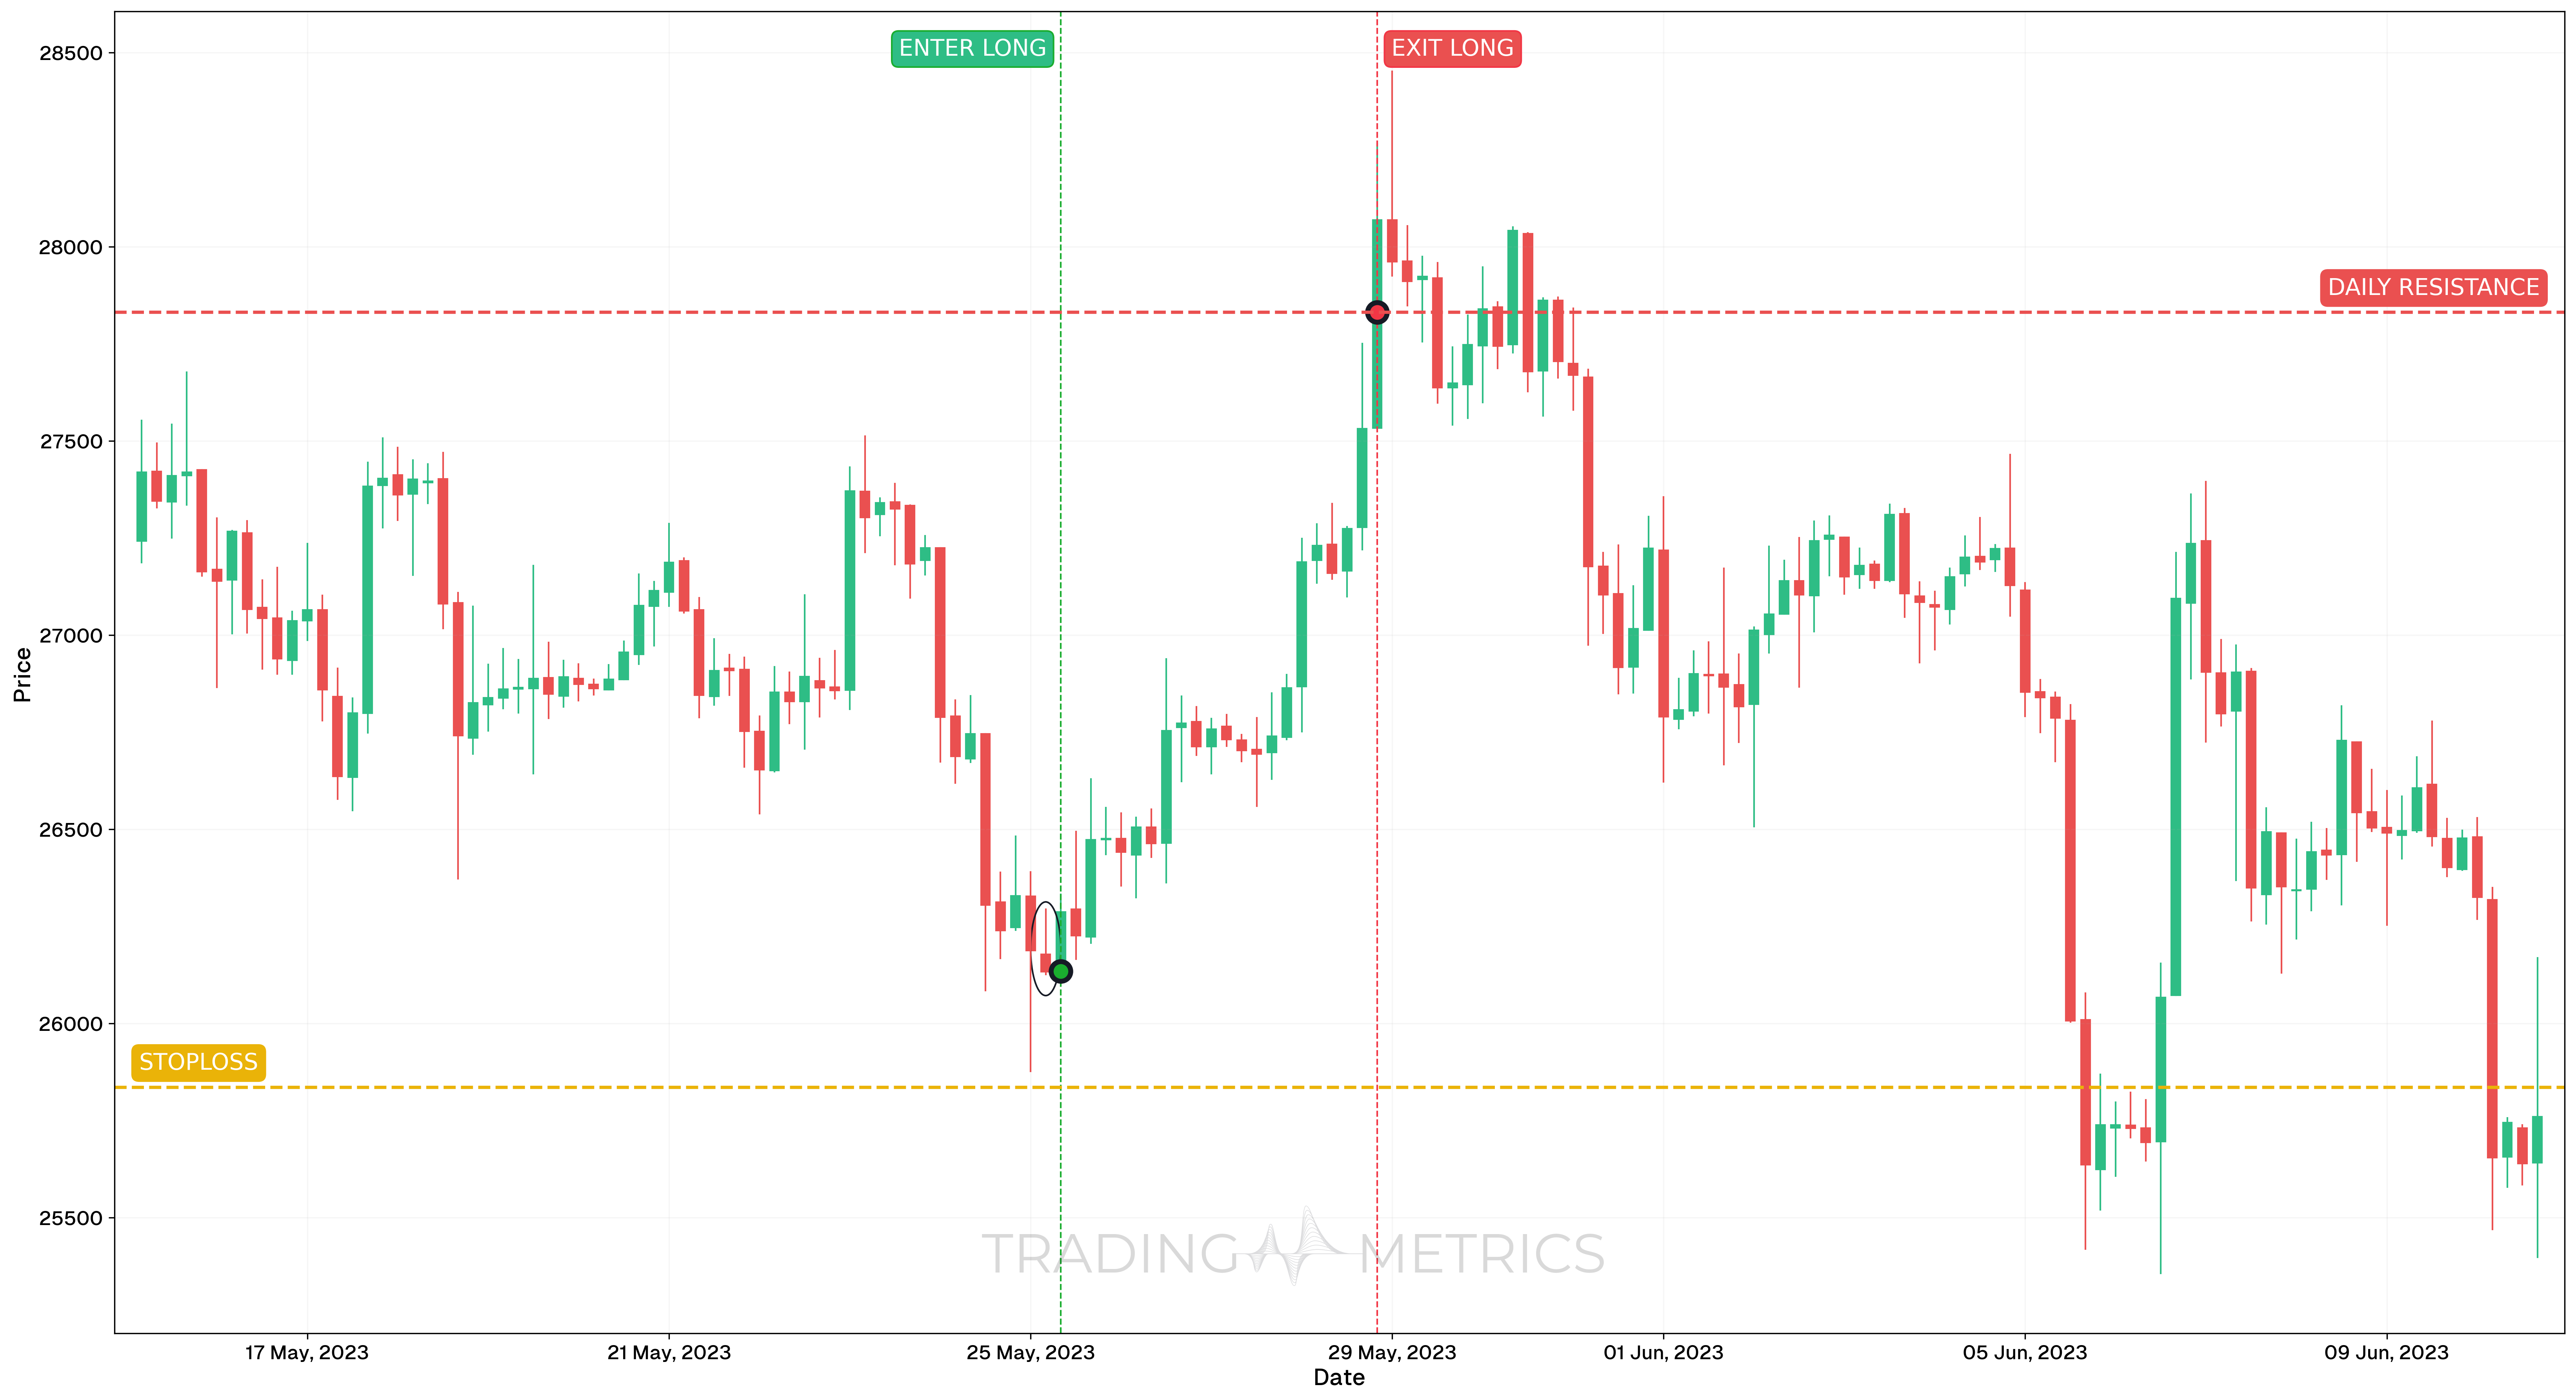
To illustrate how the Inverted Hammer pattern can be used to enter a trade, we will choose the BTCUSDC pair. This setup developed on the 4-hour chart during a short-term downtrend, presenting a potential reversal signal near oversold conditions.
Analysis
On May 25, 2023, BTCUSDC formed an Inverted Hammer candlestick after a sharp intraday decline. The long upper wick and small body at the bottom of the range hinted at a possible bullish reversal, especially since the candle appeared after a period of selling pressure and momentum indicators began to shift.
Trade Setup
-
Entry: The trade was entered on May 25, 2023, at 08:00, at $26,134.22, following the confirmation of the Inverted Hammer. Entry was supported by:
-
Exit: The position was closed on May 28, 2023, at 20:00, at $27,831.03, as price reached a zone that had acted as strong support in the past and now functioned as resistance, providing a logical profit-taking level.
-
Outcome: The Inverted Hammer pattern delivered a 6.48% gain in just over three days, with clean confirmation and structure-based exit.
Risk Management
- Stop-Loss placement: The stop-loss was placed at $25,835.83, just below the low of the Inverted Hammer and recent structure, protecting the trade against further breakdown.
- Position sizing: A 2% capital risk model was applied, with sizing based on the entry-to-stop-loss distance.
- Risk-Reward Ratio: The trade achieved a Risk-Reward Ratio of 1:5.69, making this a high-efficiency, short-duration reversal setup.
- Volatility Consideration: The pattern emerged after a sharp decline and expansion in Volatility, followed by contraction into the reversal zone. This shift supported a low-risk, high-reward reversal attempt.
- Adaptive Exit Strategy: While this example closed at local resistance, traders could use a trailing stop below higher lows to extend profits in strong reversals.
Volume Reach: A volume spike on the Inverted Hammer day, followed by bullish follow-through, lifts the pattern into a bullish surge.
Pre-Trade Checklist
Lift the Proof: Pair the pattern with volume spikes and indicators like RSI to dodge fakes and boost your odds.
Key Points
- Shadow Clarity: A long upper shadow with a small body boosts reliability - short shadows dilute it.
- Time Frame: Lifts strongest on daily or weekly charts after downtrends.
- Combine with Indicators: Use moving averages or RSI to confirm the reversal.
- Breakout Confirmation: A close above the Inverted Hammer’s high sets the turn - don’t jump on the pattern alone.
- Price Target: Measure the upper shadow height or use resistance levels for a target above the close.
- Risk Management: Set a stop-loss below the Inverted Hammer’s low to limit losses if it fails.
Wait for the Lift: Acting before confirmation risks a Hammer trap - let the reversal reach up.
Conclusion
The Inverted Hammer pattern is a trader’s uplifting tool for catching bullish reversals. Its upside-down reach, paired with volume, RSI, and moving averages, can lift into big gains. Whether in crypto, stocks, or forex, this pattern sharpens your edge. Stay alert, manage your risk, and let the Inverted Hammer stretch - that rejected peak could rise into a winning trade.
Frequently Asked Questions
Quick answers based on this page's topic.
It represents 'Buyer Infiltration.' After a long decline, buyers enter with enough force to drive prices significantly higher (forming the long upper wick). Although sellers push it back down by the close, the evidence of bullish liquidity at the lows suggests the downtrend is failing.
Visually, they are identical; the difference is context. A Shooting Star occurs after an uptrend (bearish), while an Inverted Hammer occurs after a downtrend (bullish). In a downtrend, the 'failed rally' is actually a sign that buyers are finally putting up a fight.
The pattern requires a bullish confirmation candle. Traders wait for the next candle to close above the Inverted Hammer's body. This confirms that the buyers who appeared during the upper wick's rally have returned and are now successfully driving the new uptrend.