Understanding the Spinning Top Candlestick: Market Indecision Signal
The Spinning Top is a neutral candlestick pattern that signals indecision in the market. It features a small body with equal upper and lower shadows, reflecting a temporary balance between buyers and sellers. After a downtrend, it can suggest selling pressure is weakening, hinting at a potential upward shift if confirmed. After an uptrend, it may signal buying pressure is fading, pointing to a possible downward move. Its true direction depends on context and confirmation from the next candles.
How to Identify the Spinning Top Pattern in Trading
Spotting a Spinning Top means recognizing a candlestick with a small body and balanced upper and lower shadows, showing indecision between buyers and sellers. After a downtrend, it can signal weakening bearish pressure and a potential bullish reversal if confirmed. After an uptrend, it may indicate fading bullish momentum and a possible bearish turn. Its direction always requires confirmation from subsequent price action. Here’s the step-by-step guide.
Understand the Basics of the Spinning Top Pattern
The Spinning Top is a neutral pattern indicating a standoff between buyers and sellers, appearing in various contexts:
- Bullish Scenario: Forms after a downtrend, suggesting bearish momentum may weaken, potentially leading to a reversal if confirmed upward.
- Bearish Scenario: Forms after an uptrend, indicating bullish momentum may falter, possibly signaling a reversal if confirmed downward.
Look for the Candlestick Shape in Price Movement
The pattern features a single candle:
- Spinning Top: A candlestick with a small body (open and close nearly equal), and roughly equal upper and lower shadows (each longer than the body) - price swings up and down before settling near the open, showing indecision.
Identify the Confirmation Level
- Bullish Scenario: The confirmation level is the high of the Spinning Top - a subsequent close above suggests a bullish shift.
- Bearish Scenario: The confirmation level is the low of the Spinning Top - a subsequent close below indicates a bearish shift.
Confirm the Pattern with a Follow-Up Close
- Bullish Scenario: A bullish signal triggers when the next candle closes above the Spinning Top’s high, often with a bullish candle, indicating a potential reversal. This is your entry point for a long trade.
- Bearish Scenario: A bearish signal triggers when the next candle closes below the Spinning Top’s low, often with a bearish candle, suggesting a potential reversal. This is your entry point for a short trade. (Note: Confirmation is critical due to the pattern’s neutrality.)
Check Volume for Extra Confidence
Volume often steady or modestly elevated, reflecting indecision, with spikes on confirmation adding weight.
- Bullish Scenario: A spike on confirmation with rising volume supports a bullish turn.
- Bearish Scenario: A spike on confirmation with rising volume reinforces a bearish turn. A volume surge in either case strengthens the directional signal.
Range Spin: Measure the shadow-to-shadow range and project it upward (bullish) or downward (bearish) from the confirmation close, or use nearby levels for a potential price target.
How to Trade the Spinning Top Pattern (Trading Example)
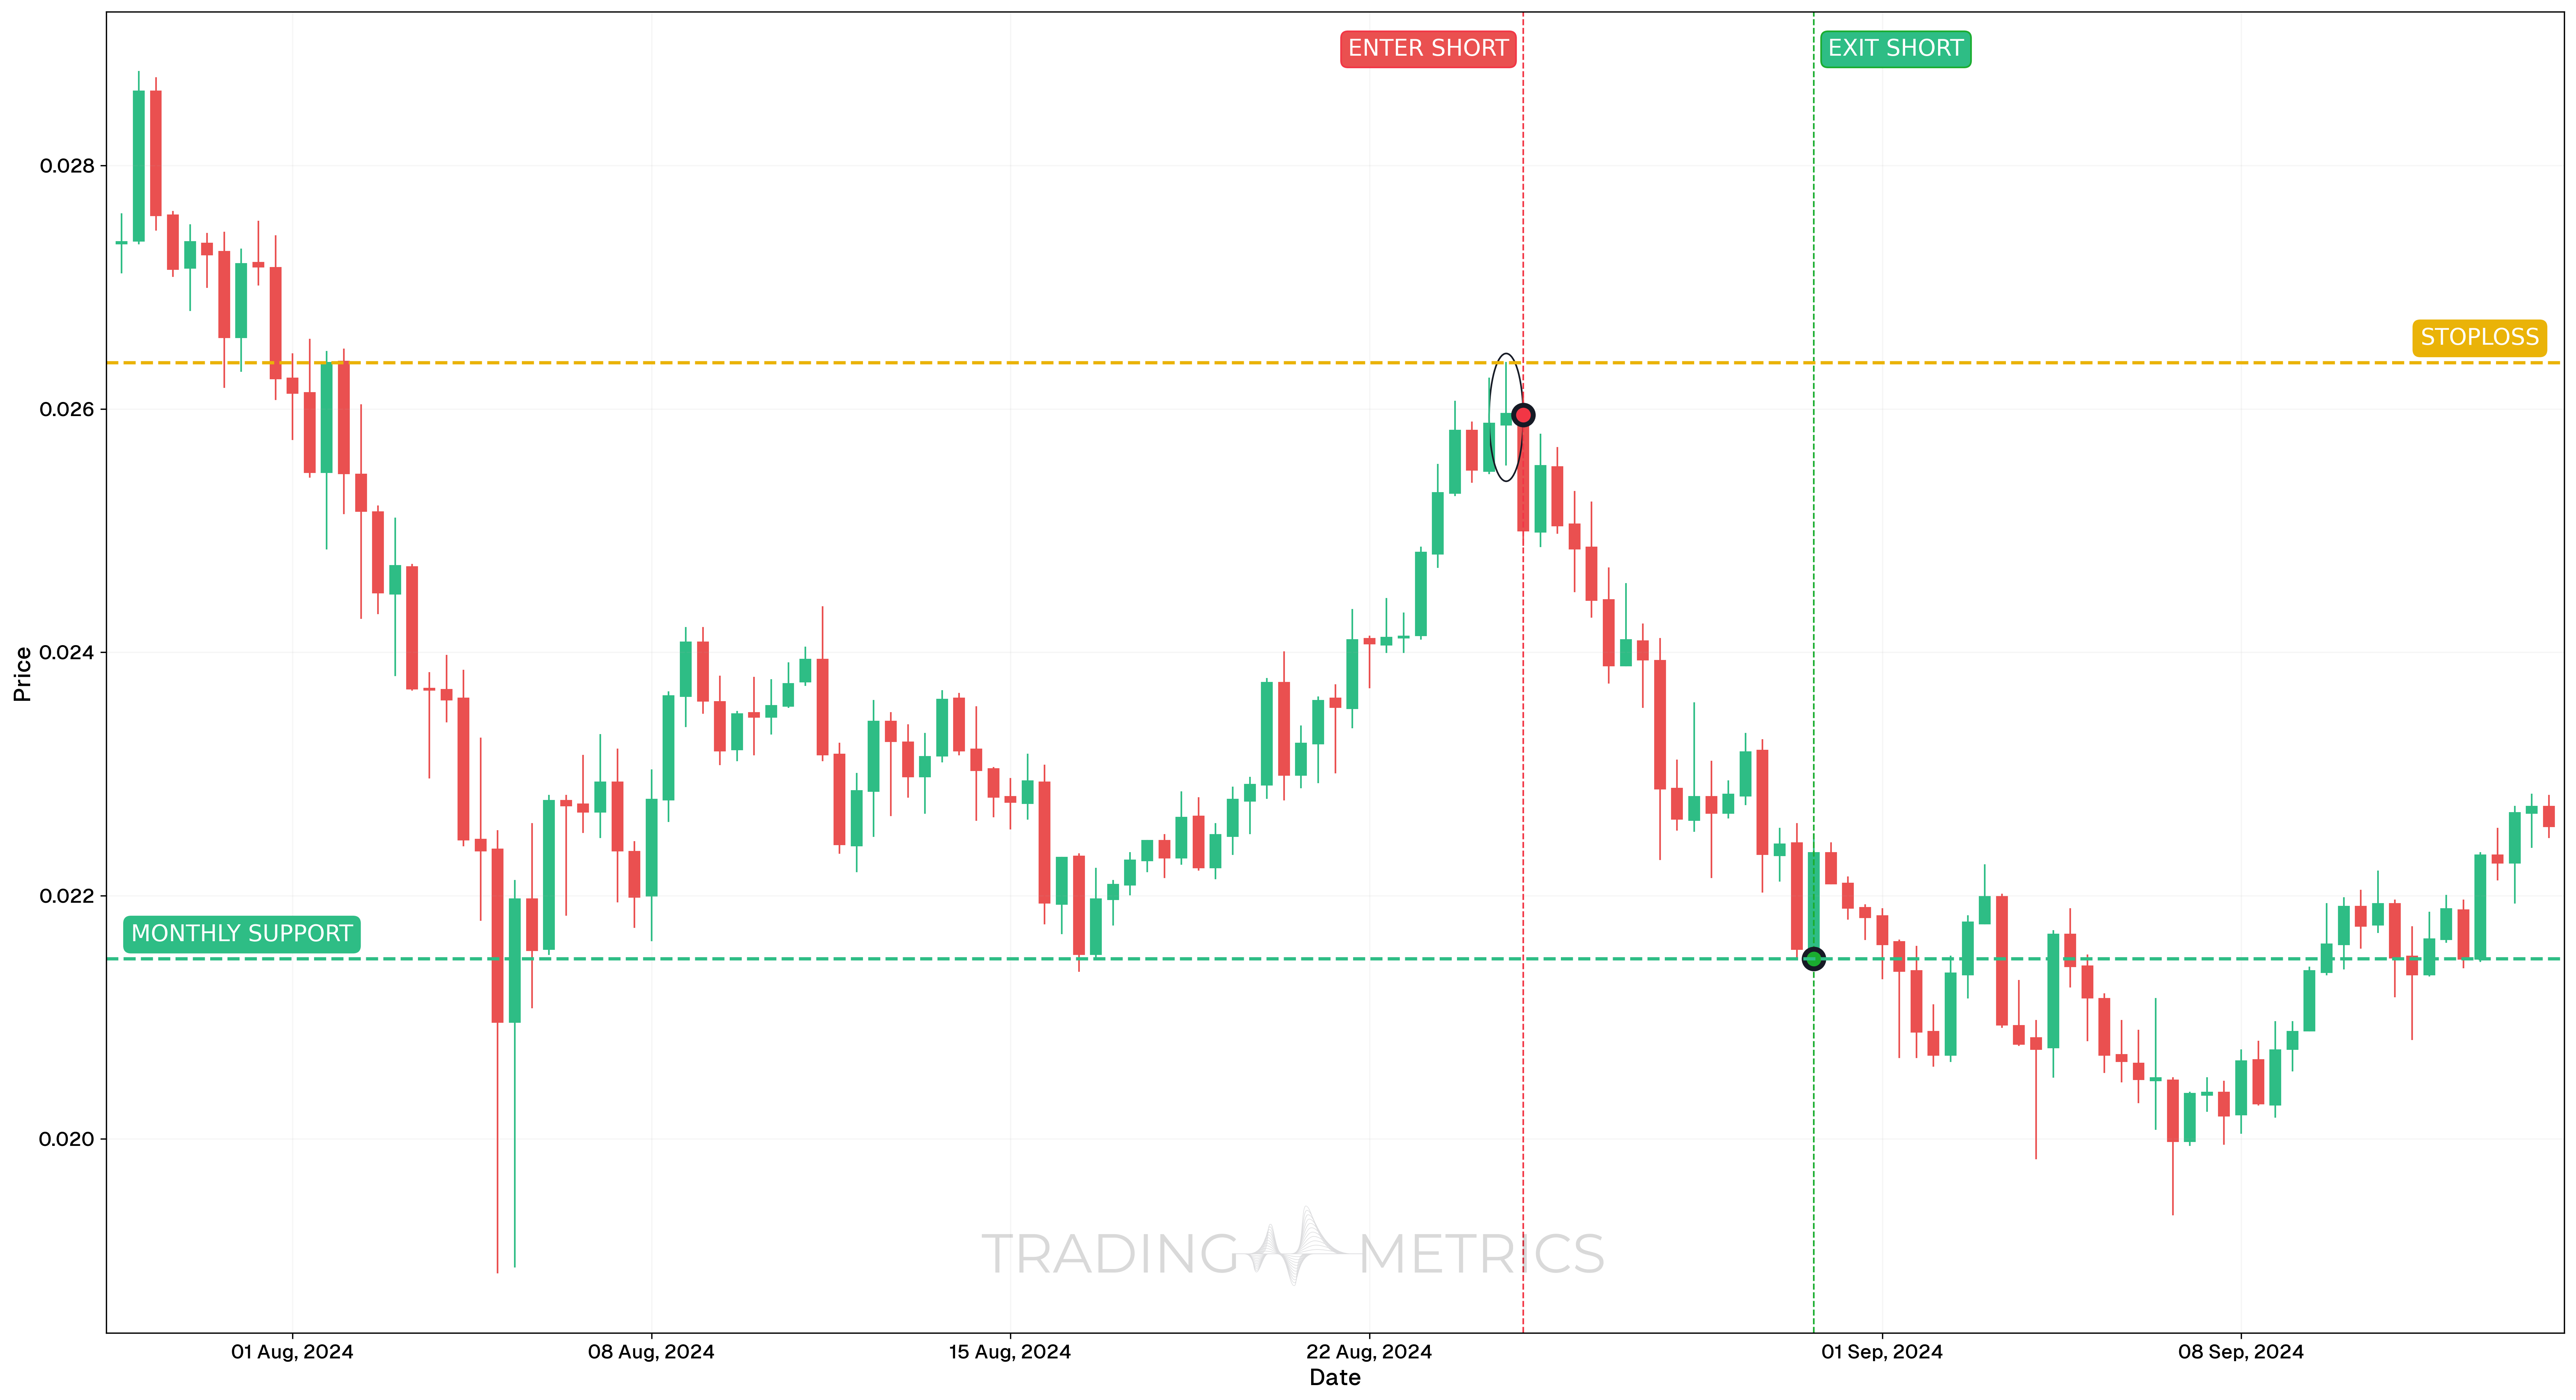
To illustrate how the Spinning Top pattern can be used to enter a trade, we will choose the VeChain USDT pair. This pattern formed on the 8-hour chart, offering a short setup following signs of momentum reversal after an overbought condition.
Analysis
On August 25, 2024, VeChain printed a Spinning Top candle after an extended bullish move. The small real body and presence of both upper and lower shadows reflected indecision in the market. However, the location of the pattern appearing after overbought readings added bearish weight to the setup.
Trade Setup
-
Entry: The trade was entered on August 25, 2024, at 00:00, at $0.02595, following confirmation from surrounding candles. Supporting confluence included:
-
Exit: The position was closed on August 30, 2024, at 16:00, at $0.02148, just above a previous support/resistance level where price had previously bounced. This was used as a reliable technical exit zone.
-
Outcome: The Spinning Top reversal resulted in a clean breakdown and a 17.3% drop, achieved within five days of entry.
Risk Management
- Stop-Loss placement: The stop-loss was placed at $0.02638, just above the high of the pattern formation, providing a tight invalidation level.
- Position sizing: The trade used a 2% capital risk model, with risk measured from entry to stop-loss.
- Risk-Reward Ratio: The trade produced a Risk-Reward Ratio of 1:10.40, making it a high-efficiency setup with strong momentum confirmation.
- Volatility Consideration: This pattern formed after expanding Volatility, and the tightening candle structure added strength to the reversal signal.
- Adaptive Exit Strategy: More conservative traders could have scaled out at multiple support zones or trailed stop-loss above lower highs to preserve gains dynamically.
Volume Turn: A volume spike on confirmation resolves the Spinning Top’s indecision into a directional move.
Pre-Trade Checklist
Prove the Spin: Combine the pattern with volume spikes and indicators like RSI to filter noise and enhance accuracy.
Key Points
- Shadow Balance: Roughly equal upper and lower shadows with a small body define the pattern - uneven shadows reduce its impact.
- Time Frame: Most effective on daily or weekly charts after trends.
- Combine with Indicators: Pair with moving averages or RSI to interpret direction.
- Breakout Confirmation: A close above (bullish) or below (bearish) the Spinning Top sets the turn - don’t act on the pattern alone.
- Price Target: Use the shadow range or key levels for a target in the confirmed direction.
- Risk Management: Set a stop-loss below (bullish) or above (bearish) the Spinning Top’s extreme to limit losses if it fails.
Wait for Clarity: Trading before confirmation risks misreading the neutral Spinning Top - let the direction emerge.
Conclusion
The Spinning Top pattern is a trader’s tool for spotting potential shifts. Its balanced form, backed by volume, RSI, and moving averages, can signal opportunity. Whether in crypto, stocks, or forex, this pattern offers insight. Stay patient, manage risk, and wait for resolution - that moment of indecision could spin into a profitable trade.
Frequently Asked Questions
Quick answers based on this page's topic.
A Spinning Top represents 'Balanced Indecision.' It features a small real body with long upper and lower shadows of roughly equal length. This shows that while there was significant price movement in both directions, the market returned to its origin, proving that the trend has hit a wall of opposing force.
The difference is the real body. A Doji has virtually no body (Open = Close), indicating a total lack of progress. A Spinning Top has a small but visible body, indicating that a small amount of progress was made despite the volatility. Both are neutral patterns, but the Spinning Top suggests slightly more active 'churning' within the session.
Once the market breaks out of the Spinning Top's range, the most technical stop-loss is placed at the opposite extreme of the candle. For example, if price breaks above the high, the stop goes below the low. This ensures that if the 'indecision' resumes and the price returns to the candle's range, your risk is capped.