Trading the Bullish Bat Pattern: Precise Reversal Strategies
The Bullish Bat Pattern is a refined bullish reversal signal in technical analysis, often swooping in at the tail of a downtrend. Picture it as a harmonic flight - price tracing an XABCD structure with precise Fibonacci ratios - lifting off from bearish lows to bullish heights. When this pattern forms, it’s an elegant sign that bearish momentum is waning, offering traders a chance to buy or go long as an uptrend takes wing.
How to Identify the Bullish Bat Pattern in Trading
The Bullish Bat Pattern is one of the most reliable harmonic reversal setups. Imagine the market falling in a graceful arc - a sharp decline, a rebound, another dip — but finally landing on a precise Fibonacci level where sellers run out of steam. That’s where buyers step in. Here’s how to spot it:
Start with the Big Picture
This pattern forms after a steady downtrend. Sellers have been pressing lower, but the harmonic ratios reveal where exhaustion is likely to occur. The Bullish Bat helps you identify the turning point before the rally begins.
Trace the XABCD Legs
The structure is built from five defined swings, each confirmed by strict Fibonacci proportions. Spotting these ratios is key to validating the setup.
- XA: The initial sharp decline that sets the stage.
- AB: A rebound upward into 38.2%–50% of XA.
- BC: A pullback down, retracing 38.2%–88.6% of AB but never breaking below X.
- CD: The final leg upward into the 88.6% retracement of XA, often aligning with the 161.8%–261.8% projection of BC.
- D Point: Completion of the Bullish Bat, where the reversal zone is formed and buyers prepare to take control.
Zero in on D (the Reversal Zone)
D is the critical pivot. It aligns with the 88.6% retracement of XA and the BC projection zone, forming a strong confluence area. If price stabilizes here, it signals potential exhaustion of the downtrend.
Watch the Breakout
Confirmation comes when price rebounds from D and drives higher.
- A strong bullish candle or
- A close above B
Both confirm that buyers have stepped in and the reversal is underway. That’s your entry trigger.
Check Volume for Additional Confirmation
Volume gives the final piece of validation by revealing genuine buying pressure.
- Strong volume on XA (sellers in control).
- Weakening on AB and BC (momentum fading).
- Then a spike at D as buyers push back hard.
When that surge appears, the Bullish Bat’s reversal is real.
Rise Wing: Measure the XA leg height and project it upward from D, or target the 38.2% or 61.8% retracement of XD for a realistic price target.
How to Trade the Bullish Bat Pattern (Trading Example)
To illustrate the use of the Bullish Bat harmonic pattern in real-world conditions, we’ll analyze a setup on the ETHUSDT Perpetual pair using the 3-day chart. This trade setup combined multiple layers of confluence, including harmonic structure, support levels, and classic candlestick confirmation.
Analysis
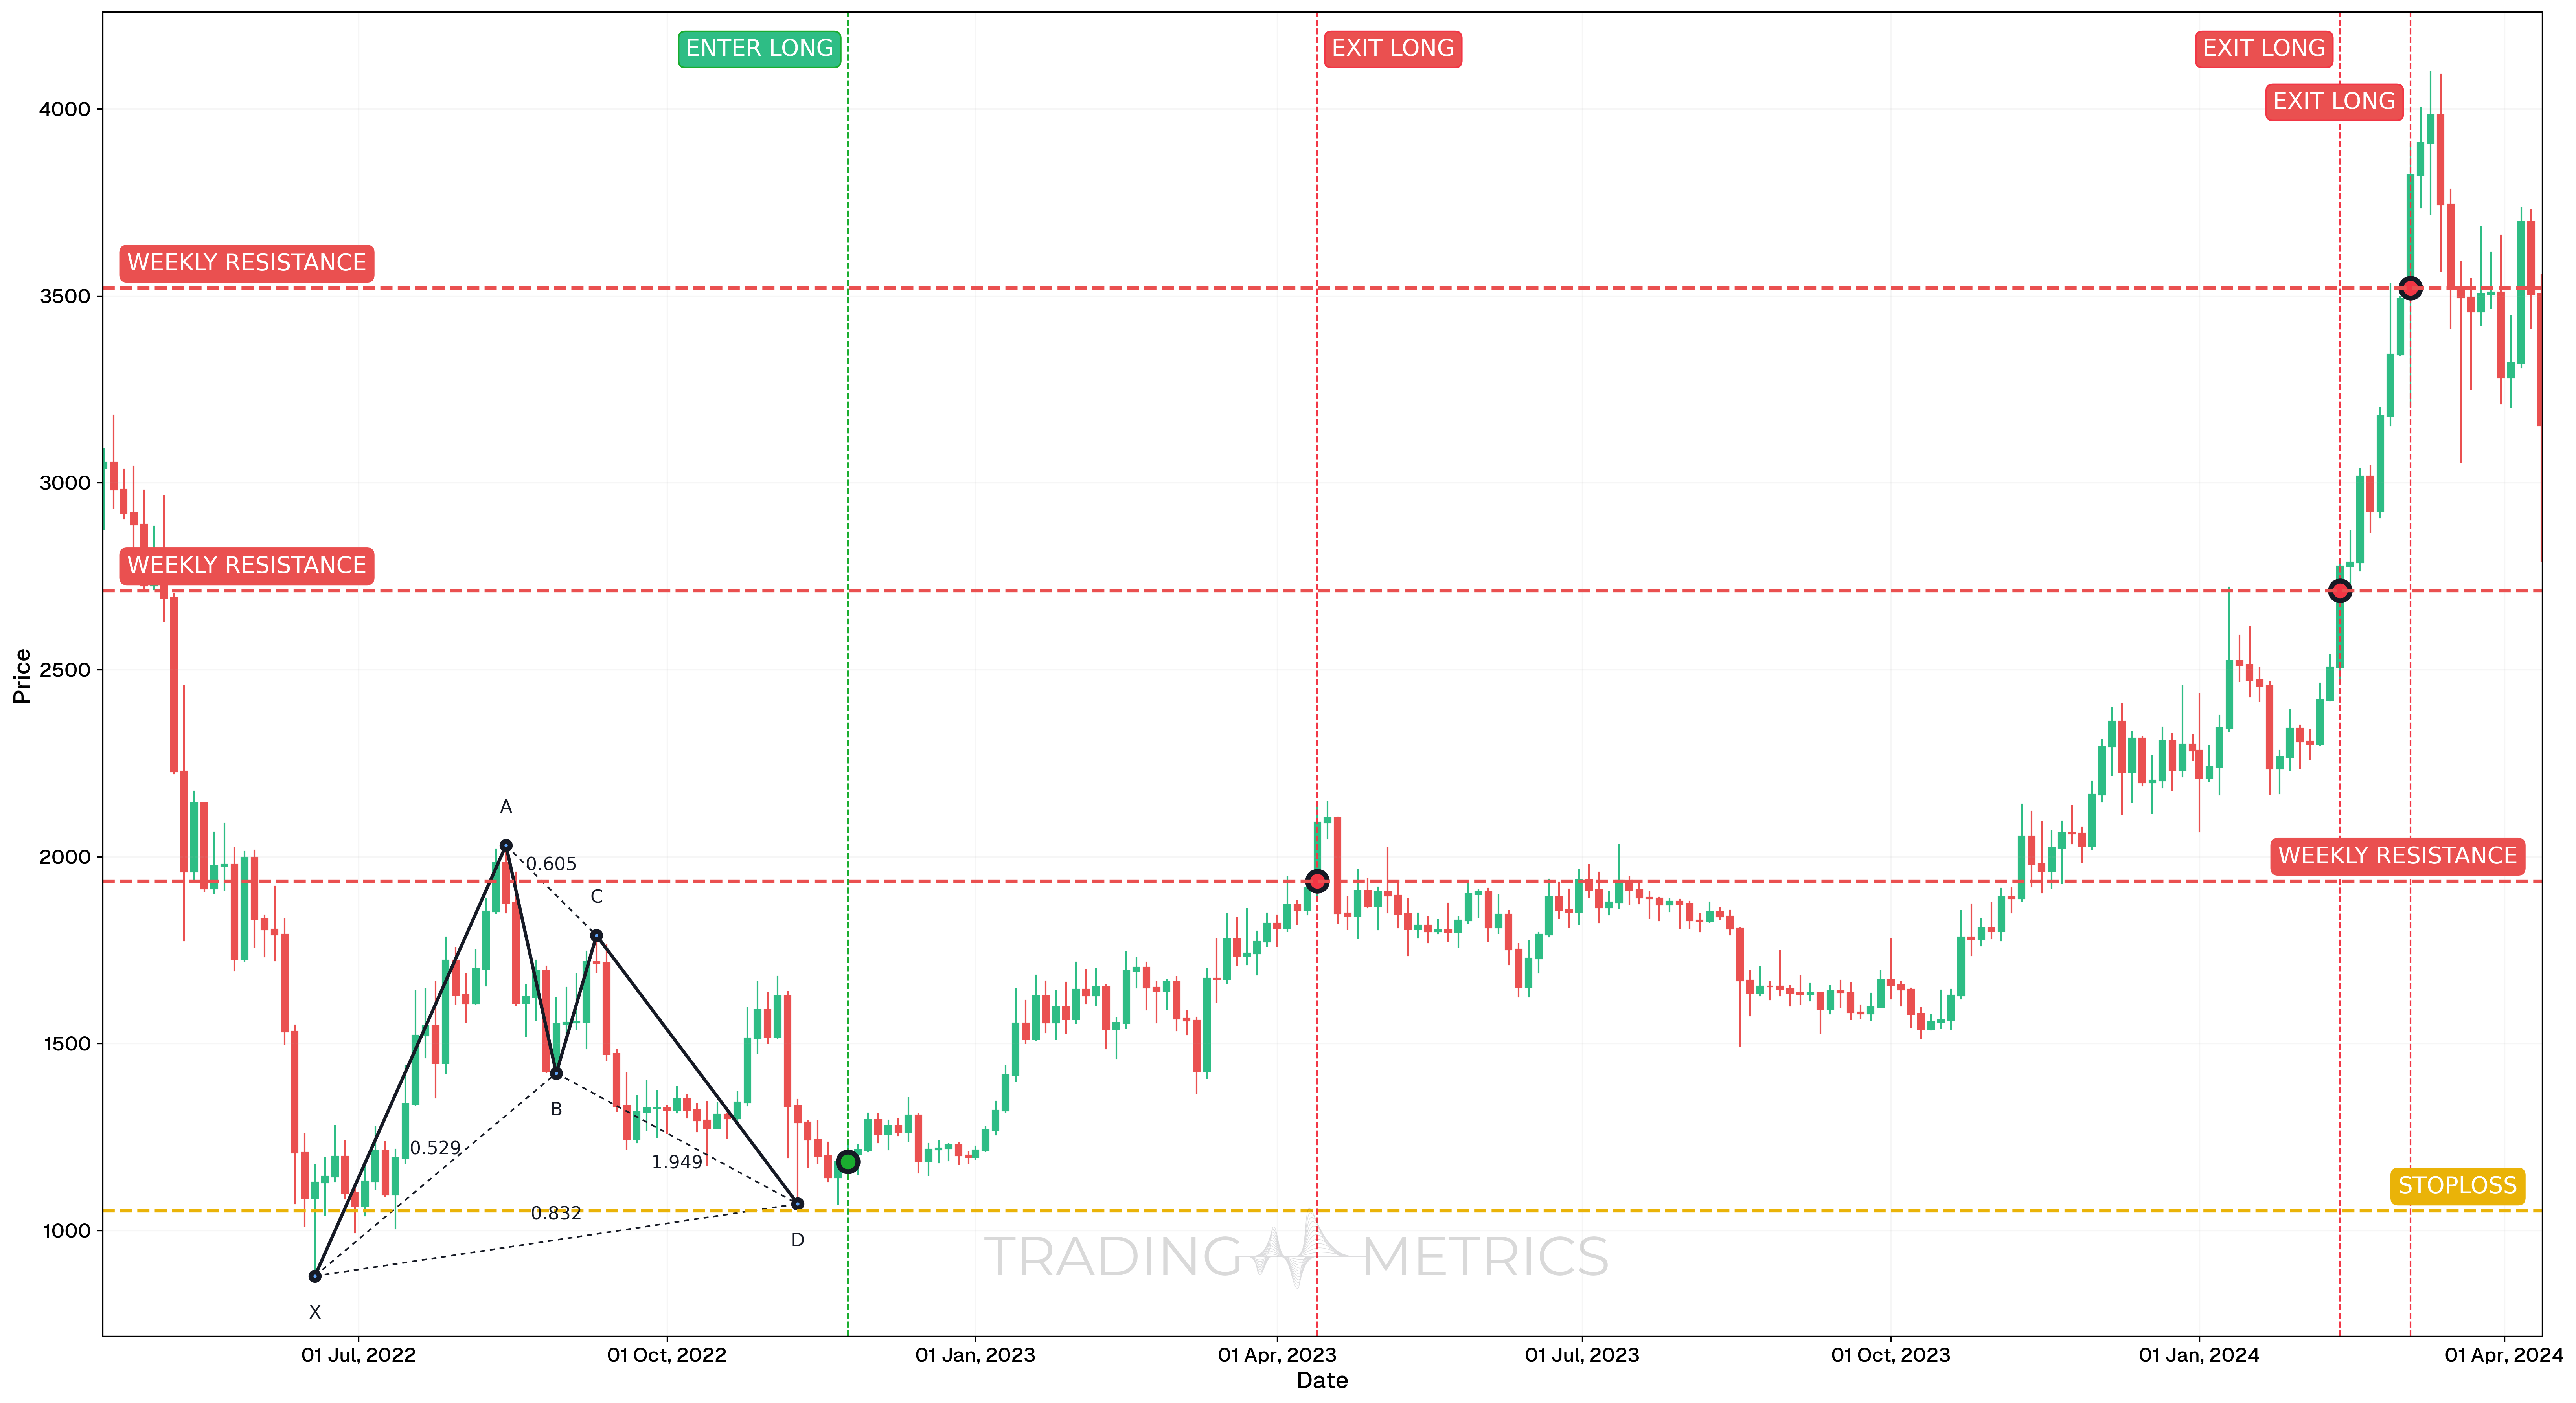
Between April 2022 and April 2024, ETHUSDT Perp formed a Bullish Bat pattern. The structure completed around November 24, 2022, aligning with the second low of a double bottom. Price action confirmed this bottom via a clear Hammer candle near the XA retracement support zone, forming the basis for entry.
Trade Setup
-
Entry: The long trade was entered at $1,183.34, after a Hammer candlestick confirmed the second low of the double bottom and the end of the Bullish Bat structure. Entry was delayed slightly past pattern completion to await confirmation:
- Price bounced off weekly support
- Double bottom structure confirmed, with the second bottom aligning with D-point
- Confirmation via Hammer candle
-
Exit: This trade was managed in multiple stages, targeting key resistance levels and measured move projections:
- April 13, 2023 (TP1): Exit at $1,934.59
- February 12, 2024 (TP2): Exit at $2,711.30
- March 4, 2024 (TP3): Final exit at $3,520.76
-
Outcome: The Bullish Bat pattern provided a strong reversal signal, producing a multi-leg uptrend with excellent trend-following continuation. Using confirmation candles helped reduce entry risk and improved reliability.
Risk Management
- Stop-Loss placement: The stop-loss was placed at $1,052.50, slightly below the D-point of the Bullish Bat and under the lowest swing support.
- Position sizing: The position was sized using a 2% capital risk model, based on the stop-loss distance from the entry.
- Volatility Consideration: Volatility was compressing into the D-point, and the expansion began after the Hammer confirmation candle. Entering post-confirmation helped avoid premature exposure.
- Adaptive Exit Strategy: Exits were based on a combination of weekly resistance zones and harmonic extension targets, allowing for strategic profit booking while following momentum.
Volume Wing: A volume spike at D with confirmation lifts the pattern into a bullish flight.
Pre-Trade Checklist
Soar the Proof: Pair the pattern with volume spikes and indicators like RSI to dodge fakes and boost your odds.
Key Points
- Fibonacci Precision: Exact ratios (38.2%-50% AB, 38.2%-88.6% BC, 88.6% XA) boost reliability - loose fits dilute it.
- Time Frame: Soars strongest on daily or weekly charts after downtrends.
- Combine with Indicators: Use moving averages or RSI to confirm the reversal.
- Breakout Confirmation: A close above B sets the turn - don’t jump at D alone.
- Price Target: Measure the XA leg or use Fibonacci Retracements of XD for targets above the close.
- Risk Management: Set a stop-loss below D or C to limit losses if it fails.
Wait for the Flight: Acting before confirmation risks a Bullish Bat trap - let the reversal take wing.
Conclusion
The Bullish Bat Pattern is a trader’s refined tool for catching bullish reversals. Its XABCD arc, paired with volume, RSI, and moving averages, can soar into big gains. Whether in crypto, stocks, or forex, this pattern sharpens your edge. Stay precise, manage your risk, and let the Bullish Bat align - that harmonic flight could lift into a winning trade.
Frequently Asked Questions
Quick answers based on this page's topic.
The PRZ for a Bullish Bat is the area where three Fibonacci levels converge: the 88.6% retracement of the XA leg, the 161.8% to 261.8% extension of the BC leg, and a 1.27 extension of the AB leg. This convergence creates a 'hard floor' for price action.
The primary difference is 'depth.' The Gartley completes at a 78.6% retracement of XA, while the Bat completes at a deeper 88.6%. Additionally, the Bat requires a shallower B-point (maximum 50%), whereas the Gartley requires a precise 61.8% B-point.
Traders typically target the 38.2% and 61.8% Fibonacci retracement levels of the entire AD move. Because the Bat often marks a major cycle low, the first target is used to move the stop to breakeven, while the second target captures the majority of the reversal's momentum.