Hanging Man Pattern: A Warning at the Top of an Uptrend
The Hanging Man pattern is a foreboding bearish reversal signal in technical analysis, often dangling at the peak of an uptrend. Picture it as a precarious figure - a candlestick with a small body, a long lower shadow, and little to no upper shadow - hinting at a drop after a failed bullish push. When this pattern forms, it’s a grim sign that bullish momentum is weakening, offering traders a chance to sell or short the asset as a downtrend looms below.
How to Identify the Hanging Man Pattern in Trading
The Hanging Man is a bearish reversal candlestick formation. It develops as a single candle at the crest of an uptrend, with a small body and a long lower shadow. The setup signals that sellers tested control during the session, and if confirmed, a reversal may follow. Here’s how to spot it:
Start with the Big Picture
This pattern forms after an uptrend. Buyers push higher, but the long lower shadow shows that sellers briefly forced prices down before a close near the open. It’s a warning that bullish momentum may be fading.
Look for the Candlestick Shape
The Hanging Man is defined by its proportions:
- A small real body, with the open and close near each other.
- A long lower shadow, at least twice the body’s length.
- Little to no upper shadow, showing limited strength from buyers.
Zero in on the Confirmation Level
The confirmation level is the low of the Hanging Man. Price must close below this level to validate the bearish reversal.
Watch the Breakdown
The bearish trigger comes when the next candle closes below the Hanging Man’s low.
- A strong bearish follow-up candle provides confirmation.
- This breakdown is the entry point for the setup.
Check Volume for Additional Confirmation
Volume behavior adds conviction.
- Rises on the Hanging Man day, highlighting selling pressure during the dip.
- Surges on the confirming bearish candle, showing sellers taking charge.
Drop Swing: Measure the lower shadow height or use nearby support levels to project a realistic price target downward from the confirmation close.
How to Trade the Hanging Man Pattern (Trading Example)
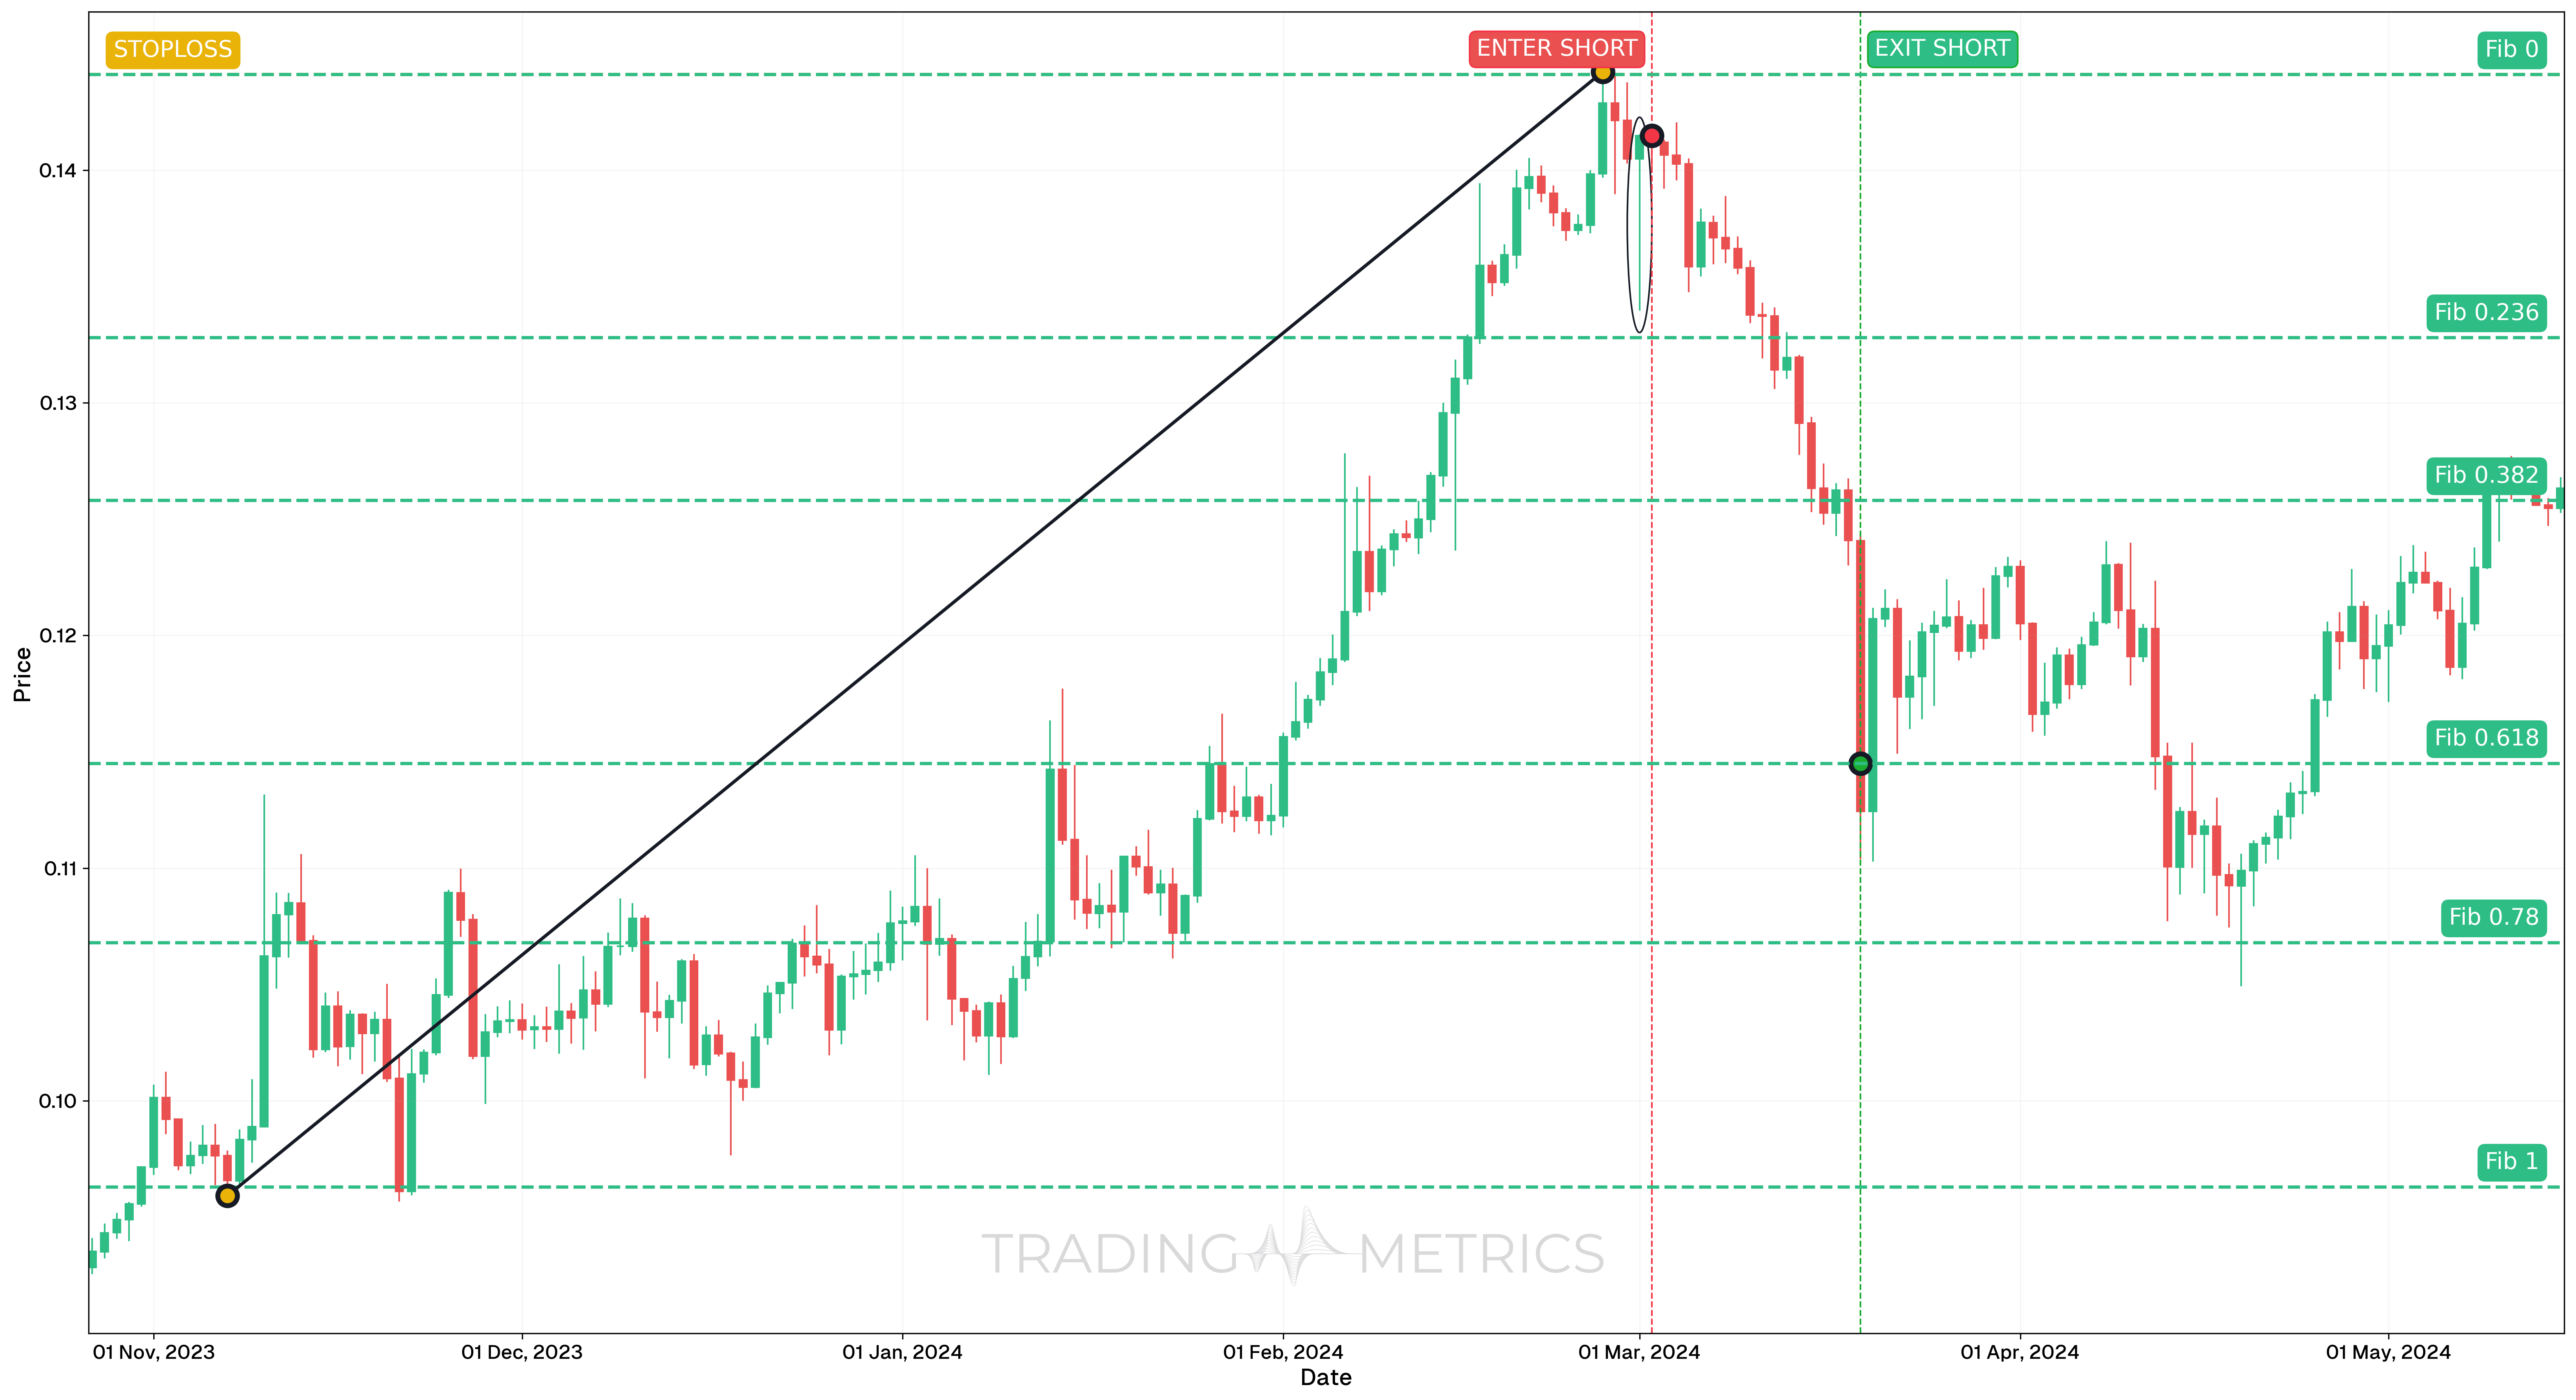
To illustrate how the Hanging Man pattern can be used to enter a trade, we will choose the TRXUSDT pair. This bearish reversal signal emerged on the daily chart, setting up a short trade after extended upward movement into overbought conditions.
Analysis
On March 02, 2024, TRXUSDT formed a classic Hanging Man candlestick at the top of a sustained uptrend. The small real body near the top of the candle and long lower wick suggested that buyers were losing control, with selling pressure entering the market. This was reinforced by EMA and a technical breakdown shortly after.
Trade Setup
-
Entry: The short position was opened on March 02, 2024, at $0.1415, after the confirmation of the Hanging Man. Several key signals supported this decision:
-
Exit: The trade was closed on March 19, 2024, at $0.1145, upon hitting a key Fibonacci Retracement level that had previously acted as support. This provided a structurally logical area to exit the trade.
-
Outcome: The Hanging Man setup resulted in a 19.1% drop, offering a clean reversal after a weakening uptrend.
Risk Management
- Stop-Loss placement: The stop-loss was set at $0.1441, just above the candle’s high and the local structure peak. Any move above this would invalidate the setup.
- Position sizing: Position size was based on a 2% capital risk model, calculated from the entry-to-stop-loss distance.
- Risk-Reward Ratio: This trade achieved a Risk-Reward Ratio of 1:10.4, offering exceptional efficiency and discipline for a short-term setup.
- Volatility Consideration: Volatility was elevated during the candle’s formation and breakout, which aligned with reversal behavior and provided favorable momentum.
- Adaptive Exit Strategy: While this trade targeted a Fibonacci Retracement zone, further downside could be captured by trailing below lower highs or using a dynamic ATR-based stop.
Volume Swing: A volume spike on the Hanging Man day, followed by bearish follow-through, drops the pattern into a bearish turn.
Pre-Trade Checklist
Drop the Proof: Pair the pattern with volume spikes and indicators like RSI to dodge fakes and boost your odds.
Key Points
- Shadow Clarity: A long lower shadow with a small body boosts reliability - short shadows dilute it.
- Time Frame: Drops deepest on daily or weekly charts after uptrends.
- Combine with Indicators: Use moving averages or RSI to confirm the reversal.
- Breakout Confirmation: A close below the Hanging Man’s low sets the turn - don’t jump on the pattern alone.
- Price Target: Measure the lower shadow height or use support levels for a target below the close.
- Risk Management: Set a stop-loss above the Hanging Man’s high to limit losses if it fails.
Wait for the Drop: Acting before confirmation risks a hanging trap - let the reversal swing down.
Conclusion
The Hanging Man pattern is a trader’s foreboding tool for catching bearish reversals. Its dangling shape, paired with volume, RSI, and moving averages, can swing into big gains. Whether in crypto, stocks, or forex, this pattern sharpens your edge. Stay alert, manage your risk, and let the Hanging Man dangle - that failed dip could drop into a winning trade.
Frequently Asked Questions
Quick answers based on this page's topic.
Though it has a small body at the top, the long lower wick shows that a massive sell-off occurred during the session. The fact that sellers were able to drive price that low at the peak of an uptrend is a major warning that the buyers' grip is slipping.
The patterns are visually identical; the difference is context. A Hammer occurs at the bottom of a downtrend (bullish), while a Hanging Man occurs at the top of an uptrend (bearish). In an uptrend, the 'rejection of lows' suggests the market is becoming top-heavy.
Because the candle actually closed near its high, buyers are still putting up a fight. A bearish close on the following candle is necessary to prove that the sellers who created that long lower shadow have finally taken control of the daily trend.