Trading the Bearish Shark: Fading Failed Breakouts at Resistance
The Bearish Shark Pattern is a sharp bearish reversal signal in technical analysis, often striking at the end of an uptrend. Picture it as a predatory swing - price tracing a distinct 0XABC structure with Fibonacci ratios - snapping back from bullish overextension to bearish retreat. When this pattern appears, it’s a fierce cue that bullish momentum is exhausted, offering traders a chance to sell or go short as a downtrend takes shape.
How to Identify the Bearish Shark Pattern in Trading
The Bearish Shark Pattern is a unique harmonic setup that signals exhaustion after an aggressive rally. Picture the market surging higher, pulling back, then driving into an extreme extension before losing steam. That’s when sellers strike. Here’s how to spot it:
Start with the Big Picture
This pattern develops after a strong uptrend. Bulls appear dominant, but the Bearish Shark’s deep Fibonacci extensions reveal where momentum overreaches and a bearish reversal becomes likely.
Trace the 0XABC Legs
The Bearish Shark is structured around five points with exact Fibonacci rules. Spotting these levels is what confirms the pattern.
- 0X: The initial upward move that sets the base.
- XA: A rally higher, forming the foundation of the structure.
- AB: A retracement downward into 113%–161.8% of XA.
- BC: A sharp extension upward into the 161.8%–224% projection of AB.
Zero in on C (the Reversal Zone)
C is the completion point where the Bearish Shark’s bite occurs. It combines the 88.6%–113% retracement of XC with the exhaustion from the extreme BC projection range. If price stalls here, sellers are likely preparing to take control.
Watch the Breakdown
Confirmation comes when price fails at C and turns lower.
- A strong bearish candle or
- A close below B
Both confirm that the rally has ended and the reversal is in motion. That’s your entry trigger.
Check Volume for Additional Confirmation
Volume flow adds credibility to the reversal.
- Strong on XA (buyers driving hard).
- Lighter on AB (retracement).
- Another burst on BC (bulls overextending).
When that spike appears, the Bearish Shark’s bearish reversal carries real conviction.
Fall Bite: Measure the XA leg height and project it downward from C, or use the 38.2% or 61.8% retracement of XC as realistic price targets.
How to Trade the Bearish Shark Pattern (Trading Example)
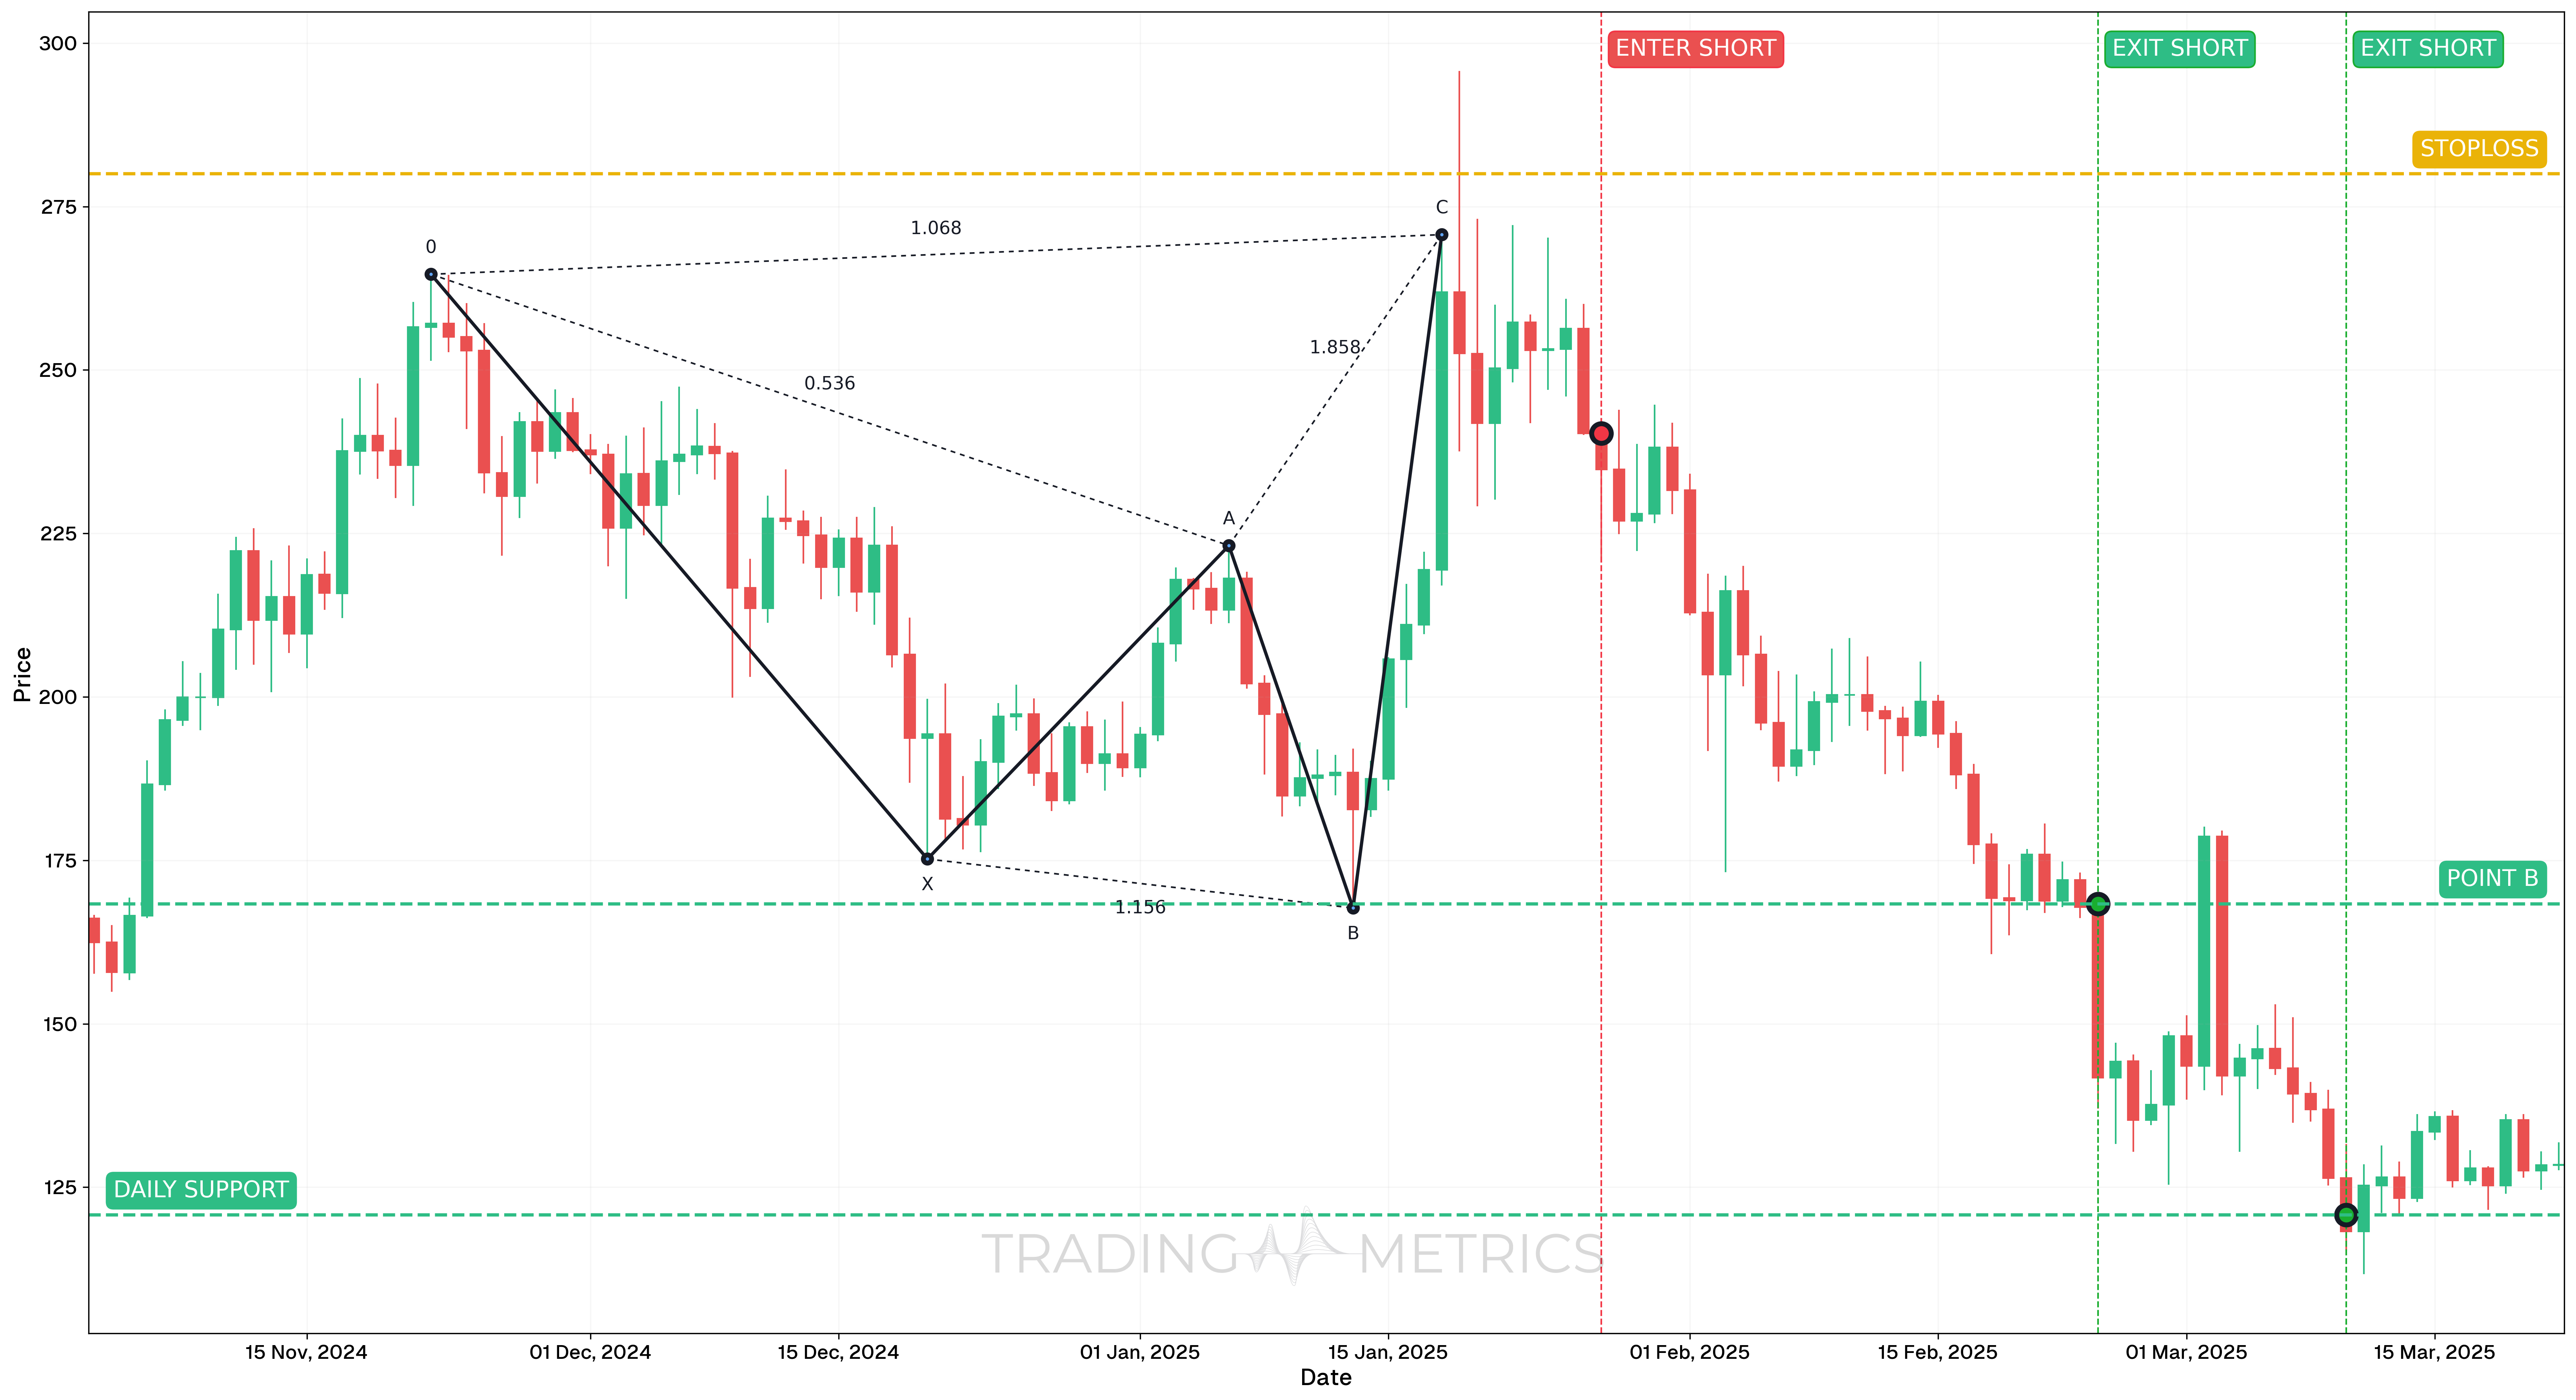
To demonstrate how the Bearish Shark harmonic pattern can be traded, we’ll examine SOLUSDT Perp on the 1-day chart. This example highlights a disciplined entry approach where confirmation was prioritized over immediate action at the PRZ (Potential Reversal Zone).
Analysis
Between November 3, 2024, and March 22, 2025, SOLUSDT Perp completed a well-defined Bearish Shark pattern. While the structure reached its Potential Reversal Zone (PRZ) around $234.79 on January 27, 2025, the trader opted to wait for further confirmation before initiating a short position.
Trade Setup
-
Entry: Instead of entering directly at the PRZ (Potential Reversal Zone), the trader waited several candles until a Bearish Engulfing candle formed, confirming reversal intent. Entry was taken after the engulfing pattern, ensuring momentum was shifting downward.
-
Exit: The trade was exited in multiple stages based on both structural and technical targets:
- TP1: February 24, 2025 – Point C of the pattern reached at $168.35
- TP2: March 10, 2025 – Daily Support zone hit at $120.76
-
Outcome: The trade successfully captured the reversal by waiting for confirmation. Exiting in two stages allowed partial profit-taking while riding the extended move to support.
Risk Management
- Stop-Loss placement: stop-loss was placed above the X-point, at $280, just above the invalidation zone of the Bearish Shark structure.
- Position sizing: Used a 2% capital risk model, scaled based on distance from entry to stop.
- Volatility Consideration: Volatility was elevated near the PRZ (Potential Reversal Zone), so waiting for confirmation helped avoid a premature entry.
- Confirmation Strategy: This trade emphasized the value of waiting for price action validation before entering, which increased confidence and reduced false signal risk.
Volume Bite: A volume spike at D with confirmation snaps the pattern into a bearish surge.
Pre-Trade Checklist
Key Points
- Fibonacci Precision: Exact ratios (113%-161.8% AB, 161.8%-224% BC, 88.6%-113% CD) are essential - sloppy geometry weakens signals.
- Time Frame: Performs best on daily or weekly charts near market tops.
- Combine with Indicators: Confirm with EMA or RSI divergence.
- Breakout Confirmation: A close below B confirms entry - don’t front-run C.
- Price Target: Use the XA leg or Fibonacci Retracements of XC to estimate downside potential.
- Risk Management: Stop-loss should sit above C or the high of the pattern.
Wait for the Bite: Acting before confirmation risks a Bearish Shark trap - let the reversal snap.
Conclusion
The Bearish Shark Pattern is a trader’s harmonic weapon for catching bearish reversals. Its 0XABC swing, paired with volume spikes, RSI, and trend confluence, can snap into sharp drops. Whether in crypto, stocks, or forex, this pattern delivers edge when applied with precision. Follow structure, manage your risk, and let the Bearish Shark strike. That Fibonacci snap could deliver the reversal you’re hunting.
Frequently Asked Questions
Quick answers based on this page's topic.
The Bearish Shark features a C-point that exceeds the initial A-point, creating a false bullish breakout. This lures in 'late bulls' before price aggressively reverses. It signals a sophisticated shift in liquidity where big players are exiting into the retail demand.
The PRZ is calculated using the OX leg. Specifically, point C should complete between the 88.6% and 113% Fibonacci retracement of OX. This overextended zone identifies where the false breakout is mathematically likely to fail and turn into a sharp decline.
Yes, because the Shark is a high-momentum pattern, the reversals at point C are often sharp and immediate. Scalpers use the Shark on lower timeframes to catch these 'volatility snaps,' though it requires strict risk management due to the extension beyond previous highs.