Long-Legged Doji Pattern: A Wide-Range Standoff in Real Time
The Long-Legged Doji signals strong indecision, forming when the open and close are nearly equal with long upper and lower shadows. It shows buyers and sellers pushed prices widely but finished in balance. After an uptrend, it may warn of fading bullish strength; after a downtrend, it can suggest selling pressure is easing. The signal stays neutral until confirmed by the next candles.
How to Identify the Long-Legged Doji Pattern in Trading
Spotting a Long-Legged Doji involves recognizing a single candlestick with extended shadows, signaling indecision that could shift direction - bullish or bearish - with confirmation. It’s about potential transitions. Here’s the step-by-step guide.
Understand the Basics of the Long-Legged Doji Pattern
The Long-Legged Doji is a neutral pattern reflecting intense volatility and indecision, with its meaning tied to context:
- Bullish Scenario: Appears after a downtrend, suggesting bearish momentum may weaken, potentially leading to a reversal if confirmed upward.
- Bearish Scenario: Appears after an uptrend, indicating bullish momentum may falter, possibly signaling a reversal if confirmed downward.
Look for the Candlestick Shape in Price Movement
The pattern features a single candle:
- Long-Legged Doji: A candlestick where the open and close are equal or very close, forming a small body, with long upper and lower shadows (each significantly longer than the body) - price swings widely before settling near the open, showing indecision.
Identify the Confirmation Level
- Bullish Scenario: The confirmation level is the high of the Long-Legged Doji - a subsequent close above suggests a bullish shift.
- Bearish Scenario: The confirmation level is the low of the Long-Legged Doji - a subsequent close below indicates a bearish shift.
Confirm the Pattern with a Follow-Up Close
- Bullish Scenario: A bullish signal emerges when the next candle closes above the Long-Legged Doji’s high, often with a bullish candle, indicating a potential reversal or continuation. This is your entry point for a long trade.
- Bearish Scenario: A bearish signal emerges when the next candle closes below the Long-Legged Doji’s low, often with a bearish candle, suggesting a potential reversal or continuation. This is your entry point for a short trade. (Note: Confirmation is essential due to the pattern’s neutrality.)
Check Volume for Extra Confidence
Volume often spikes on the Long-Legged Doji day, reflecting high volatility and indecision:
- Bullish Scenario: A surge on confirmation with rising volume supports a bullish resolution.
- Bearish Scenario: A surge on confirmation with rising volume reinforces bearish resolution. High volume in either case strengthens the directional signal.
Range Stretch: Measure the shadow-to-shadow range or nearby resistance levels to estimate a potential price target upward from a bullish confirmation close.
How to Trade the Long-Legged Doji Pattern (Trading Example)
To illustrate how the Long-Legged Doji pattern can be used in trading, we’ll use the TSLA weekly chart. This example highlights how the pattern acted as a bearish reversal signal following a corrective rally within a broader downtrend.
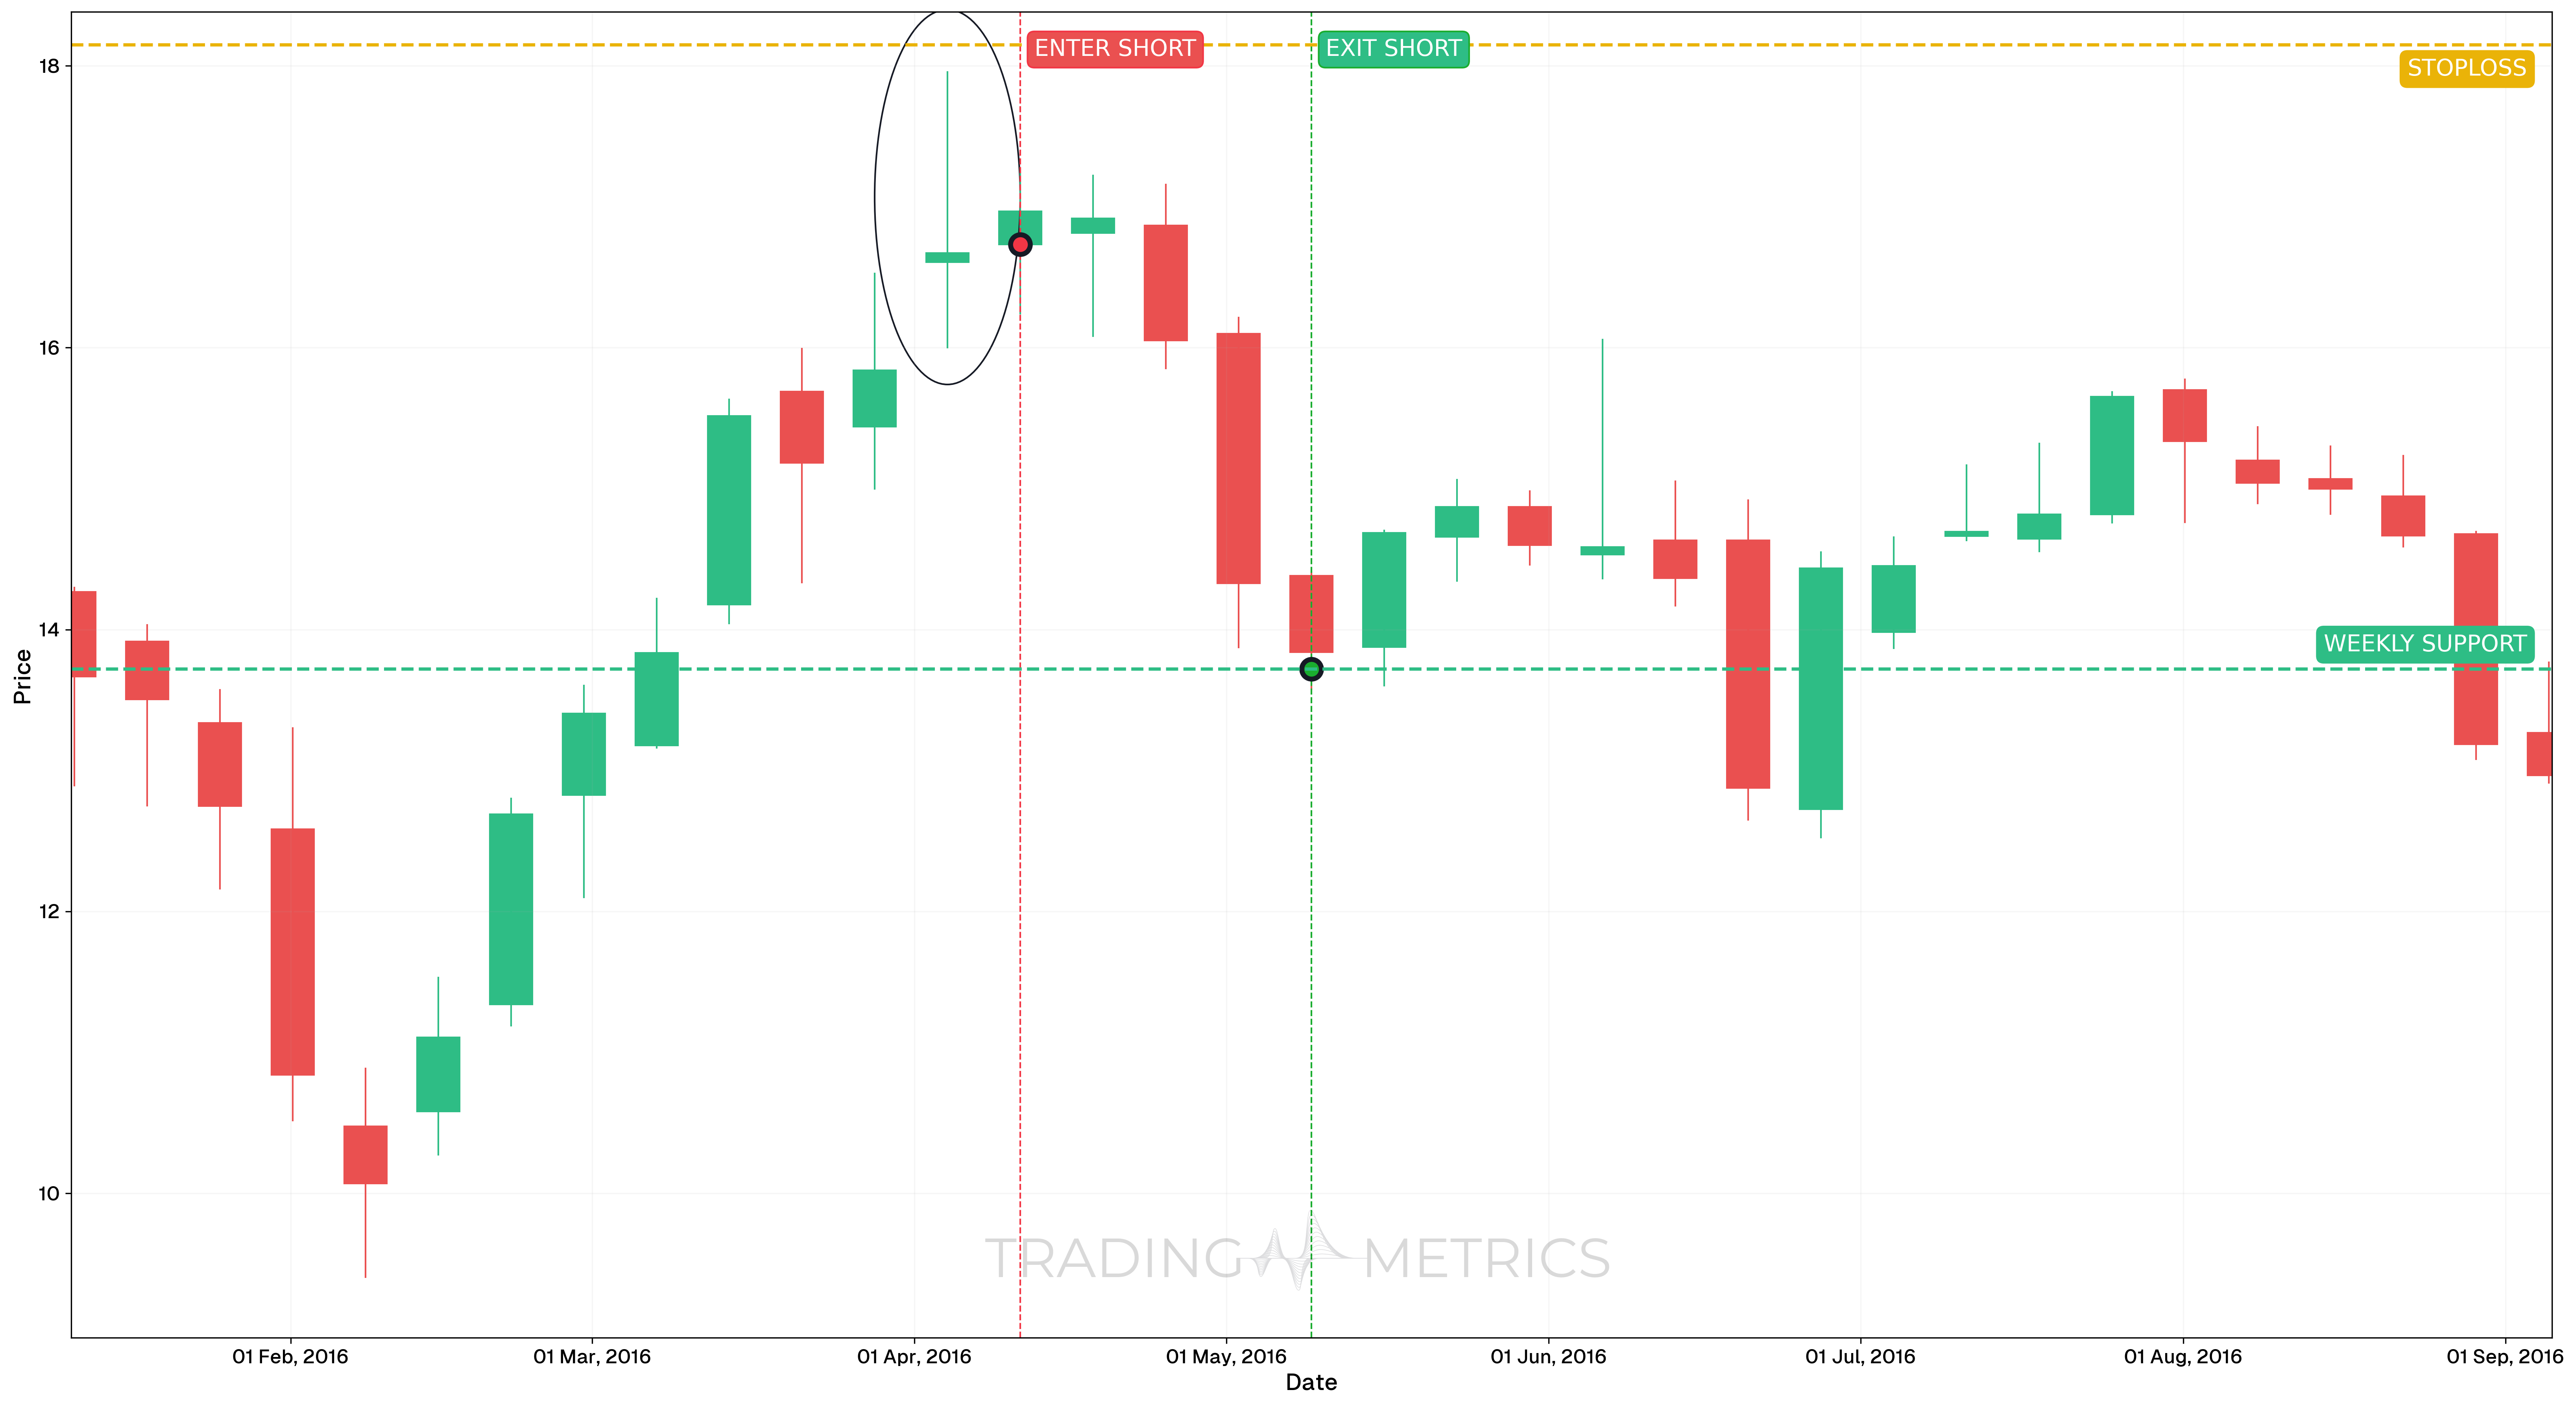
Analysis
From January to September 2016, TSLA experienced a period of broad price movement with declining momentum. On the week of April 11, 2016, the stock printed a clear Long-Legged Doji, signaling indecision near a local high. This was followed by a bearish confirmation candle that initiated a short-term decline.
Trade Setup
- Entry: The short position was entered on April 11, 2016, at $16.73, following the confirmation of the Long-Legged Doji pattern. Entry was supported by:
- A clean pattern formation
- StochRSI bearish cross just before entry
- Exit: The position was exited at $13.72, near a key weekly support zone, as price lost downward momentum and began consolidating.
- Outcome: The trade captured a clean reversal from the Long-Legged Doji, with price respecting weekly structure levels during both entry and exit.
Risk Management
- Stop-Loss placement: The stop-loss was set at $18.15, just above the Long-Legged Doji candle.
- Position sizing: A 2% capital risk model was used to determine position size based on the entry and stop-loss distance.
- Volatility Consideration: The long wicks of the Long-Legged Doji marked a high Volatility area, which quickly compressed on confirmation. The entry was timed to reduce false breakout risk.
- Risk-Reward Ratio: Is 1:2.12, which is a solid risk-adjusted outcome for a reversal-based setup.
Volume Boost: A volume spike on confirmation can turn the neutral Long-Legged Doji into a bullish opportunity.
Pre-Trade Checklist
Confirm the Shift: Use volume spikes and indicators like RSI to filter noise and strengthen confirmation.
Key Points
- Shadow Length: Long upper and lower shadows with a small body define the pattern-short shadows weaken it.
- Time Frame: Most reliable on daily or weekly charts after downtrends.
- Combine with Indicators: Use moving averages or RSI to interpret direction.
- Breakout Confirmation: A close above the Long-Legged Doji’s high hints at a bullish turn-don’t act on the Long-Legged Doji alone.
- Price Target: Measure the shadow range or resistance levels for a potential target above the close.
- Risk Management: Place a stop-loss below the Long-Legged Doji’s low to cap losses if the signal fails.
Wait for Clarity: Trading before confirmation risks misreading the neutral Long-Legged Doji-let the trend direction emerge.
Conclusion
The Long-Legged Doji pattern is a trader’s tool for spotting potential shifts amid indecision. Its neutral stance, backed by volume, RSI, and moving averages, can signal opportunity. Whether in crypto, stocks, or forex, this pattern offers insight. Stay disciplined, manage your risk, and wait for confirmation-that indecision could resolve into a profitable move.
Frequently Asked Questions
Quick answers based on this page's topic.
While a standard Doji shows a lack of activity, a Long-Legged Doji represents an explosion of high-volatility indecision. It features very long upper and lower shadows, showing that both buyers and sellers made massive attempts to drive the price during the session, but ultimately ended in a structural stalemate.
The long wicks represent a 'High-Volatility Reset.' They show that the market is testing extreme price levels but finding no sustainable support or resistance there. This total market equilibrium after an aggressive range proves the previous trend is exhausted and a significant trend change is approaching.
Because the range is so wide, trading the 'breakout' of a Long-Legged Doji requires patience. Traders wait for a candle to close decisively outside the extreme high or low of the shadows. This close confirms which side finally won the volatility battle, providing a high-conviction signal for the next trend leg.