Triple Top Pattern: When a Rally Fails Three Times in a Row
The Triple Top pattern is a strong bearish reversal signal in technical analysis, typically forming after a persistent uptrend. It occurs when the price tests a resistance level three times, creating three distinct peaks at similar levels before reversing downward. This pattern signals exhausted bullish momentum, increasing the likelihood of a downtrend and providing traders with an opportunity to consider sell or short positions.
How to Identify the Triple Top Pattern in Trading
The Triple Top is a bearish reversal formation. It forms when price tests the same resistance level three times but fails to break through, creating three peaks separated by two troughs. The setup confirms when price breaks below the neckline. Here’s how to spot it:
Start with the Big Picture
This pattern develops after a clear uptrend. Buyers repeatedly attempt to push higher, but each rally stalls at the same level, signaling weakening momentum and seller strength.
Trace the Three Peaks
The Triple Top unfolds in stages. Recognizing each step confirms the pattern.
- First Top: Price rallies to a high, then pulls back.
- First Trough: A dip forms the first low between peaks.
- Second Top: Price rallies again, matching the prior high, then declines.
- Second Trough: Another dip creates the second low.
- Third Top: Price climbs once more but fails to break higher, then reverses down.
Zero in on the Neckline
The neckline connects the two troughs between the peaks. It is typically horizontal, though slight slopes can occur. This is the key support level to watch.
Watch the Breakdown
The bearish trigger comes when price closes below the neckline.
- A decisive break under support or
- A strong bearish candle
Both confirm the reversal and trigger the entry.
Check Volume for Additional Confirmation
Volume behavior adds confirmation.
- High at the first top as buyers push strongly.
- Fades through the second and third tops as momentum weakens.
- Spikes on the neckline break, verifying the bearish reversal.
Size It Up: Measure the distance from the tops to the neckline and project it downward from the break for a solid price target.
How to Trade the Triple Top Pattern (Trading Example)
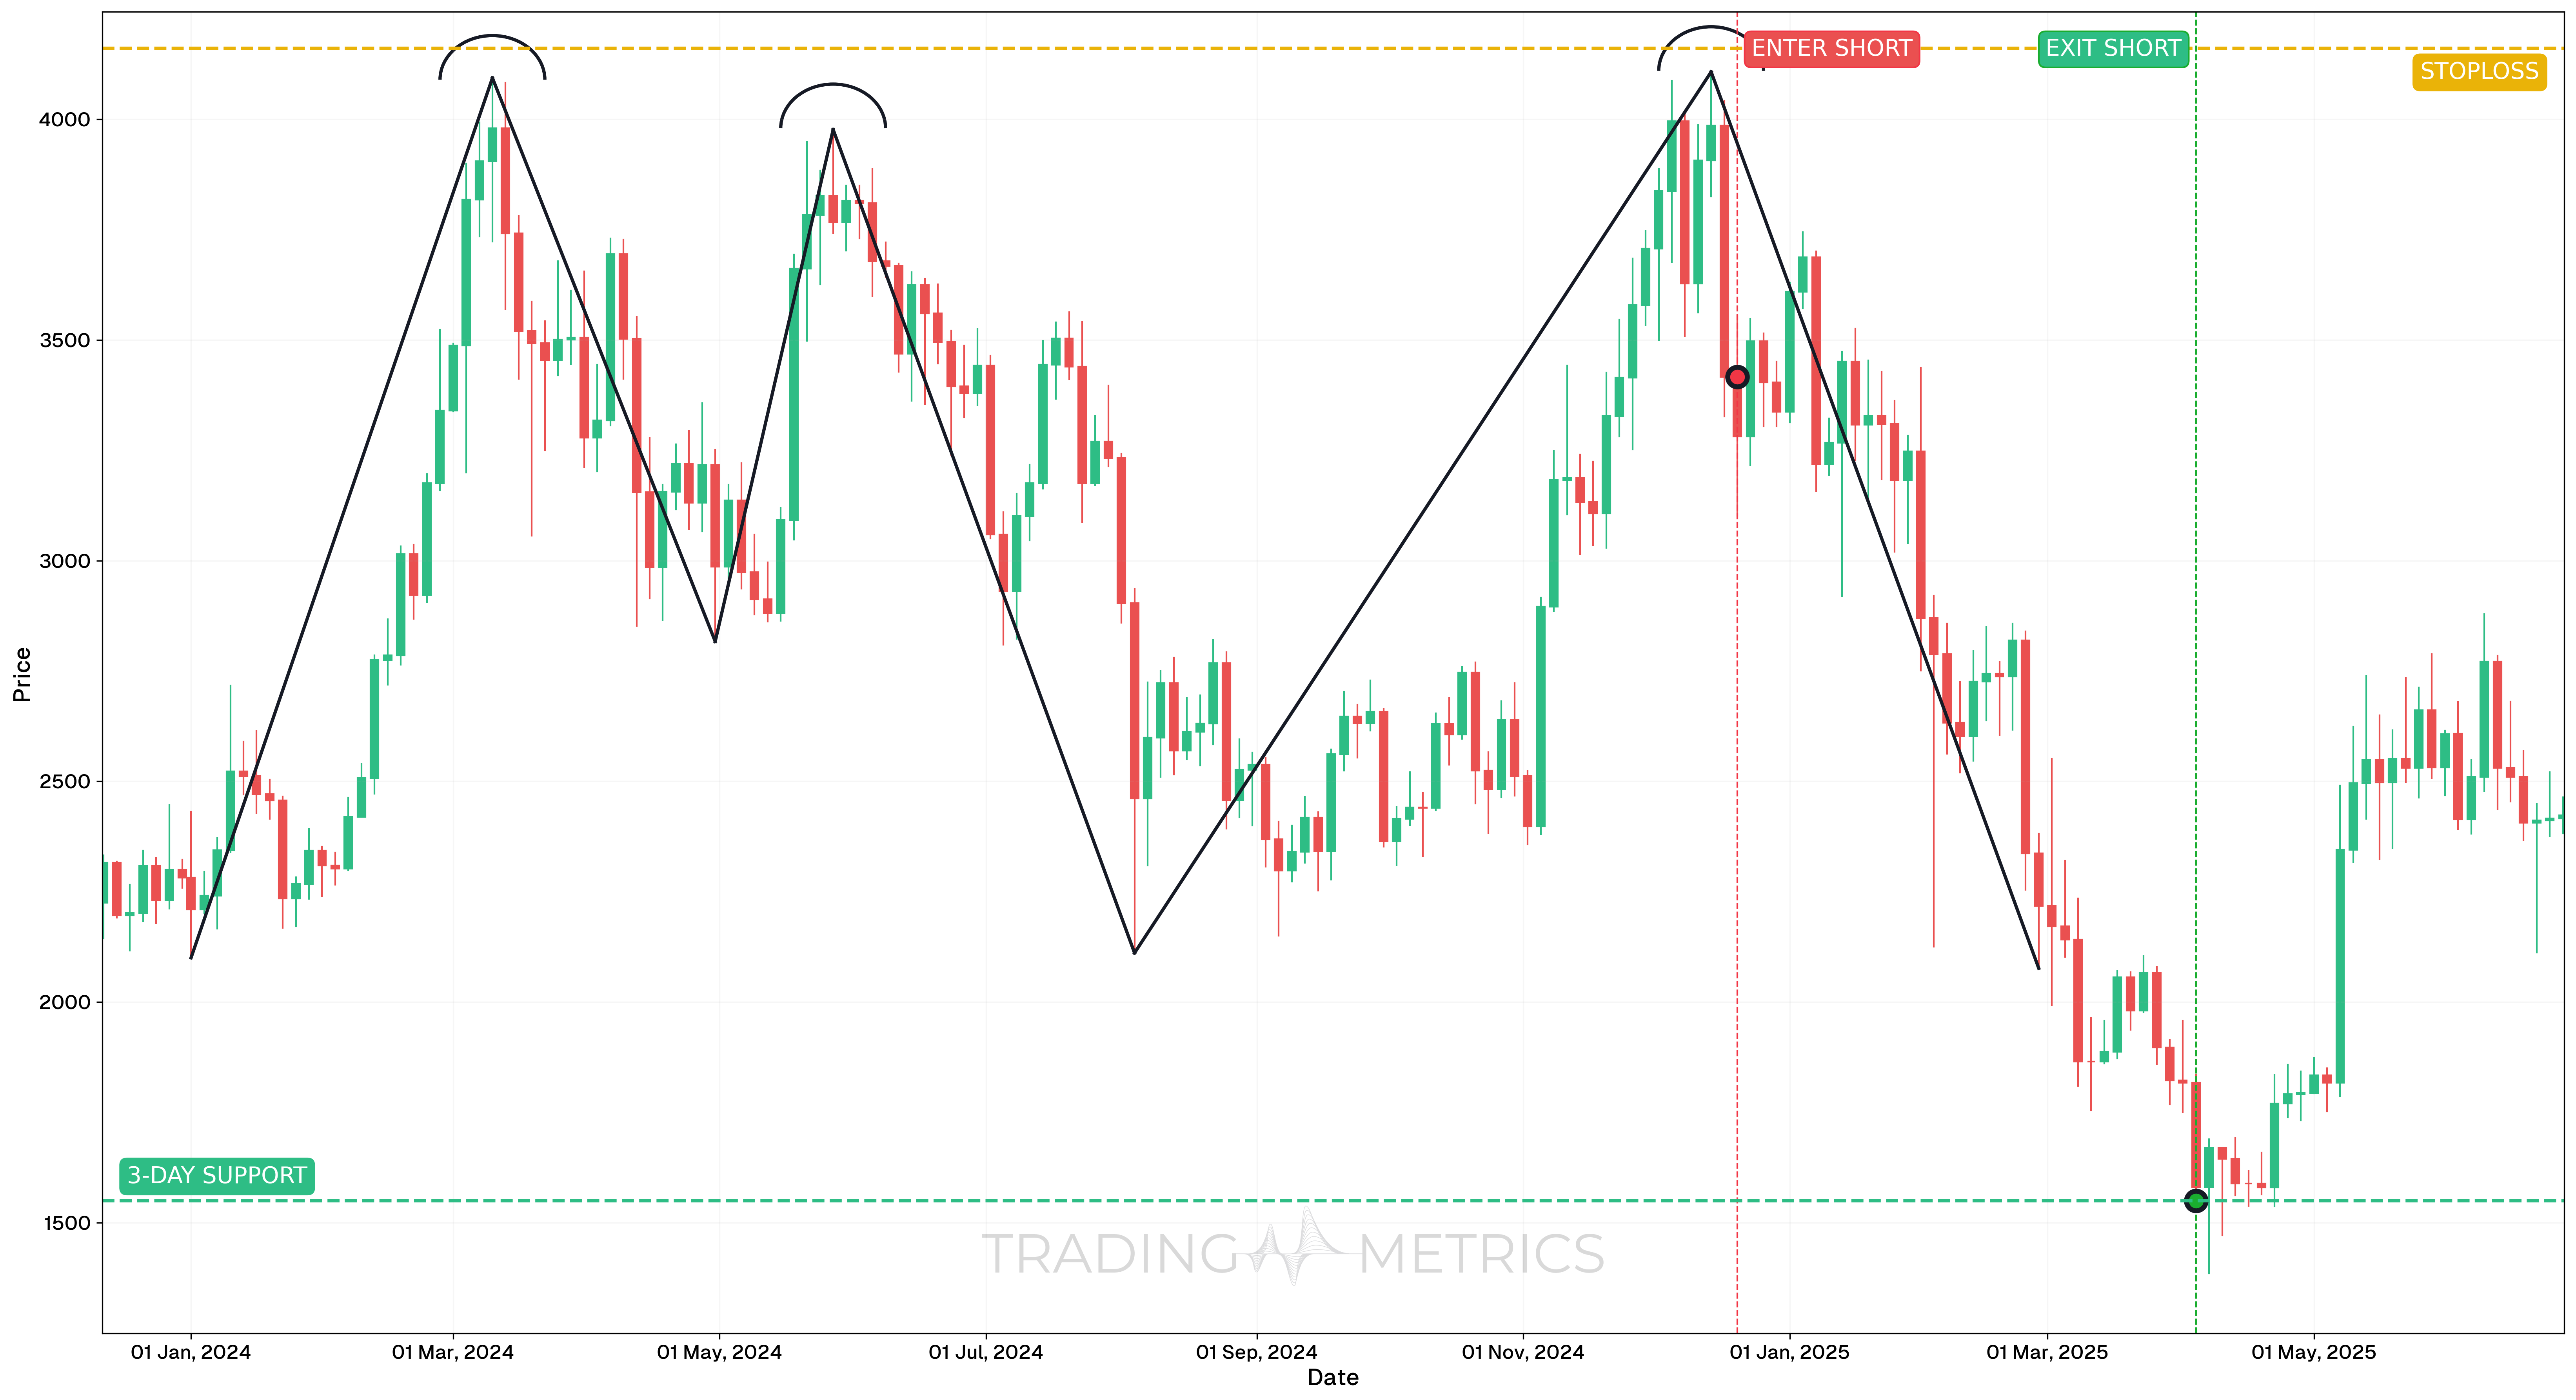
To illustrate how the Triple Top pattern can be used to enter a trade, we will use the ETHUSDT pair on the 3-day chart. This example captures a large-scale bearish reversal pattern with clean structure and momentum confirmation.
Analysis
Between December 2023 and June 2025, ETHUSDT printed a clear Triple Top pattern on the 3-day timeframe. Price formed three distinct peaks, each near the $4,161 level, while failing to break higher. This repeated rejection indicated strong overhead resistance and rising bearish pressure.
Trade Setup
-
Entry: Entered on April 4, 2025, at $3,417.01, one candle after the third peak was confirmed. The short setup was supported by:
-
Exit: Exited at a prior 3-day horizontal support zone, which had acted as a strong resistance earlier. Final target was $1,549.58.
-
Outcome: The Triple Top played out cleanly, with price reversing from its third rejection and reaching deep structural support. The setup captured a significant trend rotation over the multi-week period.
Risk Management
- Stop-Loss placement: The stop-loss was placed at $4,161.49, just above the third peak to invalidate the pattern in case of breakout.
- Position sizing: Based on a 2% capital risk model, with stop-loss distance determining position size.
- Volatility Consideration: Volatility had contracted before the pattern’s final top and expanded during the breakdown, validating momentum strength.
- Risk-Reward Ratio: The trade achieved a 1:2.51 Risk-Reward Ratio, offering a high-quality reversal setup with multiple confirmation layers.
Volume Kick: A sharp volume rise on the neckline break amps up the bearish conviction.
Pre-Trade Checklist
Triple Proof: Match the pattern with volume jumps and indicators like RSI to sidestep fakes and stack the deck.
Key Points
- Peak Alignment: The tops don’t need perfection, but similar heights boost reliability.
- Time Frame: Hits harder on daily or weekly charts than shorter ones.
- Combine with Indicators: Pair with moving averages or RSI for extra juice.
- Breakout Confirmation: The neckline break flips the script - don’t jump the gun.
- Price Target: Measure from tops to neckline, project down from the break for your mark.
- Risk Management: Place a stop-loss above the third top to limit damage if it flops.
Wait It Out: Acting before the neckline break risks a fakeout - patience pays.
Conclusion
The Triple Top pattern is a heavyweight in spotting bearish reversals. It’s a clear, three-strike signal that works best with volume, RSI, and moving averages to back it up. Whether you’re in crypto, stocks, or forex, this pattern can be a game-changer. Stay sharp, manage your risk, and let the setup ripen - those three peaks might just pave your way to a killer trade.
Frequently Asked Questions
Quick answers based on this page's topic.
The Triple Top shows that buyers attempted to reclaim a resistance level three separate times and failed every time. This extra touch provides more proof of an absolute 'supply ceiling,' making the eventual breakdown structurally more significant and high-conviction.
Confirmation requires a decisive close below the neckline—the support level formed by the reaction lows between the three peaks. A volume spike during the break confirms that buyers have finally surrendered their defense of the floor.
In a Triple Top, all three peaks are at approximately the same price level, showing a flat resistance zone. In a Head and Shoulders, the middle peak is higher than the two sides, reflecting a more complex failure of market structure.