Double Top Pattern: When a Rally Fails Twice at the Same Level
The Double Top pattern is a well-known bearish reversal signal in technical analysis, typically forming after a strong uptrend. It occurs when the price reaches a resistance level twice, creating two distinct peaks at similar levels, before reversing downward. This pattern signals weakening bullish momentum, offering traders a chance to anticipate a potential downtrend by considering sell or short positions.
How to Identify the Double Top Pattern in Trading
The Double Top is a bearish reversal pattern. It forms when price rallies to a resistance level twice but fails to break through, creating an “M”-shaped structure. The setup completes with a decisive breakdown below support. Here’s how to spot it:
Start with the Big Picture
This pattern develops after a clear uptrend. Buyers attempt to extend the rally but stall at the same level twice, showing that resistance is holding and momentum is fading.
Trace the Two Peaks
The Double Top unfolds in three key parts. Recognizing each step confirms the structure.
- First Top: Price climbs to a high, then pulls back as sellers react.
- Trough: A dip forms between the peaks, creating temporary support.
- Second Top: Price rallies again but fails to break past the first top, signaling exhaustion.
Zero in on the Neckline
The neckline is the support level drawn across the trough between the two peaks. It’s usually horizontal, though a slight slope can appear depending on price action.
Watch the Breakdown
The bearish trigger comes when price closes below the neckline.
- A decisive break under support or
- A strong bearish candle
Both confirm the reversal and set up the entry point.
Check Volume for Additional Confirmation
Volume behavior strengthens the signal.
- High on the first top as buyers push up.
- Lighter during the trough as activity pauses.
- Picks up again on the second decline, then
- Surges on the neckline break, confirming bearish control.
Measure Your Move: Calculate the distance from the tops to the neckline and project it downward from the breakout for a realistic price target.
How to Trade the Double Top Pattern (Trading Example)
To illustrate how the Double Top pattern can be used to enter a trade, we will choose the ENA/USDT PERP pair. This is a high-beta altcoin perpetual in the cryptocurrency market, where technical analysis can often detect momentum shifts before breakdowns occur.
Analysis
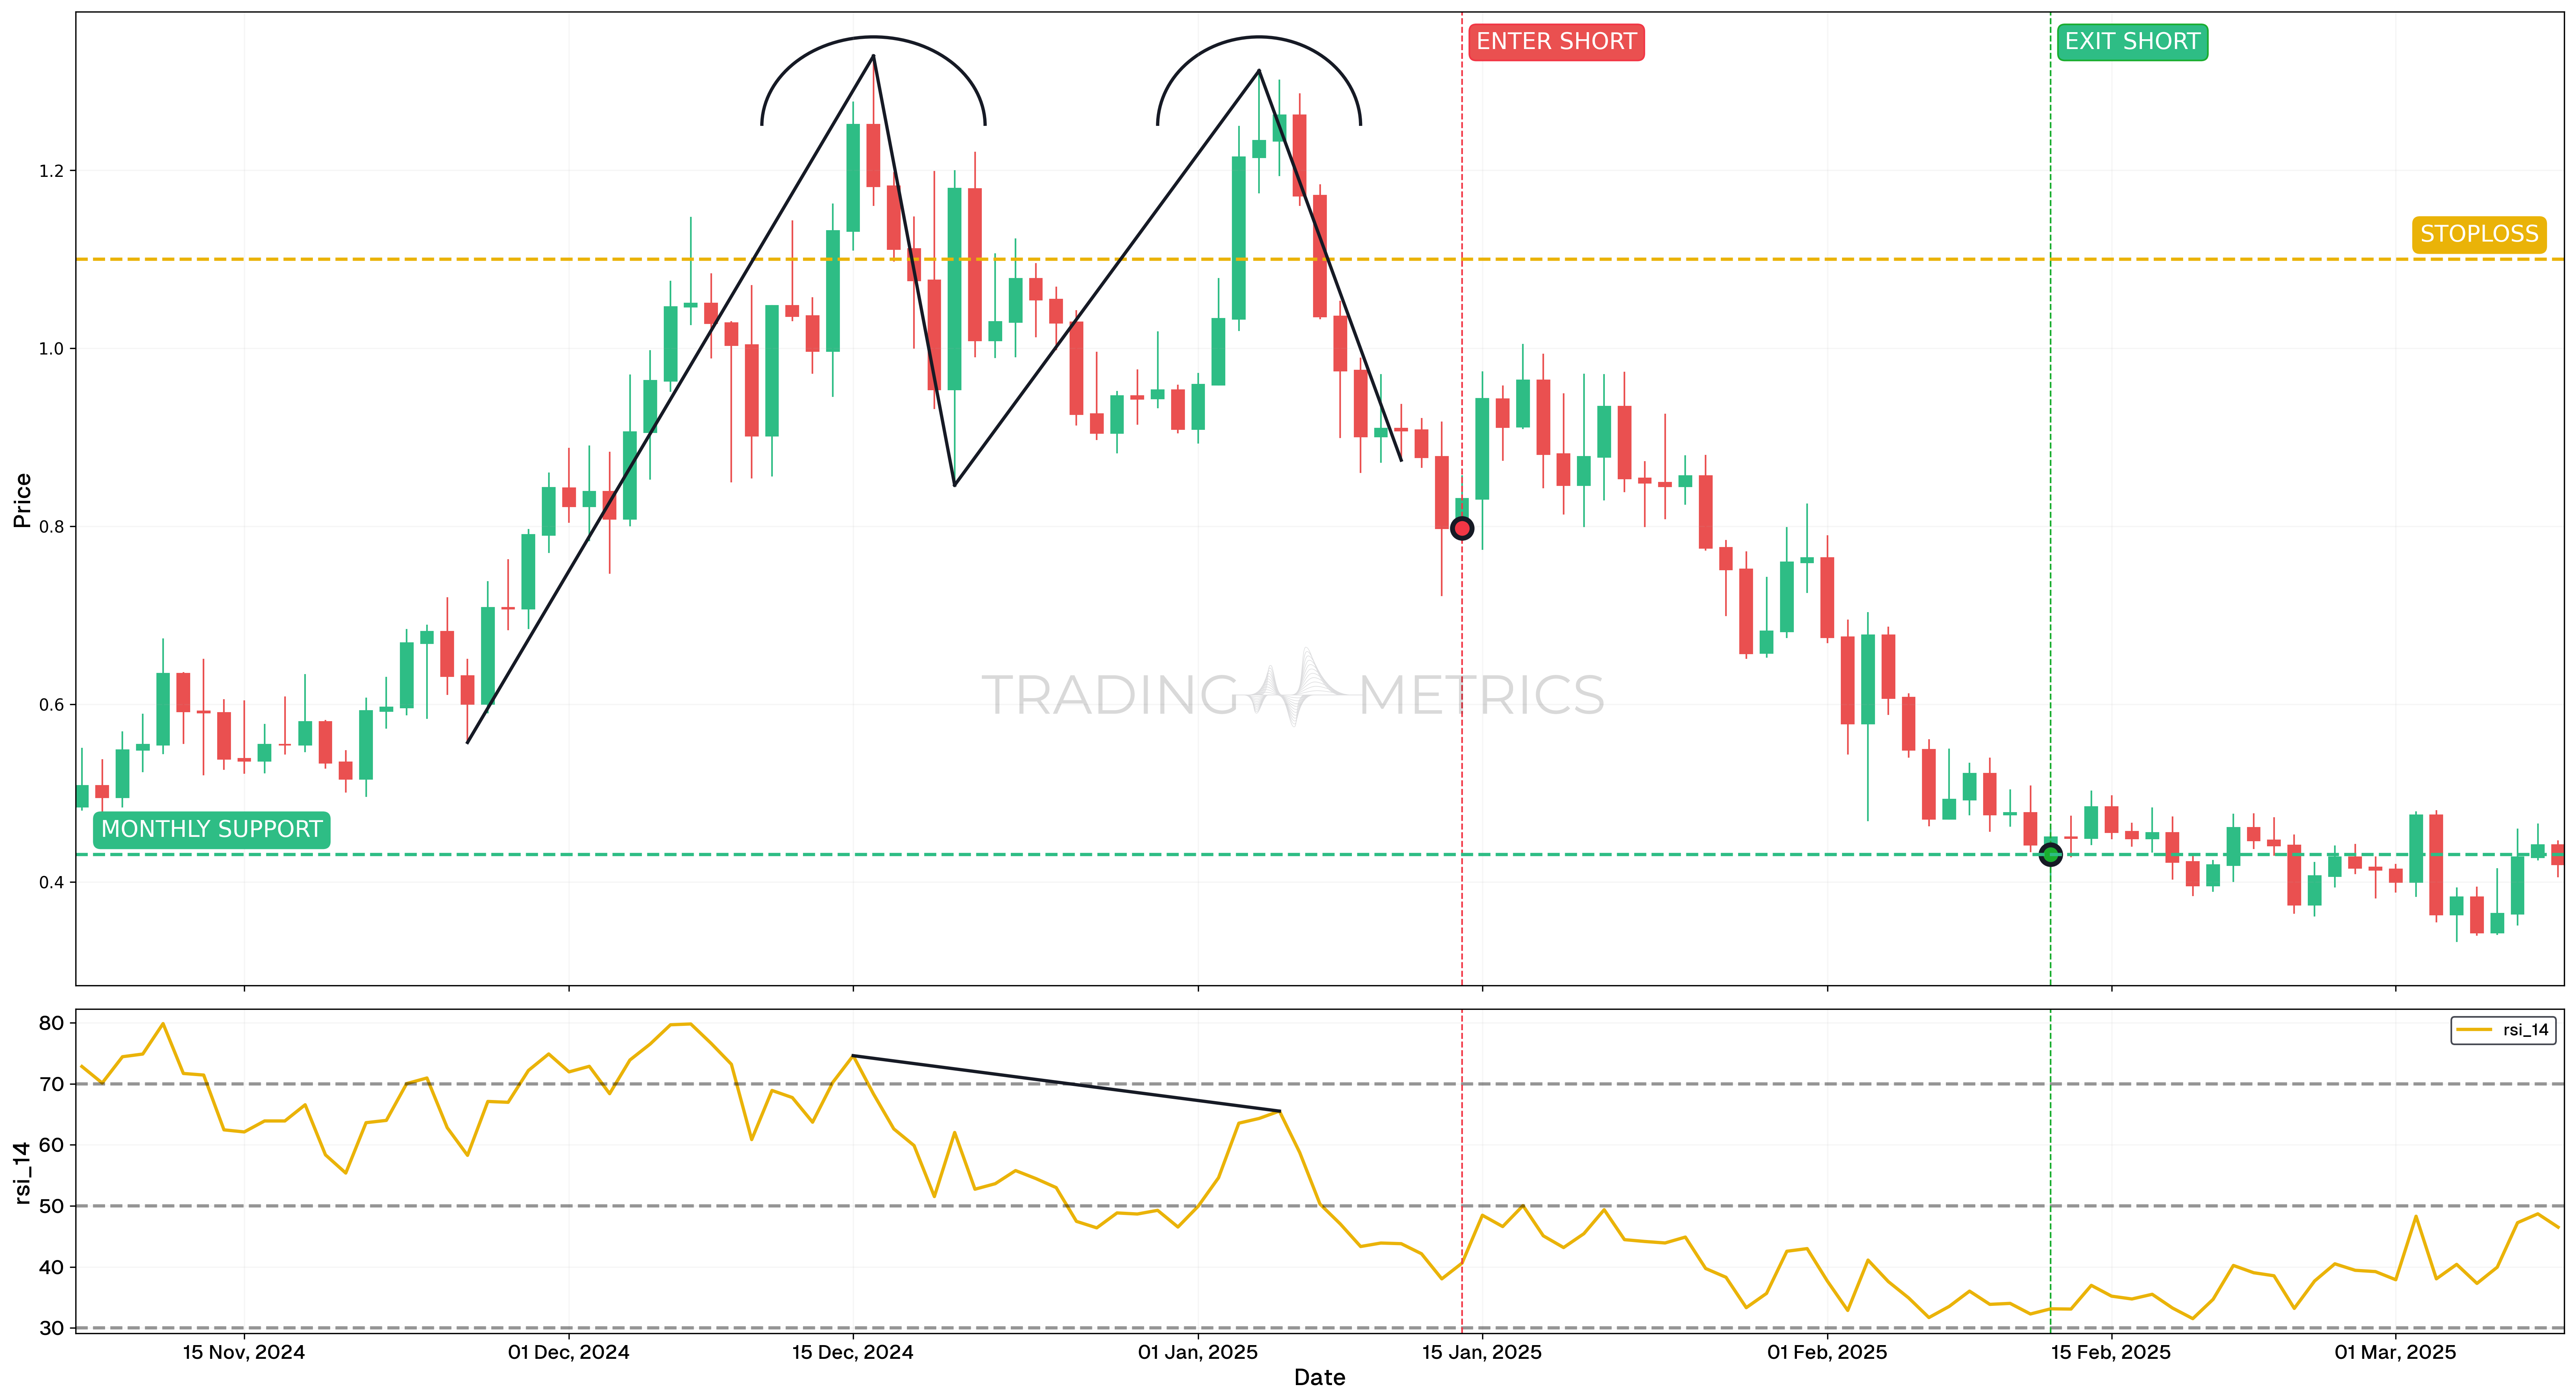
Between November 2024 and early January 2025, ENA/USDT PERP formed a classic Double Top pattern on the daily chart. The price reached a significant high, retraced, and then returned to retest that same level with reduced strength. During this formation, a clear RSI divergence developed, signaling waning bullish momentum.
Around the second top, price action closed below the 50-period EMA, which was previously acting as dynamic support. This technical shift added bearish weight to the pattern. A decisive neckline break in mid-January confirmed the bearish reversal structure.
Trade Setup
- Entry: The trade was entered on January 14, 2025, after price broke and closed below the neckline at $0.7978. Confluence came from multiple factors: a candle closing below the 50 EMA, RSI divergence during pattern formation, and the final break of neckline support.
- Exit: The position was exited on February 12, 2025, at $0.4310, just above a prior support-turned-resistance level. This area aligned with earlier consolidation zones and provided a technically justified profit target.
- Outcome: The trade resulted in a 46% move from entry to exit. The breakdown unfolded cleanly, rewarding patience and pattern confirmation. This setup validated the importance of multi-factor confluence in bearish reversals.
Risk Management
- Stop-Loss placement: The stop-loss was placed at $0.431, defining the maximum allowed risk on the trade. This level acted as an invalidation point in case the pattern failed and price reversed unexpectedly.
- Position sizing: Based on a fixed 2% capital risk model, sizing was calculated using the distance between entry and stop. This preserved account stability and standardized risk.
- Risk-Reward Ratio: The trade had a Risk-Reward Ratio of 1:1.21 - not aggressive, but acceptable given the high-confidence pattern and clean technical structure.
- Volatility Consideration: Altcoin perpetuals like ENA/USDT often exhibit elevated Volatility. Waiting for neckline confirmation and a break below the 50 EMA helped avoid premature entries and reduced whipsaw risk.
- Adaptive Exit Strategy: The exit near $0.4310 was taken at a structurally clean zone. For more aggressive traders, extended downside targets near $0.35 could have been considered, depending on broader market momentum.
Volume Boost: A spike in volume on the neckline break is a green light for a stronger bearish move.
Pre-Trade Checklist
Double Check: Pair the pattern with volume spikes and indicators like RSI to dodge fakeouts and boost your odds.
Key Points
- Peak Similarity: The tops don’t need to be identical, but closer heights improve reliability.
- Time Frame: Works on any chart, but daily or weekly signals pack more punch.
- Combine with Indicators: Lean on moving averages or RSI for confirmation.
- Breakout Confirmation: Wait for the neckline break - it’s the trigger that flips the trend.
- Price Target: Measure from the tops to the neckline, then project down from the break for your goal.
- Risk Management: Set a stop-loss above the second top to cap losses if the pattern flops.
Hold Your Horses: Jumping in before the neckline break can land you in a costly fakeout.
Conclusion
The Double Top pattern is a trader’s go-to for catching bearish reversals. It’s straightforward, reliable when confirmed, and pairs beautifully with tools like volume, RSI, and moving averages. Whether you’re trading crypto, stocks, or forex, mastering this pattern can sharpen your edge. Just stay patient, manage your risk, and wait for the setup to prove itself - those two peaks could be your ticket to a winning trade.
Frequently Asked Questions
Quick answers based on this page's topic.
A Double Top indicates that the market has hit a 'hard ceiling.' Buyers reached a specific price level twice and were rejected both times, signaling that institutional supply is perfectly neutralizing demand and the uptrend is likely exhausted.
The neckline is the support level formed by the trough between the two peaks. Breaking below this level is the final proof that the 'floor' has collapsed. Traders use this break as an objective entry point for short positions.
Measure the vertical distance from the highest peak to the neckline. Project that exact distance downward from the breakout point. This target provides a mathematical expectation of the move's magnitude based on the size of the prior consolidation.
Yes. The two peaks do not need to be at the exact same price. A tolerance of 1% to 3% is common and often reflects natural market behavior. In fact, a slightly lower second peak can be an even stronger bearish signal because it shows buyers could not even reach the prior high.
A valid Double Top requires a decisive close below the neckline, ideally accompanied by a volume spike on the breakdown candle. If the price quickly reclaims the neckline after breaking it, the pattern has likely failed and traders should exit rather than hold a losing short position.