Descending Triangle Pattern: Trading Pressure Against a Floor
The Descending Triangle pattern is a firm bearish continuation signal in technical analysis, often appearing during a downtrend. Imagine it as a tightening grip - price pressing against a flat support line while forming lower highs - before breaking downward. When this pattern emerges, it’s a solid clue that bearish momentum is coiling up, offering traders a chance to sell or short the asset as the downtrend deepens.
How to Identify the Descending Triangle Pattern in Trading
The Descending Triangle is a bearish continuation formation. It develops when price consolidates between a flat support line and a falling resistance line, showing mounting selling pressure. The setup confirms when price breaks below support. Here’s how to spot it:
Start with the Big Picture
This pattern appears during a downtrend. Buyers defend the same floor repeatedly, but sellers step in at lower and lower levels, signaling increasing dominance.
Trace the Triangle Shape
The Descending Triangle is built from two converging lines. Recognizing them confirms the setup.
- Support Line: A flat horizontal boundary where declines stall.
- Resistance Line: A downward-sloping boundary connecting lower highs.
- Triangle Formation: Price compresses between the two lines as pressure builds.
Zero in on the Support Line
The support line is the floor where buyers have repeatedly stepped in. Once this level breaks, the triangle completes.
Watch the Breakdown
The bearish trigger comes when price closes below support.
- A decisive break under the lower boundary or
- A strong bearish candle
Both confirm continuation of the downtrend and trigger the entry.
Check Volume for Additional Confirmation
Volume behavior reinforces the breakout.
- Rises during the prior downtrend.
- Dips as the triangle narrows.
- Spikes on the breakdown, confirming seller control.
Drop Down: Measure the height of the triangle at its widest point (base) and project it downward from the break for a realistic price target.
How to Trade the Descending Triangle Pattern (Trading Example)
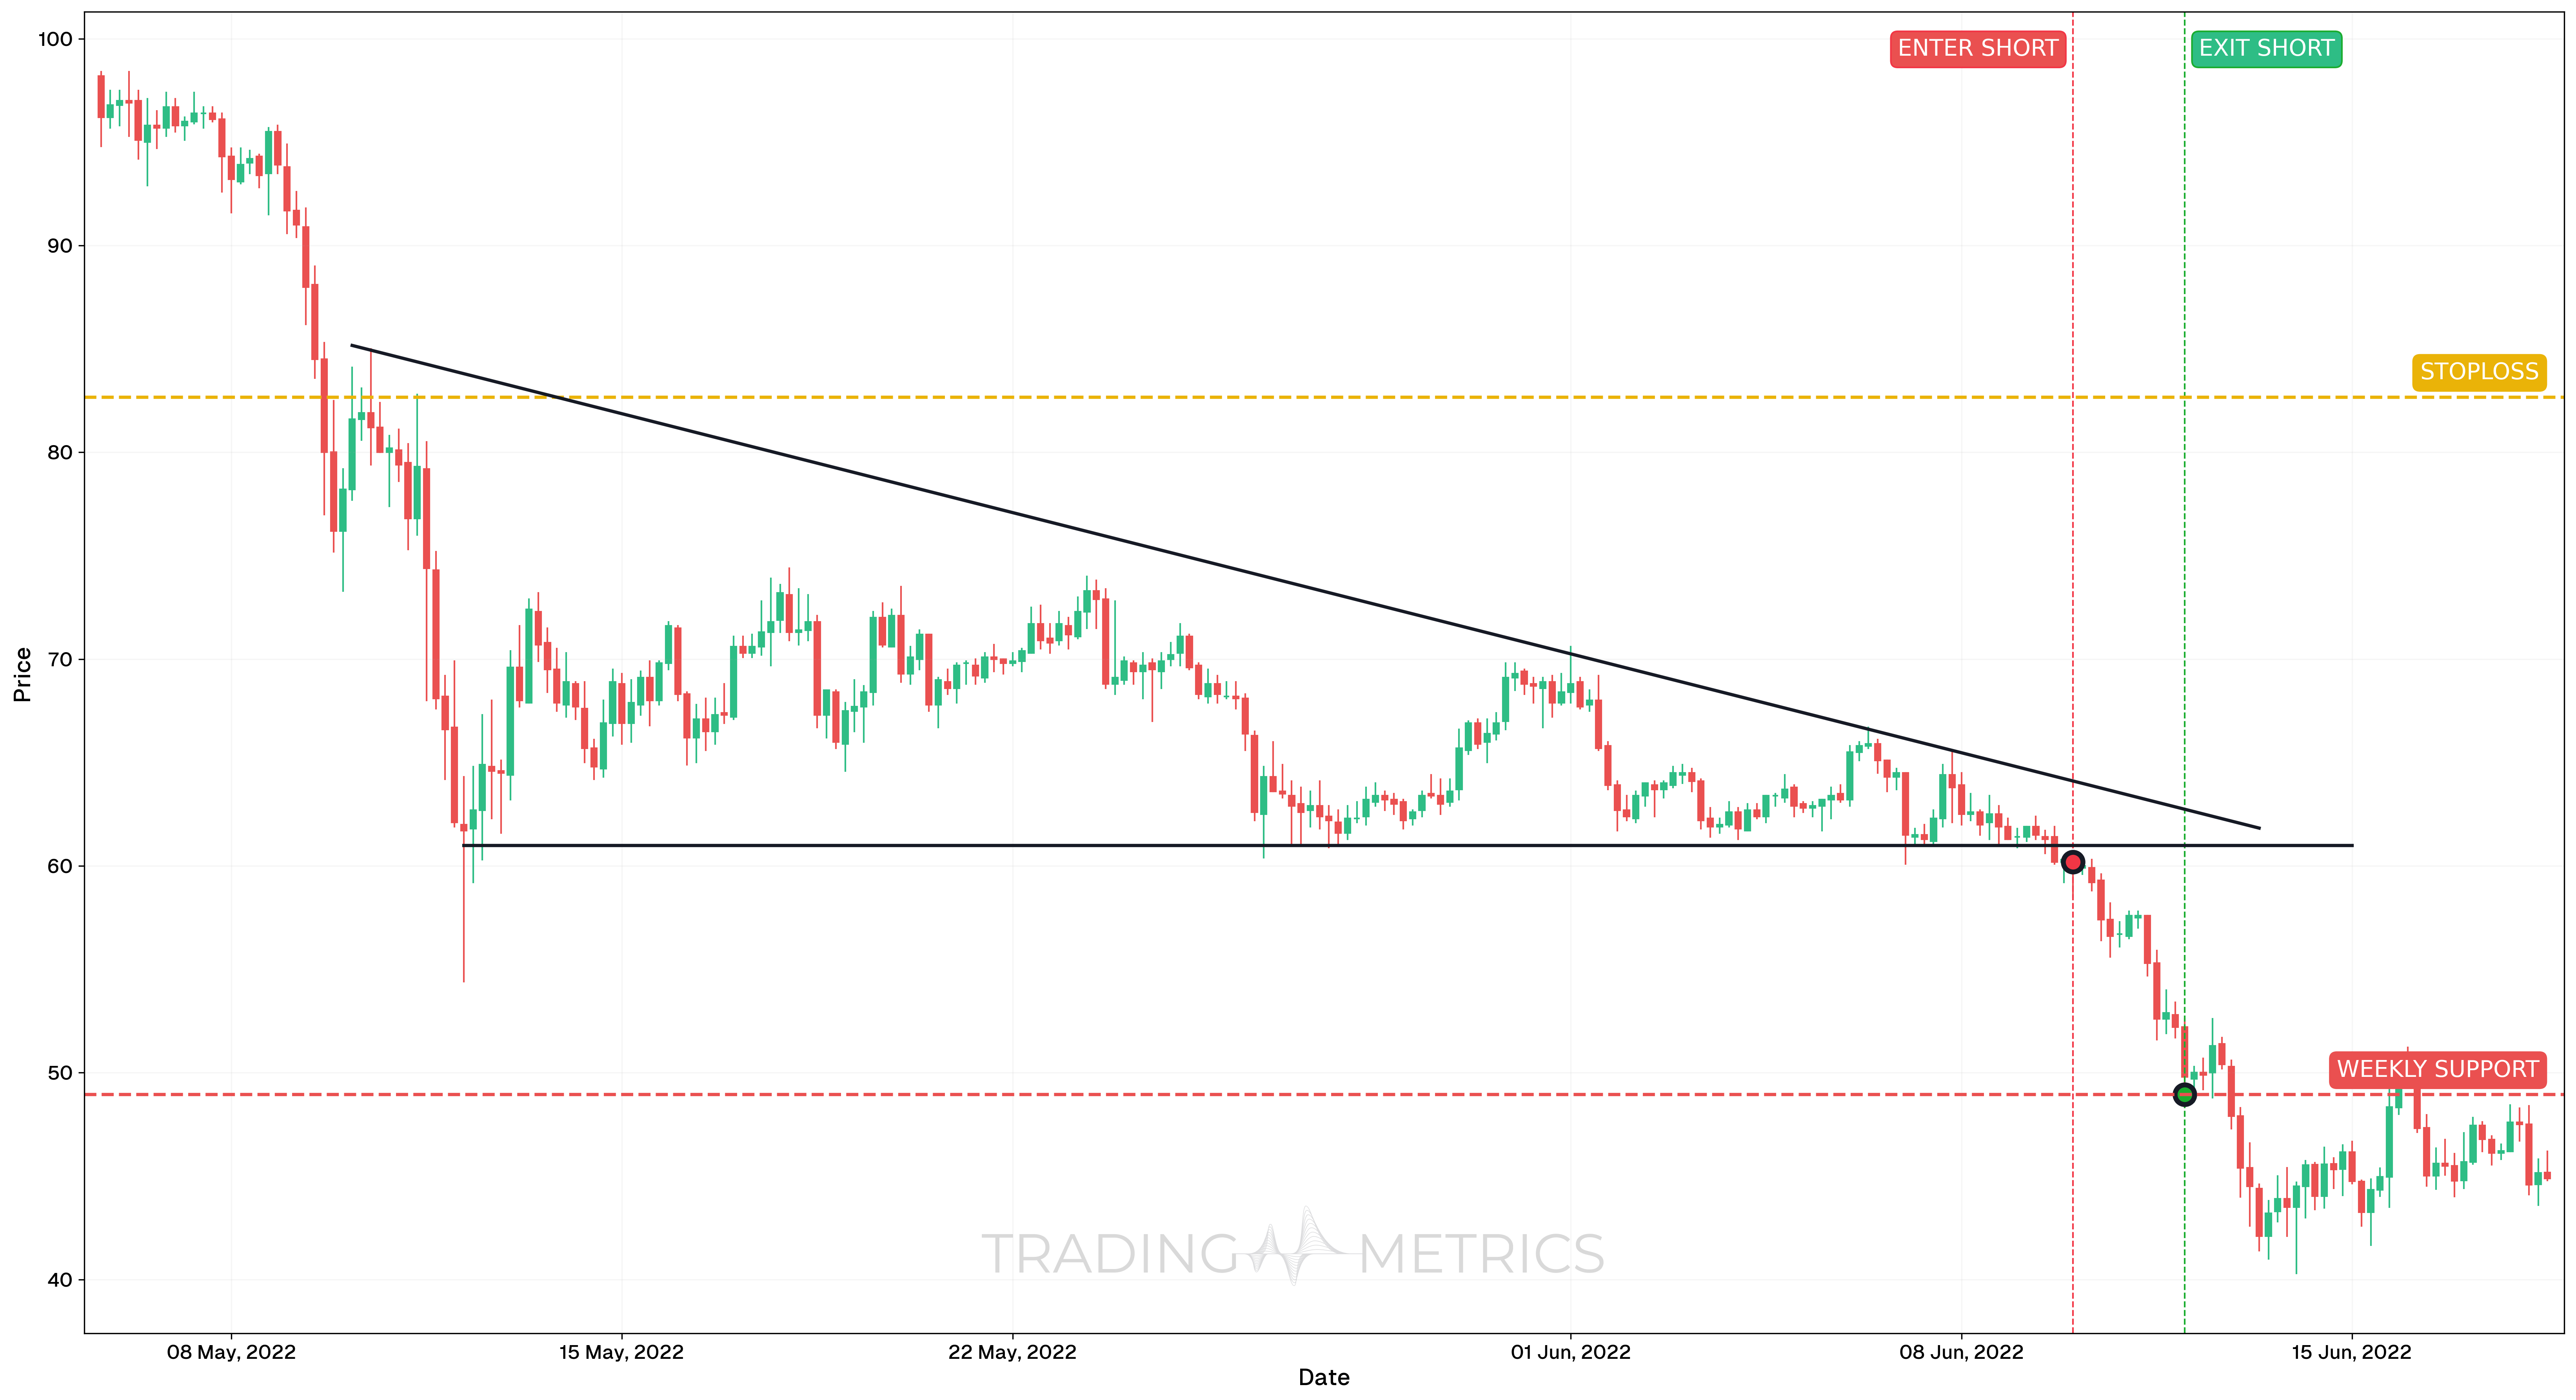
To illustrate how the Descending Triangle pattern can be used to enter a trade, we will use the LTCUSDT pair on the 4-hour chart. This bearish continuation structure formed during a broader downtrend and broke support after multiple tests.
Analysis
From May 5 to June 18, 2022, LTCUSDT formed a textbook Descending Triangle. A flat support zone near $60 was tested several times, while the lower highs revealed seller dominance. The pattern compressed into a breakout point near the end of the structure.
Trade Setup
-
Entry: The short position was taken on June 10, 2022 at 03:00, at $60.20, immediately following a breakdown candle that closed beneath support.
-
Exit: The trade was closed on June 12, 2022 at 03:00, at $48.95, near weekly support and short-term exhaustion levels.
-
Outcome: The Descending Triangle played out with a clean measured breakdown. The quick decline to key support validated the bearish structure.
Risk Management
- Stop-Loss placement: The stop-loss was placed at $82.67, above the descending trendline and invalidation zone, providing room for volatility while preserving structure integrity.
- Position sizing: The trade followed a 2% capital risk model, with size calculated based on the distance from entry to stop.
- Volatility Consideration: The pattern compressed Volatility into the apex and then released momentum sharply on the breakdown.
- Risk-Reward Ratio: This trade produced a Risk-Reward Ratio of 1:0.50, meaning risk was greater than potential reward. It highlights the need for tighter stops or improved entry when the structural risk is higher.
Volume Thrust: A volume spike on the support break drives the triangle into a bearish plunge.
Pre-Trade Checklist
Triangle Proof: Pair the pattern with volume spikes and indicators like RSI to dodge fakes and boost your odds.
Key Points
- Line Clarity: A flat support and declining resistance strengthen the signal - wobbly lines dilute it.
- Time Frame: Hits hardest on daily or weekly charts in active downtrends.
- Combine with Indicators: Use moving averages or RSI to refine your entry.
- Breakout Confirmation: The support break keeps the trend rolling - don’t jump too soon.
- Price Target: Measure the triangle’s base height, project down from the break for your goal.
- Risk Management: Set a stop-loss above the last lower high to limit losses if it fails.
Wait for the Break: Acting before the support break risks a triangle trap - let it descend.
Conclusion
The Descending Triangle pattern is a trader’s firm tool for riding bearish continuations. Its tightening grip, paired with volume, RSI, and moving averages, can spark big drops. Whether in crypto, stocks, or forex, this pattern sharpens your edge. Stay patient, manage your risk, and let the triangle tighten - that coiled pressure could plunge into a winning fall.
Frequently Asked Questions
Quick answers based on this page's topic.
It represents a 'Demand Floor' under attack. While buyers are holding a specific price level (the horizontal line), sellers are becoming increasingly aggressive, pushing the price down from lower and lower peaks. This sequence indicates that supply is slowly overwhelming demand.
Volume typically declines as the triangle narrows, showing a decrease in conviction from both sides. However, a high-probability breakout occurs when volume spikes as the horizontal support finally breaks, signaling that the 'dam has burst' and the downtrend is resuming.
While statistically more likely to break to the downside (continuation), it can occasionally break to the upside if a major news event occurs. Traders should always wait for the decisive close below the support floor before committing to a short position.