Cup and Handle Pattern: A Classic Setup for Trend Continuation
The Cup and Handle pattern is a classic bullish continuation signal in technical analysis, often forming during an uptrend. Picture it as a teacup - price tracing a rounded “cup” followed by a small “handle” consolidation - before resuming its upward climb. When this pattern emerges, it’s a steady sign that bullish momentum is building after a pause, offering traders a chance to buy or go long as the uptrend steeps higher.
How to Identify the Cup and Handle Pattern in Trading
The Cup and Handle is a bullish continuation formation. It develops when price forms a rounded base (the cup), followed by a short consolidation (the handle), before breaking out higher. The setup confirms when price breaks above resistance. Here’s how to spot it:
Start with the Big Picture
This pattern appears during an uptrend. The cup shows a healthy correction and recovery, while the handle signals a brief pause before buyers drive the trend higher again.
Trace the Cup and Handle
The structure has two distinct parts. Recognizing both confirms the setup.
- Cup: A rounded U-shaped move where price declines, bottoms out, and then recovers toward the prior high.
- Handle: A smaller consolidation that drifts sideways or slightly downward, resembling a flag or pennant.
Zero in on the Resistance Line
The resistance line is drawn across the cup’s high point — the level where the prior rally stalled. Once this line breaks, the pattern is complete.
Watch the Breakout
The bullish trigger comes when price closes above resistance.
- A decisive break over the cup’s high or
- A strong bullish candle
Both confirm continuation of the uptrend and provide the entry.
Check Volume for Additional Confirmation
Volume behavior strengthens the breakout.
- Declines at the bottom of the cup as selling fades.
- Builds during the recovery as buyers return.
- Spikes on the breakout, confirming strong bullish momentum.
Pour Up: Measure the height of the cup (from bottom to resistance) and project it upward from the break for a realistic price target.
How to Trade the Cup and Handle Pattern (Trading Example)
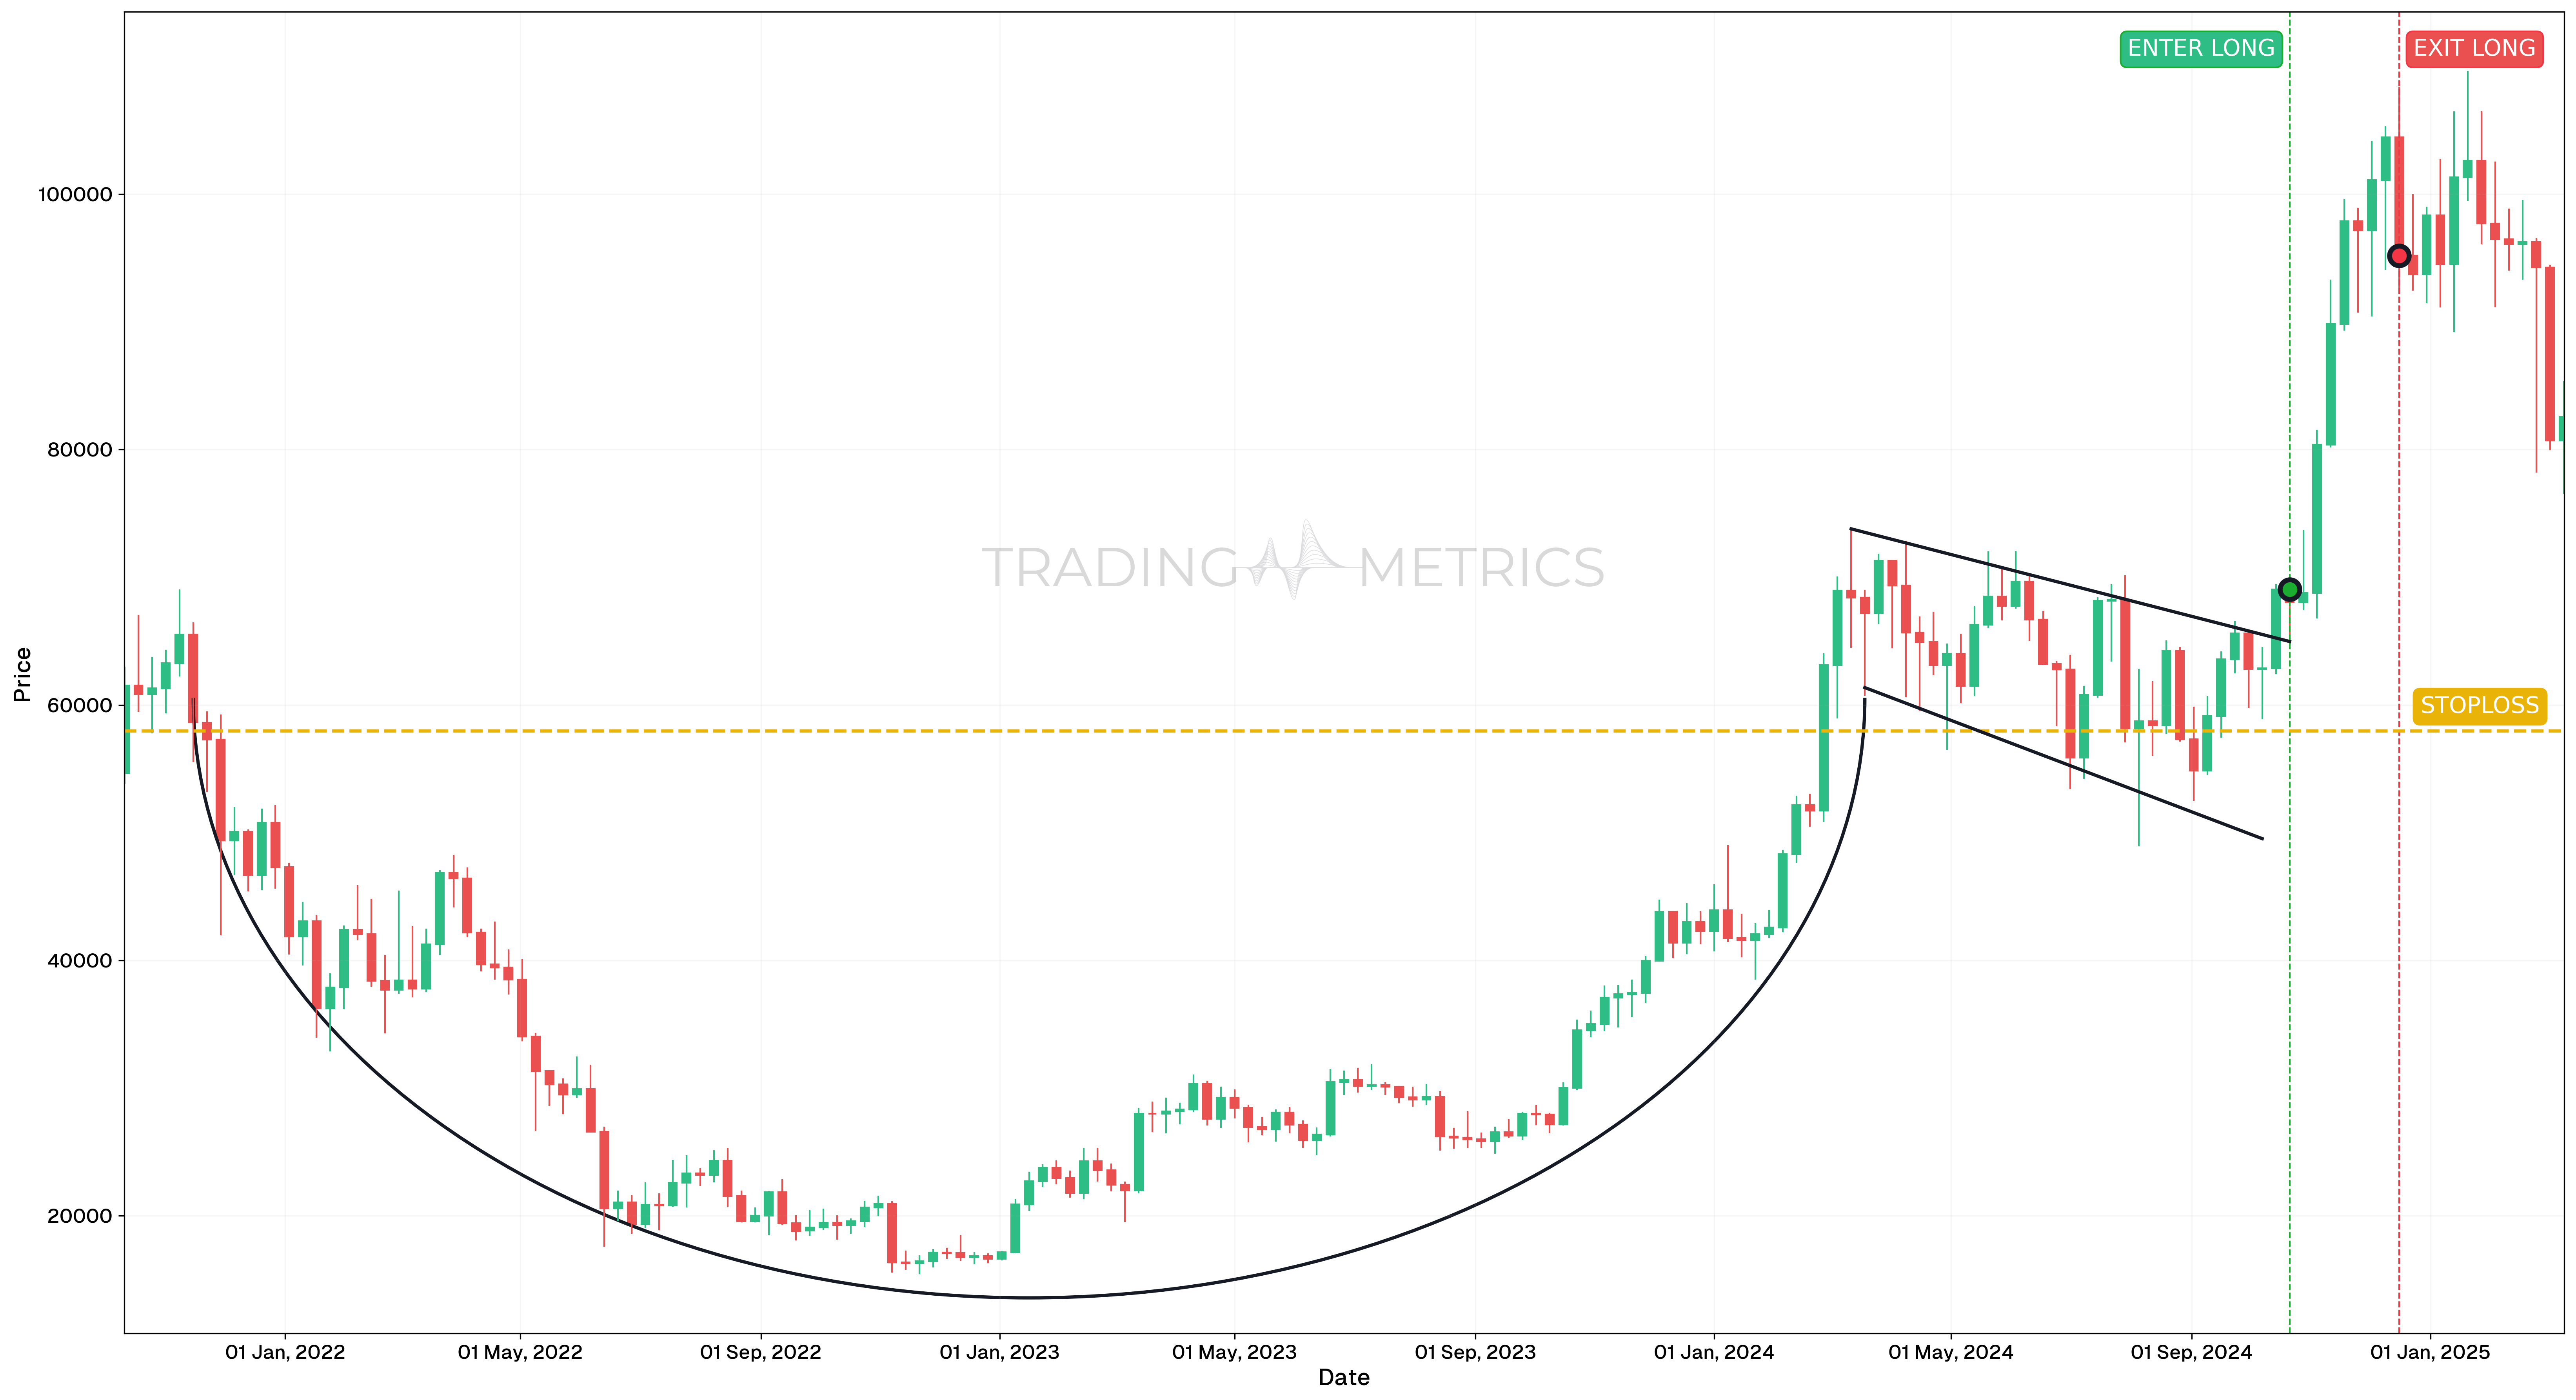
To illustrate how the Cup and Handle pattern can be used to enter a trade, we will choose the BTCUSDT pair. This long-term structure appeared on the weekly chart, offering a powerful continuation setup during Bitcoin’s major uptrend.
Analysis
Between October 2021 and October 2024, BTCUSDT gradually formed a classic Cup and Handle. The cup featured a smooth, Rounding Bottom, reflecting accumulation and fading bearish momentum. This was followed by a brief pullback in the form of the handle. By October 21, 2024, price had broken out above the pattern’s neckline, confirming the continuation of the primary bullish trend.
Trade Setup
- Entry: The position was opened on October 21, 2024, at $69,032, just as price broke above the handle’s resistance. Entry was supported by momentum:
- RSI was above 50 and climbing, suggesting bullish strength
- The breakout candle confirmed the shift from consolidation to expansion
- Exit: The trade was closed on December 16, 2024, at $94,277.62, as RSI fell back below the overbought zone. This signal indicated a potential exhaustion in momentum and justified locking in gains.
- Outcome: The Cup and Handle breakout resulted in a 36.6% gain over the multi-week period, delivering on its long-term continuation potential.
Risk Management
- Stop-Loss placement: The stop-loss was placed at $57,963.24, just below the handle’s swing low, where pattern invalidation would occur.
- Position sizing: A 2% capital risk model was applied, with size calculated based on the distance between entry and stop-loss.
- Risk-Reward Ratio: The trade achieved a Risk-Reward Ratio of 1:2.28, offering a favorable balance between risk and reward over a macro timeframe.
- Volatility Consideration: The weekly structure reflected shrinking Volatility through the handle, followed by expansion post-breakout. This sequence confirmed accumulation and justified breakout participation.
- Adaptive Exit Strategy: Though the position was closed at the first RSI-based reversal signal, long-term holders might trail using weekly moving averages or Fibonacci extensions for larger upside.
Volume Steep: A volume spike on the resistance break pours the pattern into a bullish lift.
Pre-Trade Checklist
Steep the Proof: Pair the pattern with volume surges and indicators like RSI to dodge fakes and enrich your odds.
Key Points
- Cup Shape: A smooth, U-shaped cup boosts reliability - jagged dips dilute it.
- Time Frame: Shines on daily or weekly charts in active uptrends.
- Combine with Indicators: Use moving averages or RSI to refine your entry.
- Breakout Confirmation: The resistance break keeps the trend steaming - don’t sip too soon.
- Price Target: Measure the cup height, project up from the break for your target.
- Risk Management: Set a stop-loss below the handle’s low to limit losses if it spills.
Wait for the Pour: Acting before the resistance break risks a lukewarm fakeout - let it steep.
Conclusion
The Cup and Handle pattern is a trader’s rich brew for riding bullish continuations. Its rounded cup and tight handle, paired with volume, RSI, and moving averages, can pour out big gains. Whether in crypto, stocks, or forex, this pattern sharpens your play. Stay patient, manage your risk, and let the cup fill - that gentle curve could steep into a winning rise.
Frequently Asked Questions
Quick answers based on this page's topic.
A rounded bottom indicates a gradual shift from selling pressure to steady accumulation by institutional buyers. A sharp 'V' shape is considered too aggressive and less reliable, as it lacks the period of stable consolidation needed to support a high-probability bullish continuation.
A high-quality handle should be a relatively small pullback, retracing no more than 30% to 50% of the cup’s total depth. If the handle drops too low, it suggests that selling pressure is still too high, potentially invalidating the bullish continuation thesis.
The optimal entry occurs when the price breaks above the upper resistance line of the handle, preferably on a surge in volume. This confirms that the correction is over and that the primary uptrend is resuming with fresh buying momentum.