Diamond Top Pattern: A Rare High-Conviction Top Formation
The Diamond Top pattern is a rare but striking bearish reversal signal in technical analysis, often surfacing after a strong uptrend. Picture it as a diamond-shaped tug-of-war between buyers and sellers - widening then narrowing - before the price cracks and heads downward. When this pattern forms, it’s a bold clue that bullish momentum is crumbling, handing traders a chance to sell or short the asset as a downtrend looms.
How to Identify the Diamond Top Pattern in Trading
The Diamond Top is a bearish reversal formation. It develops when price action first expands, then contracts, creating a diamond-like shape at the top of an uptrend. The structure ends with a decisive breakdown. Here’s how to spot it:
Start with the Big Picture
This pattern forms after an uptrend. It signals that volatility has peaked and buyers are losing control, setting up a potential reversal to the downside.
Trace the Diamond Shape
The structure is built from two phases that mirror each other. Recognizing these shifts is key to validating the pattern.
- Widening Phase: Price swings grow larger, with higher highs and lower lows - forming the left side of the diamond.
- Peak: The widest point marks the top, where volatility hits its maximum.
- Narrowing Phase: Swings tighten, with lower highs and higher lows - shaping the right side of the diamond.
- Breakout: Price breaks below the lower boundary, confirming the reversal.
Zero in on the Support Line
The lower boundary (or neckline) is the critical support line. Once this line gives way, the diamond pattern completes.
Watch the Breakdown
The bearish trigger comes when price closes below support.
- A decisive close under the trendline or
- A sharp bearish candle
Both confirm the breakdown and the start of the reversal. That’s your entry trigger.
Check Volume for Additional Confirmation
Volume provides confirmation.
- Spikes during the widening phase as volatility builds.
- Fades as the swings narrow.
- Surges again on the breakdown, verifying the bearish move.
When that jump appears, the Diamond Top’s reversal is validated.
Measure the Move: Take the height from the peak to the base of the diamond and project it downward from the break for a solid price target.
How to Trade the Diamond Top Pattern (Trading Example)
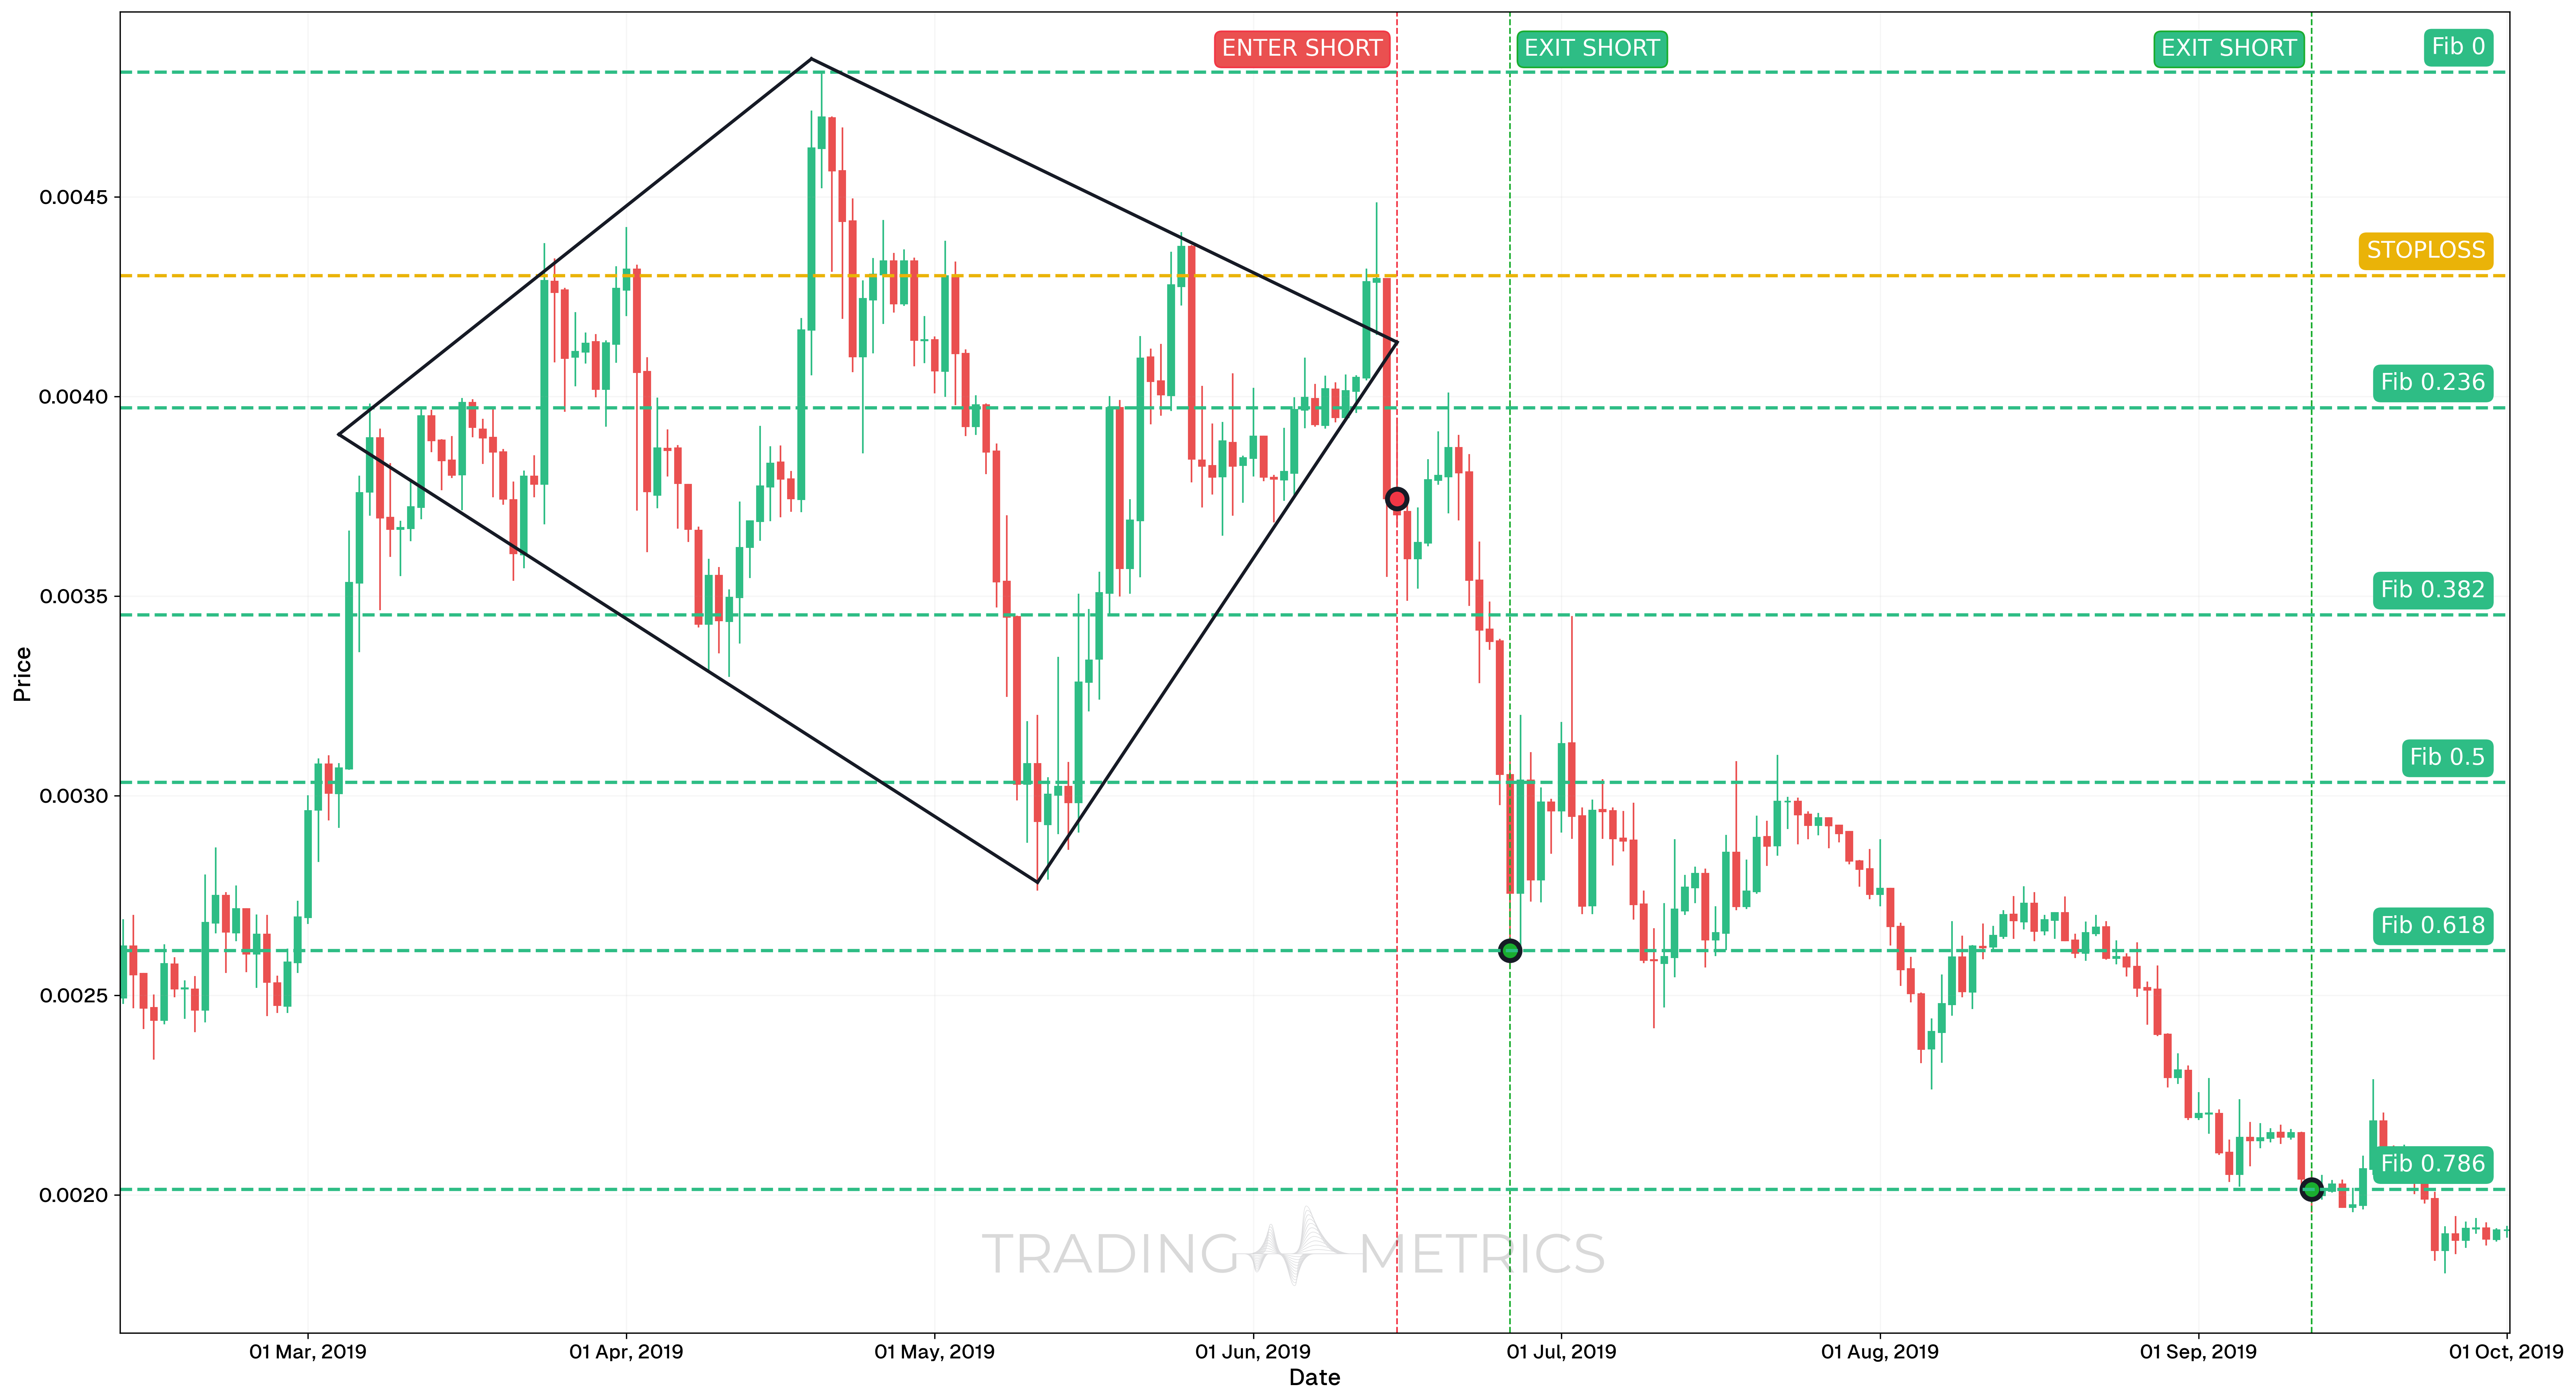
To illustrate how the Diamond Top pattern can be used to enter a trade, we will choose the BNBBTC pair. This bearish structure formed on the daily chart, showing a clear distribution phase before a breakdown that led to multiple Fibonacci-based profit-taking levels.
Analysis
Between February and June 2019, BNBBTC formed a classic Diamond Top reversal structure. The pattern began with a broadening price range, followed by a contraction near the top. This suggested distribution at higher prices, which eventually broke down into a strong bearish trend in the following weeks.
Trade Setup
-
Entry: The short position was entered on June 15, 2019, at 0.004303, shortly after price broke below the lower edge of the Diamond Top structure. Entry was supported by:
- A Abandoned Baby (bearish) pattern near the peak
- RSI trending below 50 and falling
- StochRSI also moving downward, signaling short-term bearish momentum
-
Exit: The position was closed in multiple stages, based on Fibonacci Retracement levels from a prior major leg:
- June 26, 2019 (TP1): 0.682 retracement hit at 0.002612
- September 12, 2019 (TP2): 0.786 retracement hit at 0.002014
-
Outcome: The Diamond Top pattern provided a clean reversal setup. Exiting in steps at logical retracement zones allowed for strong reward extraction as price fell sharply.
Risk Management
- Stop-Loss placement: The stop-loss was placed at 0.004303, directly at the breakout candle high. This kept risk defined and respected the integrity of the bearish pattern.
- Position sizing: Trade sizing followed a 2% capital risk model, adjusted for the difference between entry and stop.
- Volatility Consideration: Volatility was elevated during the initial structure but began to contract as price neared breakdown. Entry timing after confirmation helped reduce false signal risk.
- Adaptive Exit Strategy: The use of Fibonacci Retracement levels enabled gradual profit capture aligned with market structure rather than emotion.
Volume Spark: A volume surge on the support break polishes the diamond’s bearish shine.
Pre-Trade Checklist
Cut the Noise: Match the pattern with volume kicks and indicators like RSI to dodge fakes and stack your odds.
Key Points
- Shape Clarity: The diamond’s widening-then-narrowing form is key - fuzzy lines dilute it.
- Time Frame: Shines brightest on daily or weekly charts.
- Combine with Indicators: Pair with moving averages or RSI for precision.
- Breakout Confirmation: The support break is the trigger - hold off until it hits.
- Price Target: Measure from peak to base, project down from the break for your aim.
- Risk Management: Set a stop-loss above the peak to limit fallout if it fails.
Stay Sharp: Moving before the support break risks a costly miscut - wait for the shine to fade.
Conclusion
The Diamond Top pattern is a gem for catching bearish reversals - rare, but dazzling when it works. Its unique shape, teamed with volume, RSI, and moving averages, can light up big opportunities. Whether in crypto, stocks, or forex, mastering this pattern sharpens your edge. Be patient, manage your risk, and let the diamond fully form - its collapse could be your profit’s sparkle.
Frequently Asked Questions
Quick answers based on this page's topic.
The Diamond Top represents a transition from a 'broadening' phase of market indecision to a 'contracting' phase of seller dominance. It shows the bulls tried to push higher but were met with erratic resistance, eventually getting squeezed as sellers seized total control of the range.
Confirmation is triggered when the price closes decisively below the lower right-hand support trendline of the diamond. This exit from the narrowing range signals that the distribution phase is over and a new bearish trend has officially begun.
Yes, the Diamond Top is a relatively rare but highly reliable bearish signal. Because it involves a complex shift in volatility, it usually marks a major cycle top on higher timeframes, making it a favorite for swing traders looking for macro reversals.